
Trend Following Part 1: Trading in the Direction of Least Resistance
Trend following is one of the oldest and most academically validated approaches to trading. It's also widely misunderstood by retail traders who apply the name to short-term chart reading. Here's what trend following actually is before we discuss how retail traders use it.

Learning Path Stage 6: Find Your Strategy
Learning Level 1: Recognition
Primary Learning Objective
By the end of this lesson, you will be able to explain what trend following is, how it generates edge, and why it's one of the most thoroughly documented approaches in trading.
The Core Logic: Riding the Momentum Wave
Markets do a lot of things, but their most profitable habit is moving in extended runs. These runs almost always last longer than the average person expects.
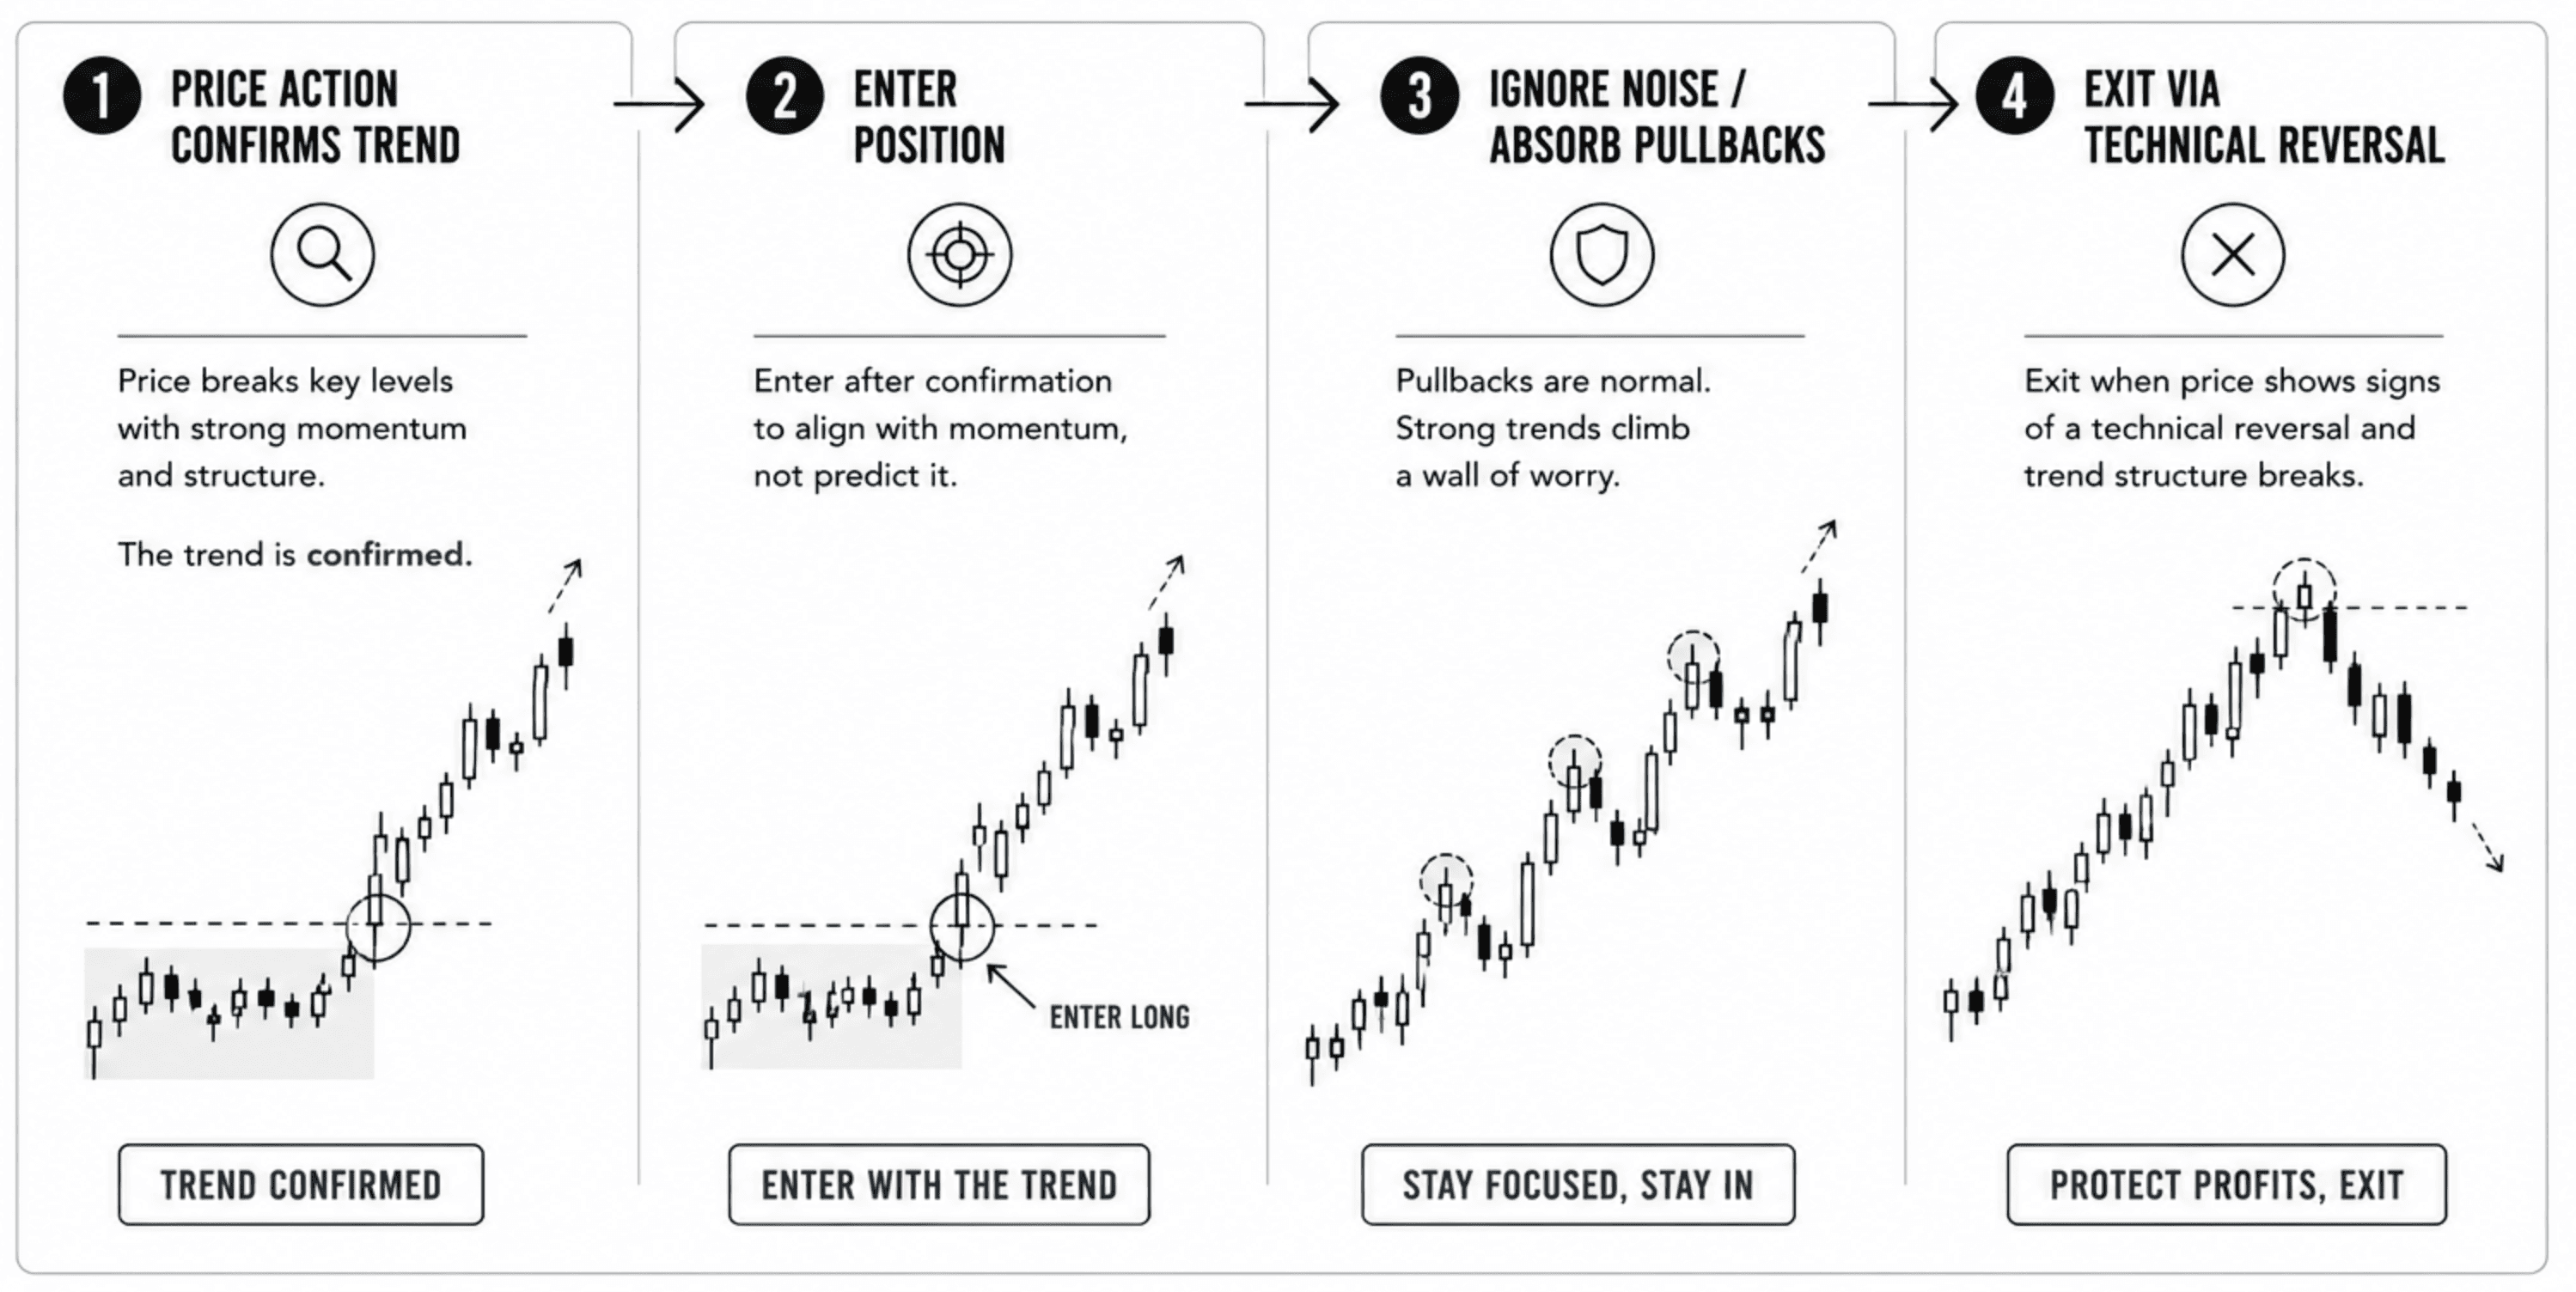
Trend following is built entirely around that single, stubborn observation. The system requires no forecasting, no crystal balls, and zero attempts to predict exactly where a market will bottom or top. Instead, you simply look at the user interface of your charts, identify a trend that is already in motion, position yourself in that direction, and hold on until the data explicitly proves it’s over.
You are a responder, not a prophet. You react to what price is doing right now.
How It Works in Practice
To build a functional trend-following engine, you must replace gut feelings with clean, mathematical rules—using price crossovers, breakouts, or structural signals to answer one objective binary question: “Is this instrument trending up or down?” There are no judgment calls or "vibes" allowed. Once your technical criteria are met, you execute.
Here is how the operational design patterns break down:
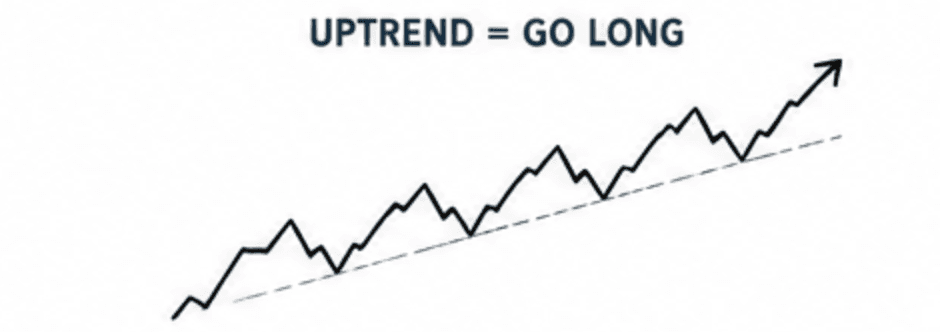
Uptrends: You go long.
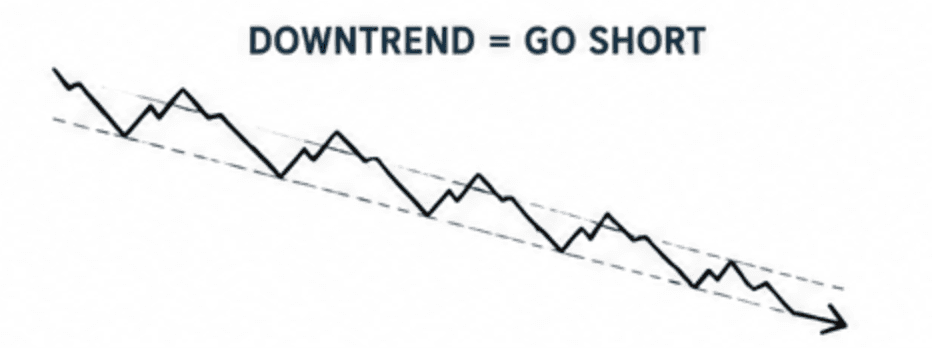
Downtrends: You go short.
Duration: You hold for as long as the macro structure persists.

Position Sizing: Your size stays constant or scales up systematically as the trend proves itself.

Exits: Your exits are triggered exclusively by technical reversal signals, never by arbitrary profit targets.

Loss Management: Bad signals are cut fast, with zero negotiation or emotional bargaining.

🧠 The Cognitive Friction Point: That last point is where most traders experience a massive psychological breakdown. Holding a position that was up 30% while it pulls back to 15% demands an incredibly specific kind of conviction. It requires a mental model rooted entirely in the long-term math, rather than a frantic desire to predict what happens on the next individual candle.
The system has no idea whether this specific trade will be a home run or a dud. It just knows that across a sample size of 100 trades, the winners will be vastly larger than the losers. That is your entire edge.
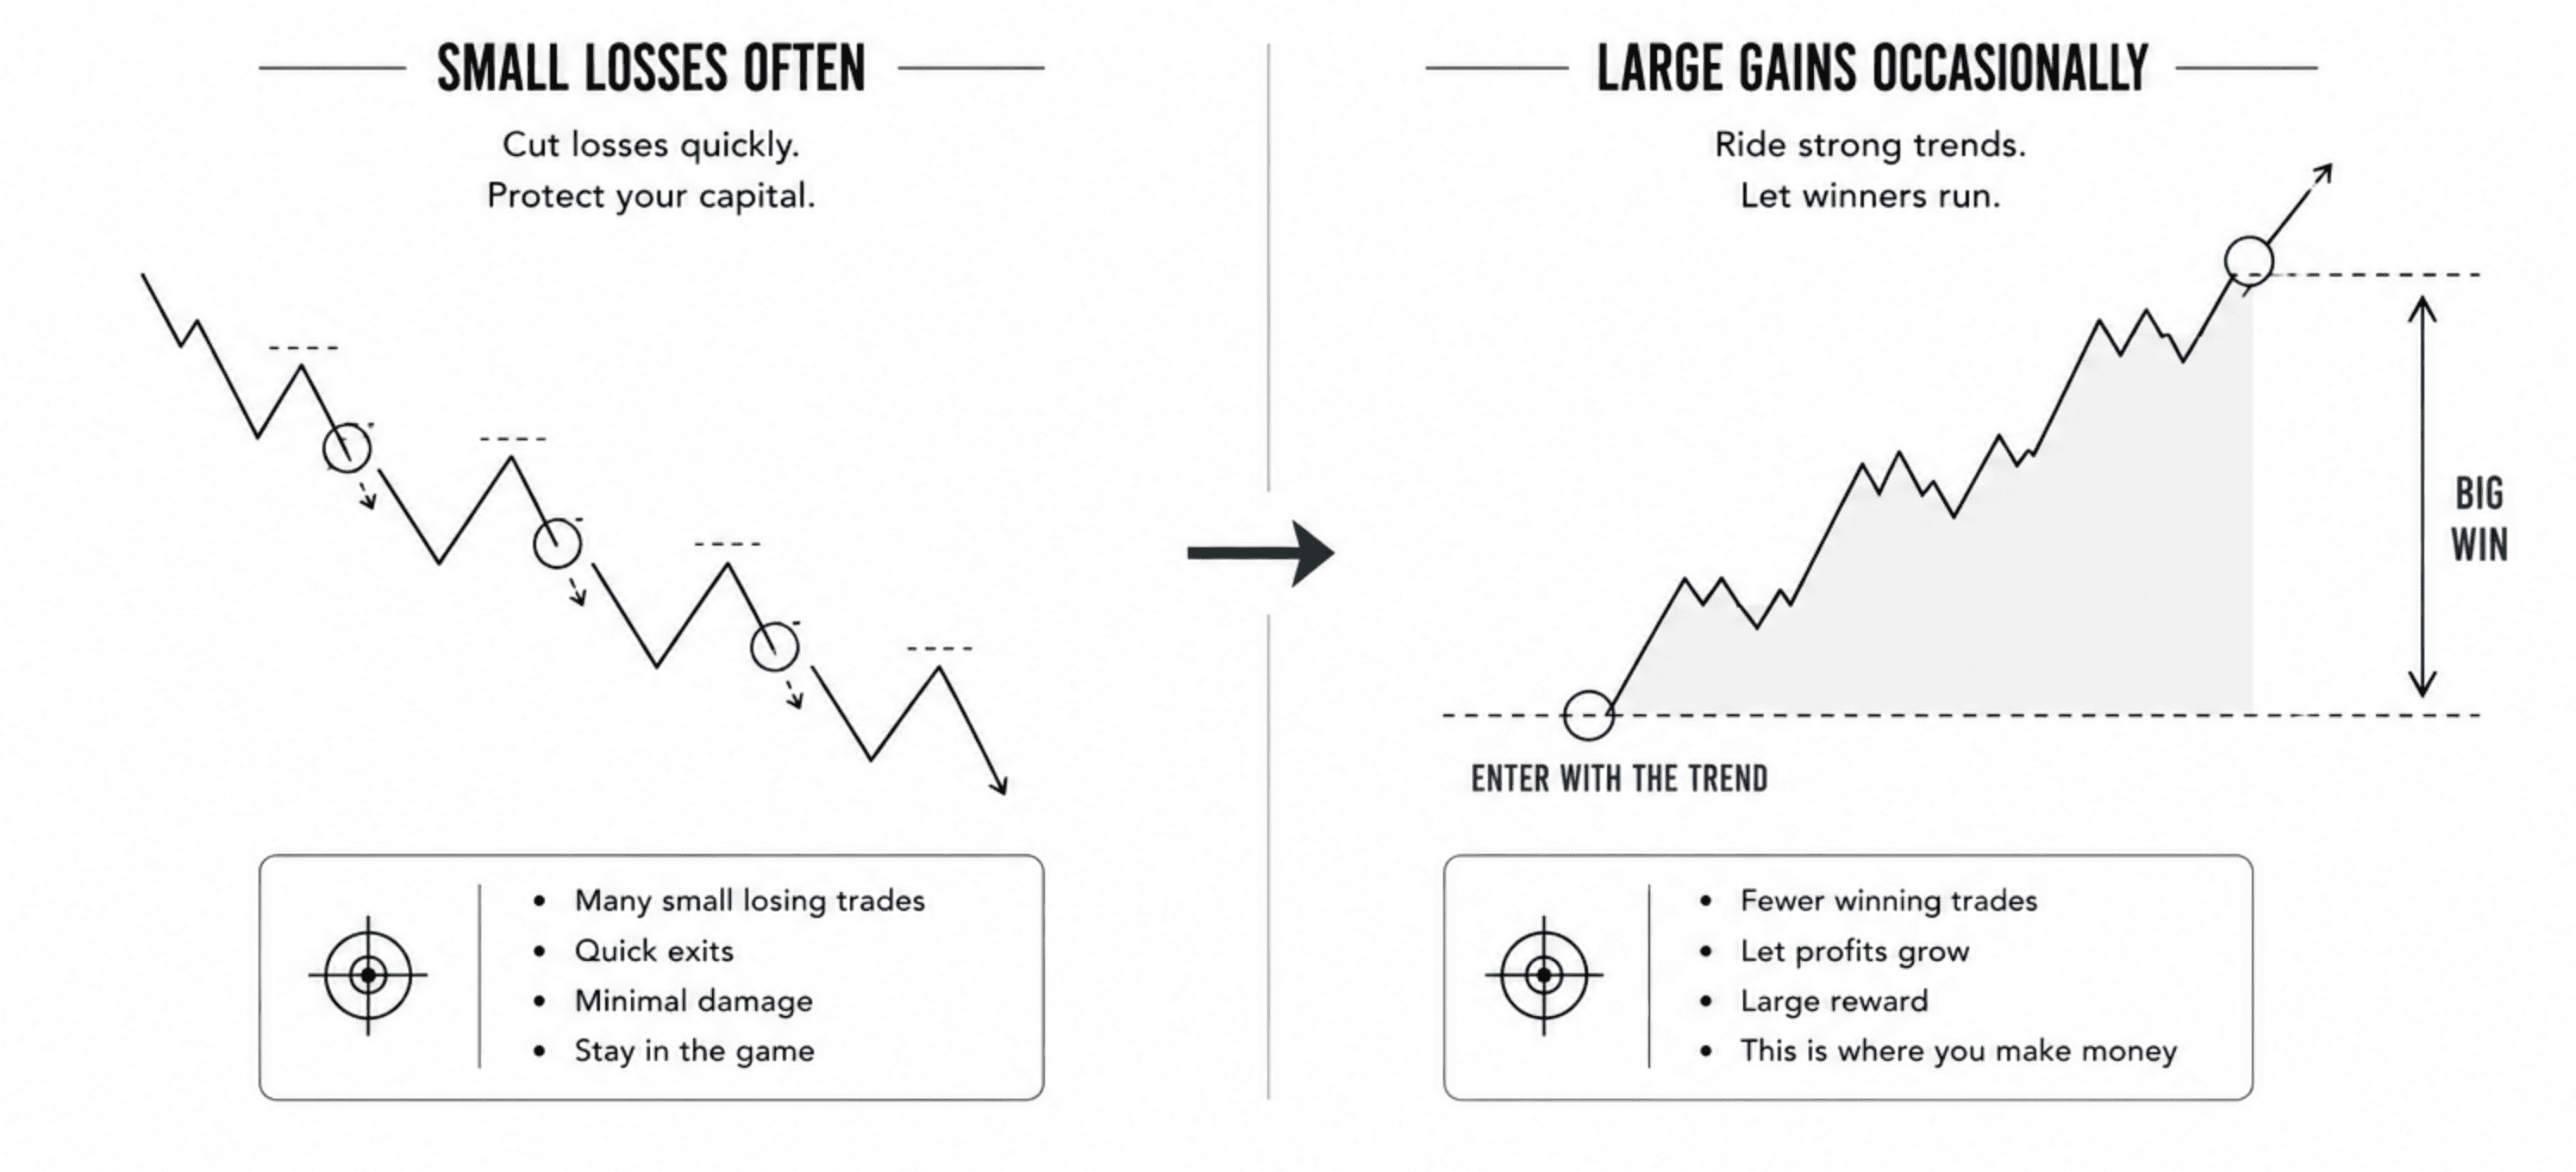
Positive expectancy is born when your average win dwarfs your average loss, applied consistently across multiple instruments over time.
The Historical Evidence: Built on Data, Not Anecdotes
Trend following isn't just a popular internet theory; it is one of the most thoroughly studied and academically validated systematic strategies in existence. The evidence for its long-term viability—particularly across diversified futures portfolios—is incredibly robust.
The 200-Year Milestone: Research published by AQR Capital Management demonstrated that trend-following signals have historically generated positive expectancy across multiple asset classes over two centuries of data.
The Academic Foundation: The landmark paper “Time Series Momentum” (Moskowitz, Ooi, and Pedersen, 2012) rigorously documented the statistical basis for trend persistence across 58 different futures markets.
The Long View: “A Century of Evidence on Trend-Following Investing” extended the underlying data all the way back to the 1880s, proving its resilience across wildly different economic eras.
This is peer-reviewed, hard data open for public scrutiny. It isn't a collection of selective Twitter screenshots or "trust me" trading course marketing.
The Critical Qualifier
This academic defense applies strictly to diversified, systematic, long-timeframe implementations. It is not a blanket guarantee that an individual retail trader loading into a single exponential moving average (EMA) crossover on the EUR/USD will automatically make money.
The research describes aggregate performance across dozens of markets, hundreds of trades, and multiple economic regimes. When you shrink the asset pool down to just one or two instruments, shorten the timeframes, and layer discretionary human judgment on top, your performance variance spikes dramatically.
What Retail Traders Call "Trend Following"
In retail day trading and scalping communities, the term "trend following" is used a bit more casually. If a trader looks at a chart, notes that a market is moving up, and looks for an entry using a couple of EMAs or an Average Directional Index (ADX) indicator, they usually slap the trend-following label on it.
That is a completely valid style of discretionary trading, but it’s a very different animal than the institutional, systematic macro-strategy backed by the academic literature.
Feature | Institutional Trend Following | Retail "Trend Following" |
Diversification | High (50+ global futures markets) | Low (1 to 3 favorite instruments) |
Timeframe | Daily / Weekly charts (Weeks to Months) | Intraday / Daily charts (Hours to Days) |
Execution | Strict, programmatic rules | Discretionary context + technical bias |
This distinction matters because it fixes your expectations. When a frustrated trader on a forum claims that "trend following doesn't work anymore," they are almost always describing an emotional, discretionary approach applied to one or two instruments over a brief, choppy market environment. They aren't talking about institutional systems running across global macros.
Both approaches share the same name, which creates a massive amount of confusion about what the historical data actually validates.
The Core Principle
Strip away the underlying asset classes, the specific entry signals, the exit rules, the timeframes, and the software setups. Whether you are an institutional quantitative fund managing billions or a retail trader executing on a desktop app, the foundational principle remains identical:
Price trends naturally persist, and keeping your positions aligned with the direction of that persistence is the primary source of your market edge.
Everything else is just a tactical implementation of that single truth. The overarching design concept is simple. The daily execution, however, demands a level of psychological discipline that catches most practitioners completely off guard.
The Series Ahead
This article is Part 1 of a comprehensive, six-part series designed to break down this classic approach from the ground up:
Part 2: The Psychological Friction – Why this strategy has stayed highly profitable for over a century precisely because it is so intensely uncomfortable for the human brain to execute.
Part 3: The Hard Mechanics – A deep dive into the technical rule sets: how breakout entries, trailing stops, and position sizing work in the real world.
Part 4: The Curated Signal – A filtered guide to the absolute best books, white papers, and historical resources written by real practitioners.
Part 5: Field Notes – A personal, transparent account of deploying and testing this approach firsthand.
Part 6: Designing a Clean Backtest – How to run historical data tests properly without over-optimizing or lying to yourself about the results.
At its core, trend following is about surrendering the need to be right about the future, positioning yourself in the direction the market is already moving, and having the discipline to stay there until the data says otherwise.
Success Criteria
After completing this lesson, you should be able to describe the core logic of trend following, identify who it tends to work for, and explain what makes it structurally different from other approaches.
Common Misconception
Trend following requires predicting where markets will go.
The Truth: The approach is explicitly non-predictive; it identifies existing trends and follows them, and applying the prediction frame is the conceptual error that leads most beginners to misapply it.
FAQ's
Q: Who are the famous trend followers?
Q: Can retail traders actually use trend following?
Q: Is trend following the same as "trading with the trend"?
Table of Contents
About Me

Krista Weber
After a career as a VP of UX and EdTech executive, I retired early—and quickly realized the traditional world of trading education is fundamentally broken.
As someone with a Master’s in HCI who specialized in the design of e-learning systems, I saw a massive gap: beginners aren't failing because trading is impossible; they’re failing due to massive cognitive overload and terrible instructional design.
This site bridges that gap. I’m applying the principles of learning science, systems thinking, and minimalist UX to strip away the market noise and teach trading the way it actually should be taught.
Stay in Touch
Some of the pages on my travel blog contain affiliate links. Whenever you buy something through one of these links, I get a small commission at no extra cost to you. As an affiliate, I only recommend products and services that I feel are high quality and helpful to my readers. Thanks for your support.
Read More

Open almost any trading platform and you'll see EUR/USD sitting next to XAU/USD, NQ, ES, and a dozen CFDs on stocks you've heard of. They all show up as candlesticks moving left to right, which quietly implies they're all the same kind of thing. They aren't. Before going deeper into any one of them, it's worth drawing the map.
Updated on Sep 6, 2026

Futures are standardized contracts tied to defined specifications and a future settlement date. They can look complex at first, but the mechanics become much clearer once you know what the contract specification controls. Here's what you actually need to know.
Updated on Sep 6, 2026

CFDs appear everywhere in retail trading – but most new traders couldn't explain exactly what they are or why that matters. Here's a plain-language breakdown, including the parts that most introductions skip.
Updated on Sep 6, 2026