Breakout Trading Part 4: Legitimate Learning Resources
Breakout trading resources are abundant and generally high quality — partly because the approach is old enough to have accumulated genuine practitioner wisdom, and partly because the mechanical nature of breakouts makes them highly teachable.

Learning Path Stage 6: Find Your Strategy
Learning Level 3: Application
Primary Learning Objective
By the end of this lesson, you will be able to identify legitimate resources for learning breakout trading and distinguish them from content that over-represents the approach's reliability.
The Noise Filter
The internet is a magnificent place for learning how to code, look up recipes, or watch videos of cats being startled by cucumbers. But if you type "how to trade breakouts" into a search engine, the information landscape turns into a toxic swamp of Lamborghini thumbnails, "guaranteed" indicators, and high-production-value courses hosted by twenty-somethings who look like they’ve never experienced a margin call in their lives.
As a professional who values low cognitive load and clean system design, your goal shouldn't be to consume more content. It should be to build a hyper-aggressive filter that separates historical reality from marketing garbage.
Let's strip away the noise and build a clinical, zero-cost curriculum for mastering breakout mechanics.
The Hard Copy: Books Worth Your Finite Shelf Space
You do not need to buy a $2,000 masterclass. Everything you actually need to understand about the mathematical edge of breakouts was written decades ago in these three texts:
1. The Complete Turtle Trader by Michael Covel
The Pitch: The ultimate post-mortem on Richard Dennis’s famous 1980s experiment where he trained normal, non-professional people to trade a mechanical 20-day breakout system.
Why it matters: It is the definitive case study on why breakout trading has a structural, long-term edge—and why that edge requires you to treat false breakouts as an ordinary cost of doing business rather than an existential system failure.
2. Reminiscences of a Stock Operator by Edwin Lefèvre
The Pitch: A fictionalized biography of Jesse Livermore, one of history's most famous (and volatile) breakout operators.
Why it matters: Livermore didn't call it a breakout; he called it "waiting for the tape to confirm." While it's a historical narrative rather than a step-by-step instruction manual, it examines his deep intuition for reading market momentum before modern charts even existed.
3. Technical Analysis of the Financial Markets by John Murphy
The Pitch: The undisputed, incredibly dry dictionary of charting.
Why it matters: The chapters on triangles, flags, and rectangles cover the exact physics of pattern formation, measuring principles, and volume characteristics. It reads like a technical appliance manual, which is exactly why it's useful (and boring).
The Zero-Dollar Digital Curriculum
If you want to organize your study notes without spending a dime, stick exclusively to these platforms:
BabyPips: Chart Patterns and Breakout Entries: The School of Pipsology remains the gold standard for foundational retail education. Their chart patterns section breaks down triangles, wedges, and rectangles into highly legible, sequential lessons. It's clean, self-paced, and free up until high school.
Investopedia: Specifically, their technical brief on How to Trade Breakouts. It is a clinical reference guide for volume confirmation and practical false-break filtering.
TradingwithRayner (Rayner Teo): If you prefer video content, Rayner’s deep dives into consolidation identification and the mechanical difference between aggressive entries versus conservative retests are exceptionally practical and completely free of flashy lifestyle nonsense.
The Sandbox: Your 3-Phase TradingView Practice Protocol
Reading about breakouts is passive recognition. Operating a breakout strategy under pressure requires actual pattern recognition muscle memory. Use this three-phase protocol on historical data before you even consider risking live capital.
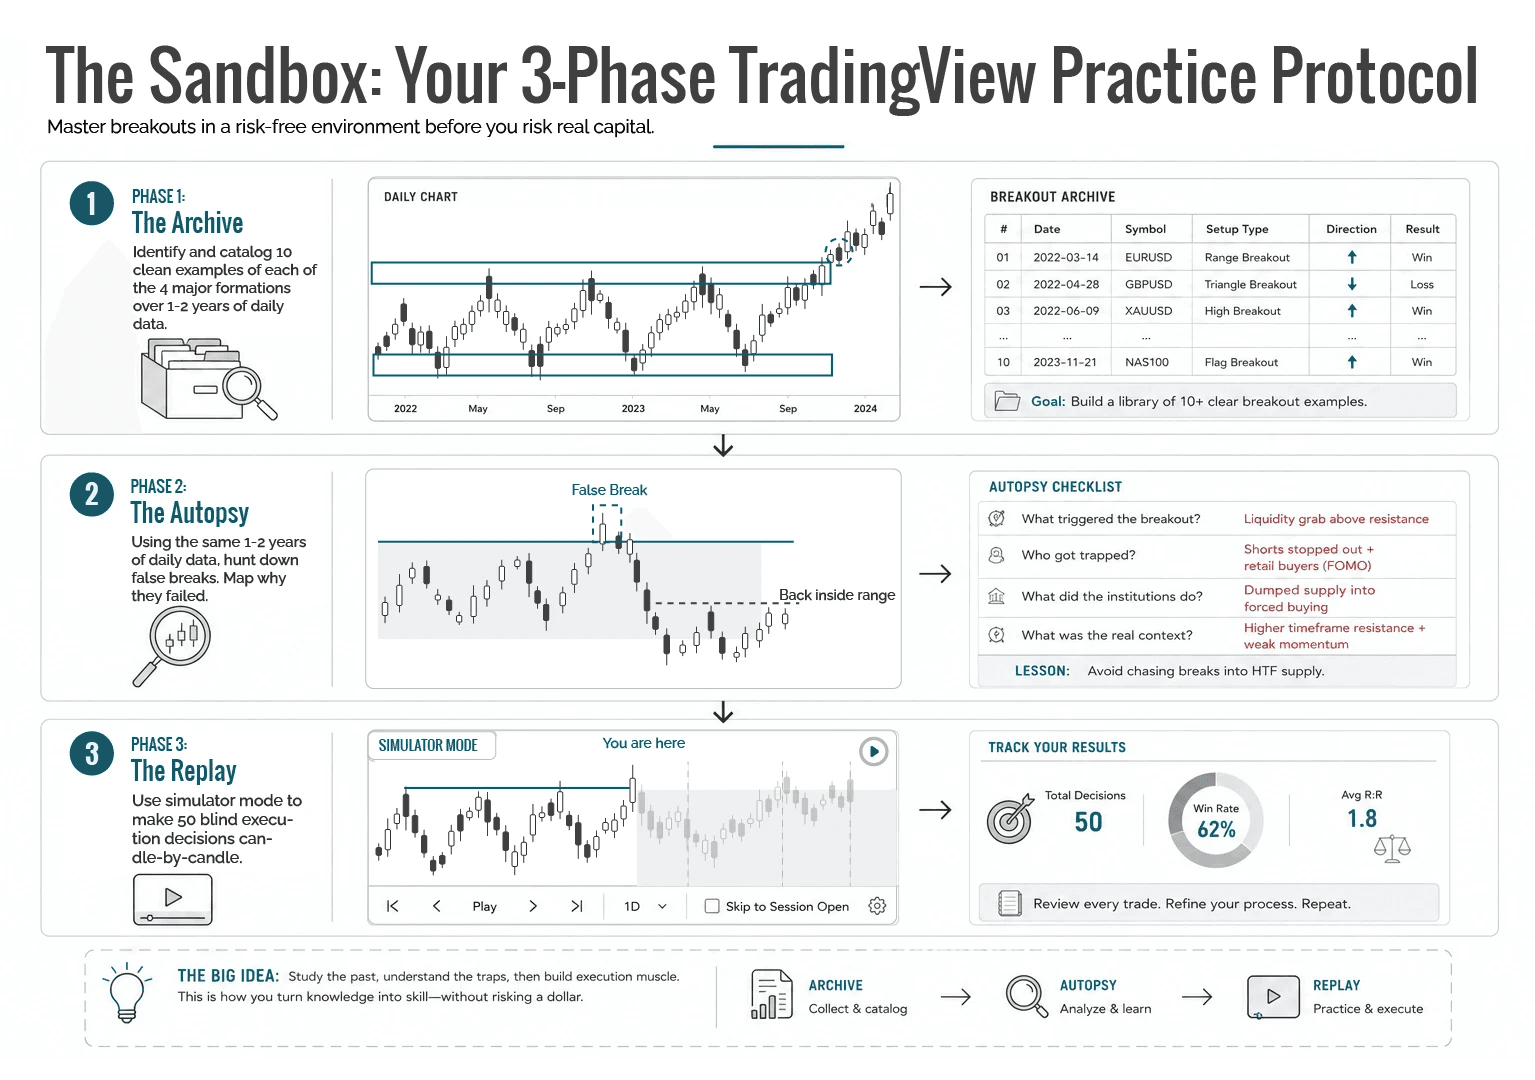
Phase 1: The Pattern Archive (2 Weeks)
Open a blank daily chart of a major pair like EUR/USD. Roll the data back 1 to 2 years. Your target should be to find 10 clean examples of each of the 5 major formations. Locate, draw, and screenshot every single triangle, flag, pennant, and rectangle you can find. Note the exact breakout point and catalog what happened next. You are building a visual baseline of how these structures look right before the spring uncoils.
Phase 2: The Autopsy of a False Break (1 Week)
Now, invert your focus. Go back through the exact same data and hunt exclusively for false breaks. Find 15 to 20 blatant false breaks. Analyze the exact mechanics of the failure (e.g., the closing print vs. the wick extreme). Look for the behavioral clues: Did the breakout candle close as a long, ugly wick? Was volume completely flat? Did the follow-through candle instantly reverse? Developing an eye for failures is a skill most traders only buy after losing thousands of real dollars.
Phase 3: The Replay Simulation (Ongoing)
Turn on TradingView’s replay mode, clear the chart forward, and advance candle-by-candle. When a consolidation zone appears, pause. Define your plan before the break happens: Am I entering aggressively on the break, or waiting for a retest? Where is my invalidation stop? Step the chart forward. Record your results. Do this until you have logged 50 simulated breakout decisions with absolute discipline.
Historical Blueprint: The Original Turtle Rules
For context, this is the exact core logic of System 1 used by the original Turtle Traders. It has been public knowledge for forty years:
The Long Entry: Buy when price hits a fresh 20-day high.
The Short Entry: Sell when price hits a fresh 20-day low.
The Long Exit: Close the trade if price drops to a 10-day low.
The Short Exit: Close the trade if price climbs to a 10-day high.
Risk Management: Position sizing was strictly restricted to risking 1% of total account equity per Average True Range (ATR) unit.
⚠️ Structural Warning: Do not copy and paste these exact rules into a modern retail account and expect to buy a tropical island. Markets have evolved dramatically since the 1980s. However, coding this basic framework into TradingView's Pine Script and running a historical backtest is an incredible masterclass in understanding win rates, brutal drawdown cycles, and regime dependency.
The Community Filter: Where the Adults Talk Shop
Most public trading forums are echo chambers of emotion and bad math. If you want to engage with serious practitioners, limit your navigation to these spaces:
r/algotrading (Reddit): An exceptionally strict, analytically rigorous community. You will not find memes here; you will find software engineers, data scientists, and systematic traders discussing backtesting protocols, false-break data modeling, and mathematical expectancy.
Futures.io: The premier community for serious retail futures traders. If you want to study the Opening Range Breakout (ORB) on equity indexes like the E-mini S&P (ES) or Nasdaq (NQ), this forum has decades of professional execution depth.
Trash Collection: What to Safely Hit "Delete" On
To keep your cognitive workspace clear, drag the following concepts straight to the trash bin:
Paid Breakout Masterclasses: Everything taught in a $1,500 course is pulled directly from John Murphy's textbook and the free sections of BabyPips. You are paying for their video lighting and editing suite, not proprietary insight.
"Guaranteed" Signal Channels: A breakout signal is just a line of code tracking a price boundary. Anyone with ten minutes of Pine Script experience can automate an alert. Paying a monthly subscription for someone to text you when price hits a 20-day high is an embarrassing waste of capital.
1-Minute Chart Breakouts: The social media crowd loves posting flashy 1-minute or 5-minute breakout charts because they happen constantly. What they don't show you is the abysmal false-break rate on micro-timeframes and how quickly broker spreads and execution slippage devour the tiny profit targets. Build your framework on the 4-Hour and Daily charts where structural data actually holds weight.
Success Criteria
After completing this lesson, you should be able to name and locate the recommended resources for breakout trading education and explain what each contributes that others don't.
Common Misconception
Any breakout trading content showing many successful setups accurately represents the approach.
The Truth: Published breakout content is systematically biased toward clean historical examples, which are rarer in live trading than most educational material suggests.
FAQ's
Q: Is The Complete Turtle Trader relevant for retail Forex traders?
Q: Are there TradingView scripts that identify breakout setups automatically?
Q: What's the single best free resource for learning breakout trading?
Table of Contents
About Me

Krista Weber
After a career as a VP of UX and EdTech executive, I retired early—and quickly realized the traditional world of trading education is fundamentally broken.
As someone with a Master’s in HCI who specialized in the design of e-learning systems, I saw a massive gap: beginners aren't failing because trading is impossible; they’re failing due to massive cognitive overload and terrible instructional design.
This site bridges that gap. I’m applying the principles of learning science, systems thinking, and minimalist UX to strip away the market noise and teach trading the way it actually should be taught.
Stay in Touch
Some of the pages on my travel blog contain affiliate links. Whenever you buy something through one of these links, I get a small commission at no extra cost to you. As an affiliate, I only recommend products and services that I feel are high quality and helpful to my readers. Thanks for your support.
Read More
Breakout trading is the practice of entering a position the moment price moves beyond a defined level of support or resistance. It sounds simple, and it is, in structure. The challenge is that most breakouts are false.
Updated on Jun 12, 2026

Why matching a strategy to your cognitive style matters more than finding the 'best' one.
Updated on Apr 27, 2026

Before exploring individual strategies, it's worth asking a more fundamental question: what actually counts as a trading strategy? The answer shapes everything.
Updated on Apr 27, 2026