Breakout Trading Part 2: How it Works
Breakout trading is the practice of entering a position the moment price moves beyond a defined level of support or resistance. It sounds simple, and it is, in structure. The challenge is that most breakouts are false.

Learning Path Stage 6: Find Your Strategy
Learning Level 2: Understanding
Primary Learning Objective
By the end of this lesson, you will be able to apply the mechanics of a breakout trading approach including entry timing, stop placement, and exit management.
(The Mechanical Jailbreak)
In Part 1, we looked at why breakouts are the darling of financial social media—they are photogenic, high-velocity, and packed with visual drama. But if Part 1 was the high-level marketing brochure, Part 2 is the architectural blueprint.
Strip away the emotional hype of watching a candle slice through a level. Underneath the hood, a breakout isn't an artistic event; it's a violent release of compressed physics and trapped capital. Let’s look at the actual order flow mechanics of a jailbreak, the four core setup environments, and how to structure your risk so a fakeout doesn't wreck your account.
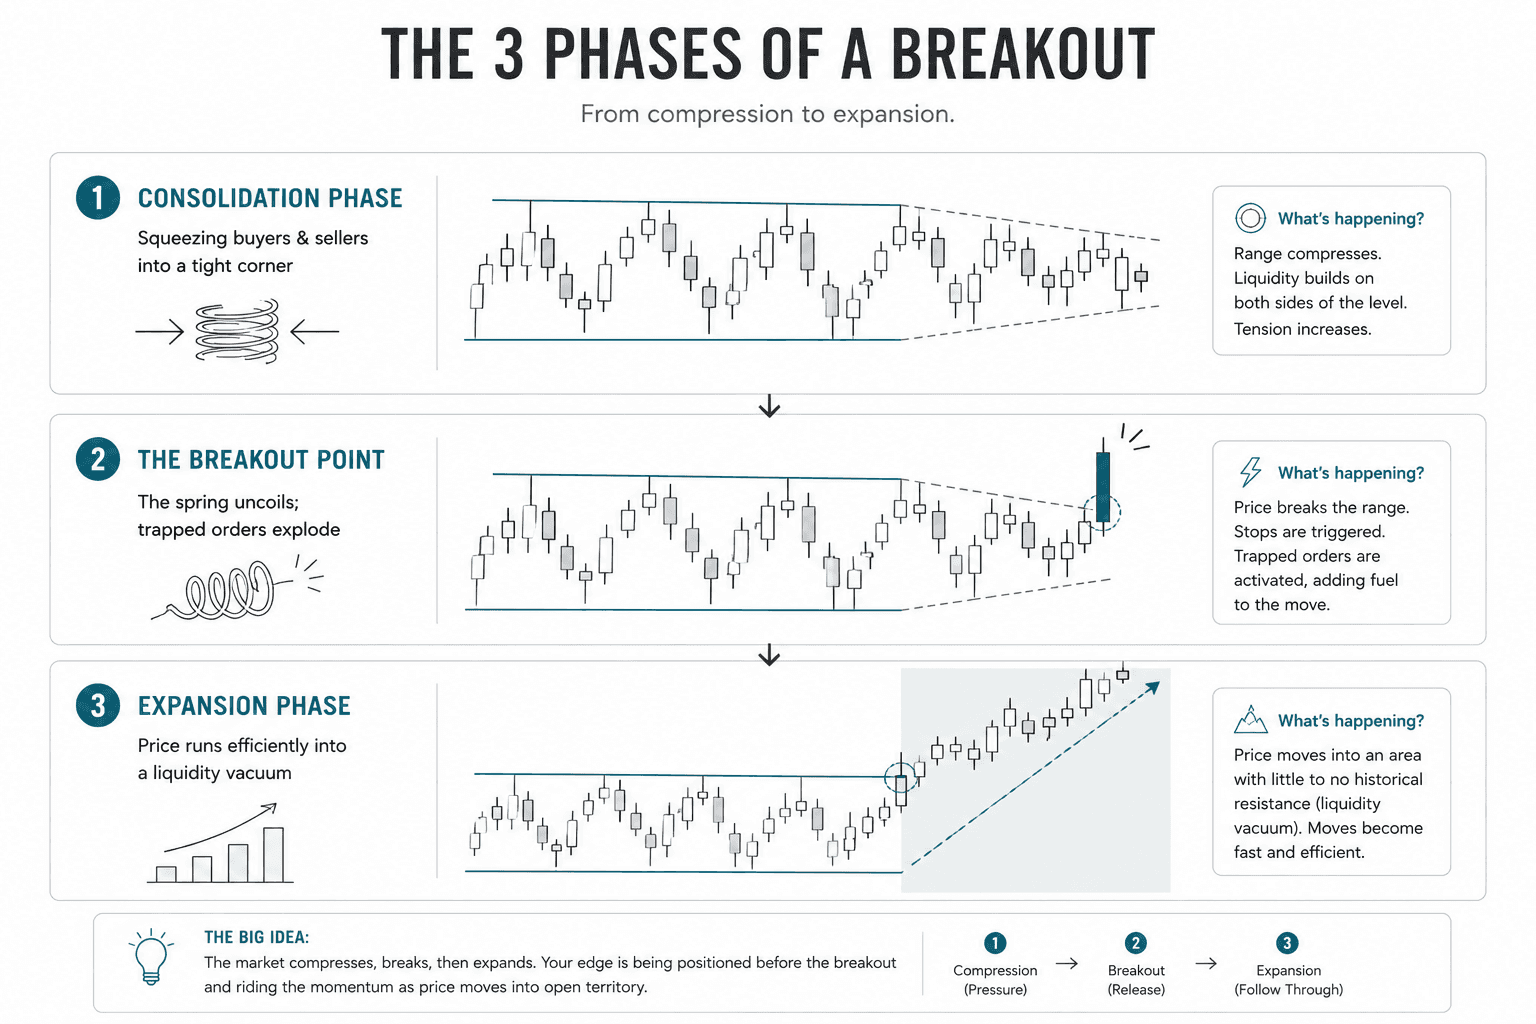
The Core Logic: The Compressed Spring
Breakout trading rests on a single observation: periods of consolidation store energy, and their resolutions release it. Think of price consolidation like a high-tensile steel spring being compressed between two blocks of wood. The longer and tighter you compress that spring, the more potential energy it hoards, and the more violently it explodes when your hand slips.
Why does this happen mechanically?
The Stand-Off: During consolidation, neither bulls nor bears have the capital or conviction to push price out of the yard. Both sides are frustrated, sitting on their hands, and accumulating positions.
The Explosive Traps: Short sellers place their protective buy-stops just above the ceiling. Breakout buyers place their conditional buy-stops right next to them. This creates a massive, volatile cluster of resting buy orders just outside the gates.
The Cascade: The moment price peeks past the boundary with enough institutional velocity, it hits those stop clusters like a match on gasoline. Short sellers are forced to buy to cover their losses; breakout traders are forced to buy to enter the market. This massive, automated cascade of buying pressure sucks in fresh momentum, creating a temporary liquidity vacuum that runs price efficiently to the next major level.
The Four Setup Environments
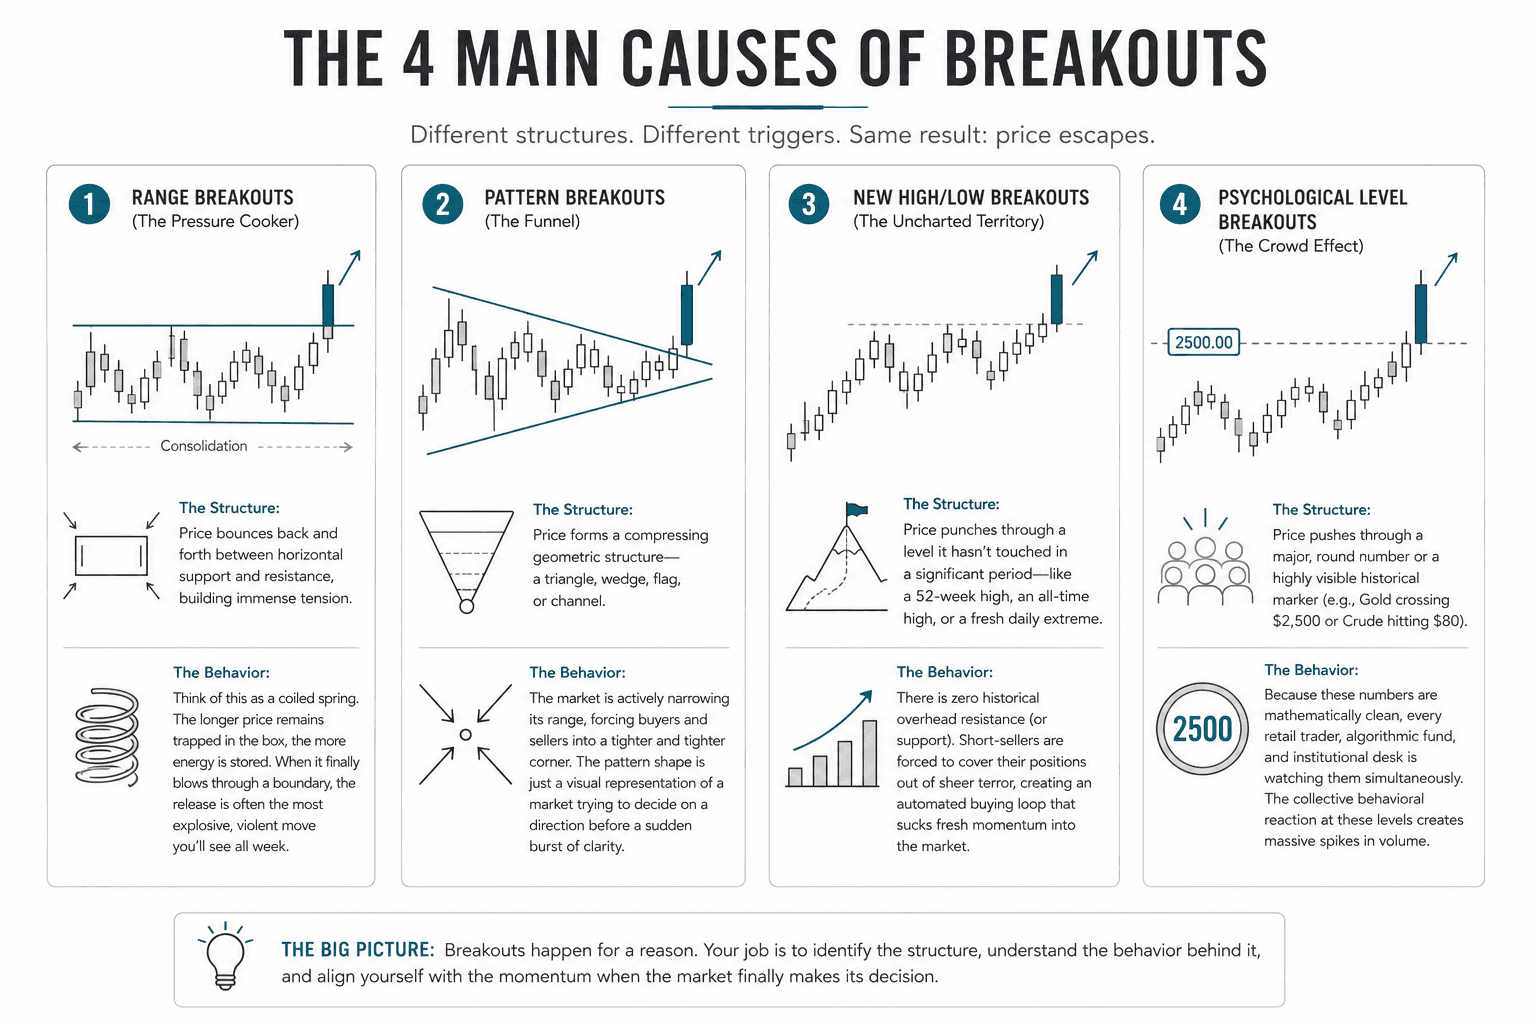
Just to review, and because this is important! We went through the four main causes of breakouts. You don't need to memorize a textbook library of sixty different chart shapes because in reality, breakouts happen in four primary structural configurations:
1. The Horizontal Range Breakout
The Layout: Price bounces cleanly between flat support and resistance lines.
The Execution: You wait for a candle to close convincingly outside the box. Your protective stop goes right back inside the broken level, because if price climbs back into the house, the escape has officially failed.
2. The Geometric Pattern Breakout
The Layout: Price compresses into recognizable shapes like triangles, flags, pennants, or head-and-shoulders necklines.
The Execution: These shapes are just visual representations of the market narrowing its range before a decision. Each pattern has a built-in "measured move" target (e.g., taking the height of the widest part of a triangle and projecting it from the breakout point).
3. The New High / New Low Breakout
The Layout: The purest, most clinical setup available. You buy when price hits a fresh $X$-period high, or short when it hits an $X$-period low.
The Execution: This is the foundation of the legendary 1980s Turtle System (which used 20-day and 55-day breakouts). Because it requires zero subjective line-drawing, it is highly systematic and can be backtested over decades of historical data with total clinical accuracy.
4. The Opening Range Breakout (ORB)
The Layout: You map out the high and low of the first 5, 15, or 30 minutes of a major market session (like the US New York equities open).
The Execution: A favorite of intraday futures and stock scalpers. If price punches above the opening range high, you go long; if it cracks below the low, you go short. It’s high-speed, fast-paced, and relies on the raw volume influx of the opening bell.
Entry Mechanics: Aggressive vs. Conservative
Once you spot a breakout happening in real-time, you face a classic user-interface dilemma: Do you want speed, or do you want confirmation? You cannot have both.
Entry Style | Execution Method | The Pros | The Cons |
The Aggressive Entry | Buy the exact millisecond price crosses the line. | Zero risk of missing the train; captures the maximum possible structural move. | High risk of getting caught in a stop hunt (fakeout). |
The Conservative Entry | Wait for the candle to close cleanly beyond the level, or wait for a retest of the broken line. | Maximum confirmation; lets you verify that old resistance is acting as new support. | The market will frequently explode and leave you at the station without ever offering a pullback. |
The Volume-Confirmed Entry | Only enter if the breakout candle shows a massive spike in volume. | Filters out low-liquidity, amateur moves. | Harder to read in OTC markets like Forex where centralized volume data doesn't exist. |
Setting Targets and Taking Your Profit
Textbooks will tell you that a pattern breakout always runs until it achieves its exact mathematical "measured move."
The market does not care about textbooks.
Many breakouts achieve 50-70% of their theoretical target before reversing into a violent pullback. To protect your mental capital and your account balance, avoid the "all-or-nothing" trap. Take partial profits at logical structural targets, and trail the remainder of your position behind major swing lows or moving averages. Let the market prove it wants to stop before you give back your hard-earned gains.
False breakouts are the defining challenge of breakout trading.
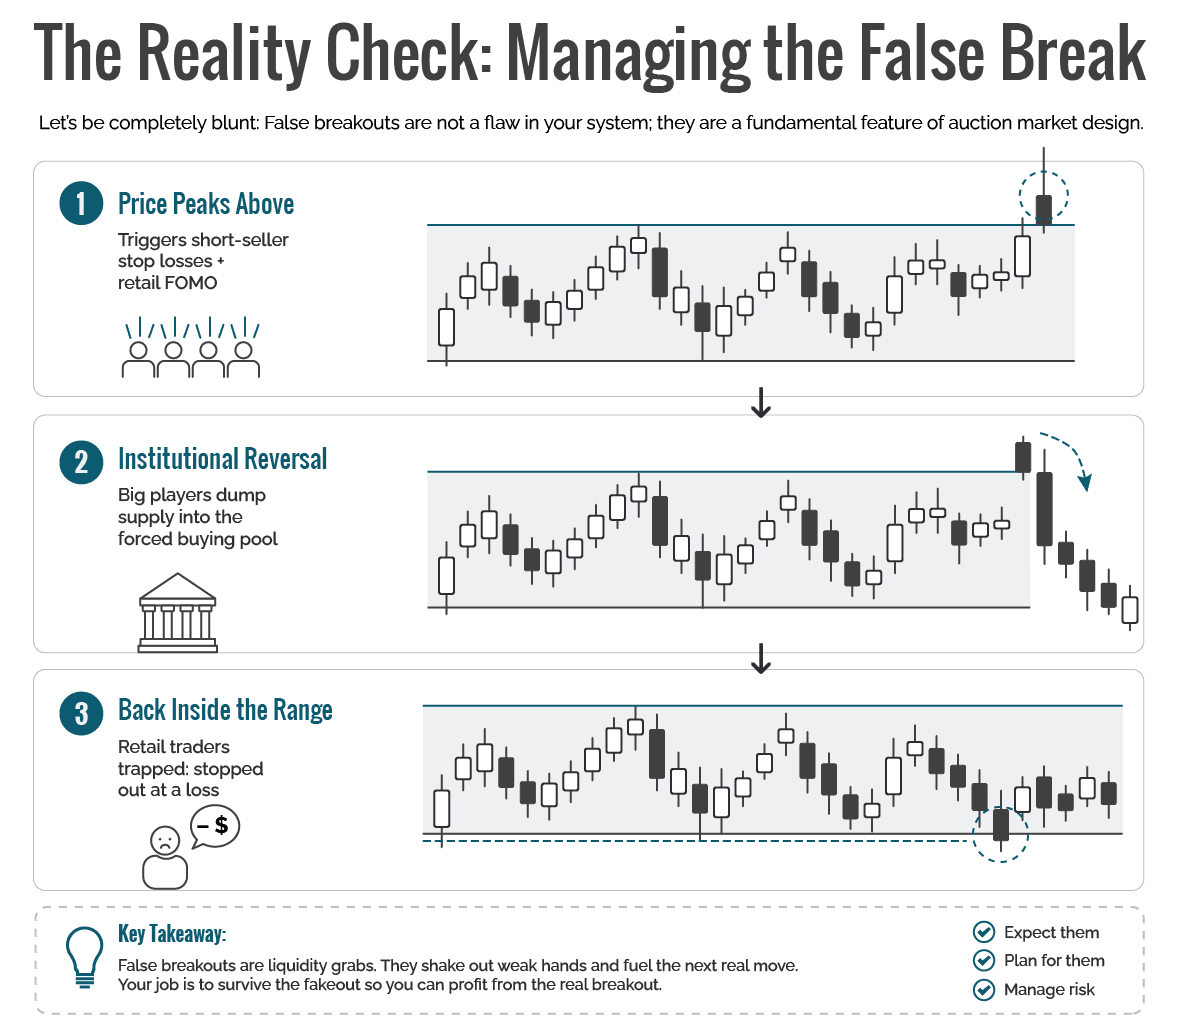
A system that captures 40% of genuine breakouts while getting stopped out on 60% false breaks can still be profitable, if the winning breakouts produce 3:1 or 4:1 R:R moves. The false breaks are the cost of being in position for the genuine moves.
Understanding false breaks as a statistical feature rather than a system failure is the psychological key to staying with the approach through its losing streaks.
Every breakout is a hypothesis: "price has enough momentum to continue." Your job is to test that hypothesis with defined risk, and to cut the test short when the evidence contradicts it.
Success Criteria
After completing this lesson, you should be able to describe the specific entry, stop, and exit rules for a defined breakout system and explain what each component is designed to accomplish.
Common Misconception
Bigger breakouts with more momentum are better trades.
The Truth: Price behavior after a breakout depends more on the structural quality of the consolidation before the break than on the size of the breakout candle itself.
FAQ's
Q: What makes a breakout "real" vs. a fakeout?
Q: Is breakout trading more related to range trading or trend following?
Q: Why do so many breakouts fail?
Table of Contents
About Me

Krista Weber
After a career as a VP of UX and EdTech executive, I retired early—and quickly realized the traditional world of trading education is fundamentally broken.
As someone with a Master’s in HCI who specialized in the design of e-learning systems, I saw a massive gap: beginners aren't failing because trading is impossible; they’re failing due to massive cognitive overload and terrible instructional design.
This site bridges that gap. I’m applying the principles of learning science, systems thinking, and minimalist UX to strip away the market noise and teach trading the way it actually should be taught.
Stay in Touch
Some of the pages on my travel blog contain affiliate links. Whenever you buy something through one of these links, I get a small commission at no extra cost to you. As an affiliate, I only recommend products and services that I feel are high quality and helpful to my readers. Thanks for your support.
Read More

Why matching a strategy to your cognitive style matters more than finding the 'best' one.
Updated on Apr 27, 2026

Before exploring individual strategies, it's worth asking a more fundamental question: what actually counts as a trading strategy? The answer shapes everything.
Updated on Apr 27, 2026

The internet delivers confident trading knowledge at industrial scale. Most of it is untested, some of it actively harmful. Developing the ability to evaluate what you're being taught, and what you think you've learned, is one of the most useful meta-skills in trading.
Updated on Jul 4, 2026