
How to Evaluate What You Think You Know About Trading
The internet delivers confident trading knowledge at industrial scale. Most of it is untested, some of it actively harmful. Developing the ability to evaluate what you're being taught, and what you think you've learned, is one of the most useful meta-skills in trading.

Learning Path Stage 1: Foundations
Learning Level 5: Evaluation
Primary Learning Objective
By the end of this lesson, you will be be able to critically evaluate trading claims by classifying the type of evidence they require, identifying common marketing manipulation techniques, and calibrating your confidence based on data rather than intuition.
Trading education suffers from a catastrophic, structural user-experience flaw: The information environment has absolutely zero quality control.
Almost anyone can rent a sleek website template, boot up OBS Studio, and claim divine market expertise with the supreme confidence of a cult leader. For a beginner, high-fidelity information and predatory mythology look identical. A professional landing page, a highly polished delivery, and a few cropped screenshots of six-figure payouts prove exactly one thing: the person knows how to market. They say nothing about a legitimate edge.
When the system infrastructure is entirely unregulated, your only viable defense mechanism is to build a ruthless, internal Quality Assurance (QA) pipeline. You have to learn how to grade every incoming claim before it touches your broker account.
1. The Four Categories of Trading Claims
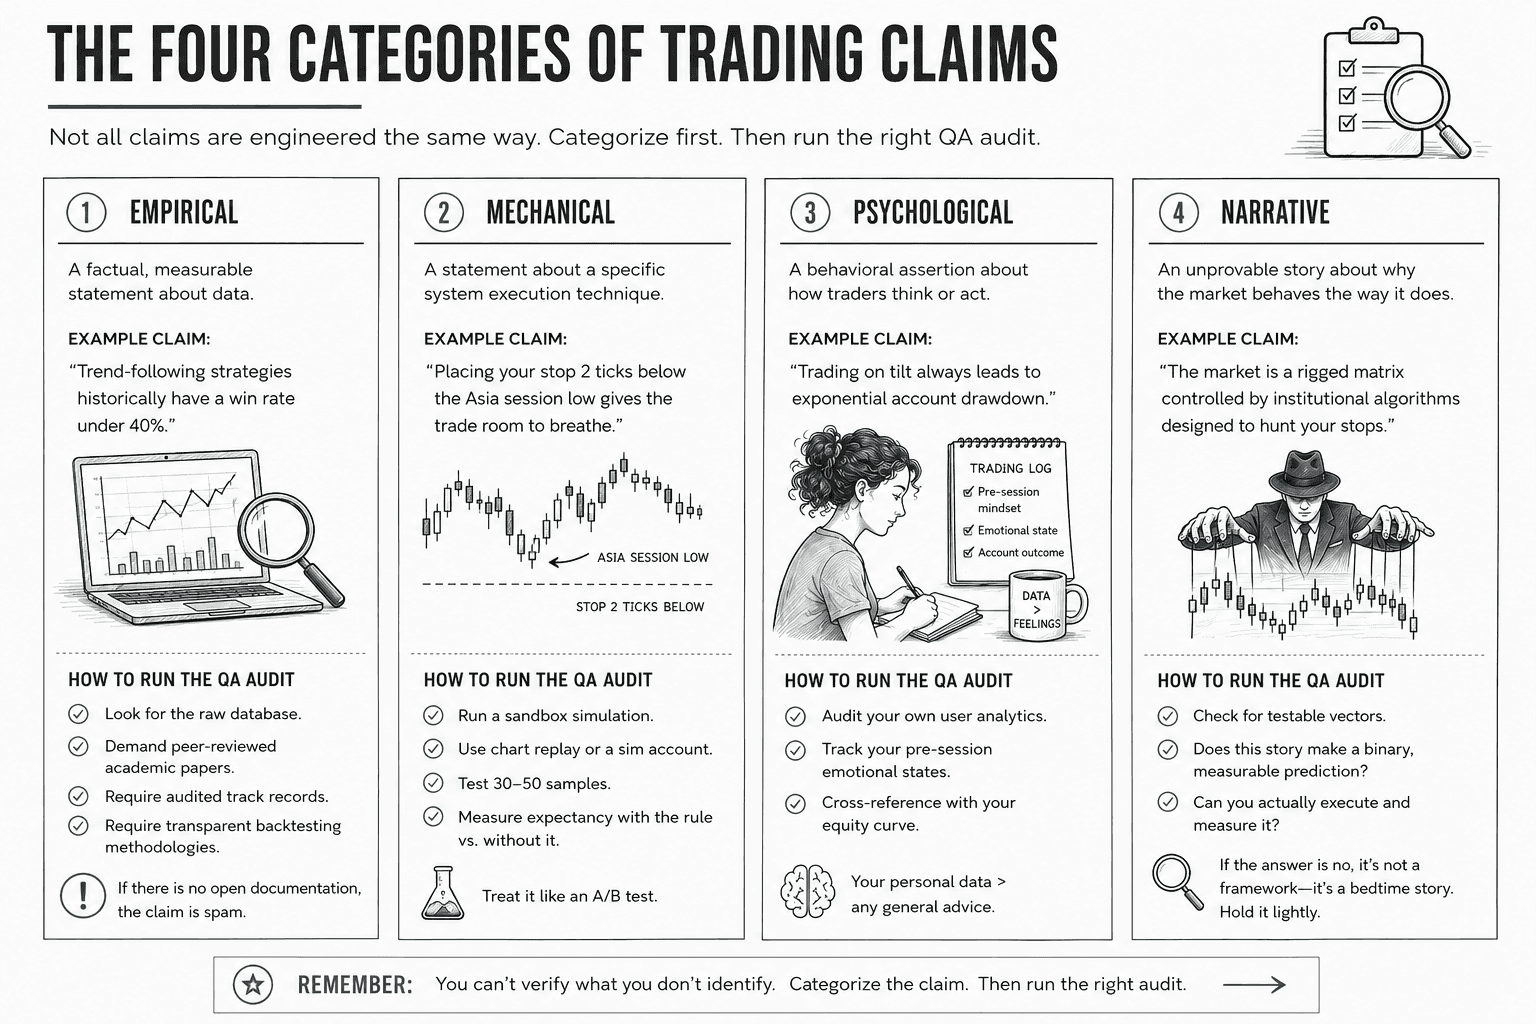
Not all claims are engineered the same way. To audit them efficiently, you must first categorize what kind of data script you are running:
Claim Category | The Core Assertion | How to Run the QA Audit |
Category 1: Empirical | A factual, measurable statement about data. e.g., "Trend-following strategies historically have a win rate under 40%." | Look for the raw database. Demand peer-reviewed academic papers, audited track records, or transparent backtesting methodologies. If there is no open documentation, the claim is spam. |
Category 2: Mechanical | A statement about a specific system execution technique. e.g., "Placing your stop 2 ticks below the Asia session low gives the trade room to breathe." | Run a sandbox simulation. Take the rule into chart replay or a sim account for 30 to 50 samples. Measure your expectancy with the rule versus without it. Treat it like an A/B test. |
Category 3: Psychological | A behavioral assertion. e.g., "Trading on tilt always leads to exponential account drawdown." | Audit your own user analytics. General behavioral advice is nice, but your personal trading log is the only data that matters. Track your pre-session emotional states and cross-reference them with your equity curve. |
Category 4: Narrative | An unprovable, explanatory story about why the universe exists. e.g., "The market is a rigged matrix controlled by institutional algorithms designed to hunt your stops." | Check for testable vectors. Does this grand story yield a binary, measurable prediction you can actually execute? If the answer is no, it's not a framework—it's just a bedtime story. Hold it lightly. |
2. Red Flags in the Educational Interface
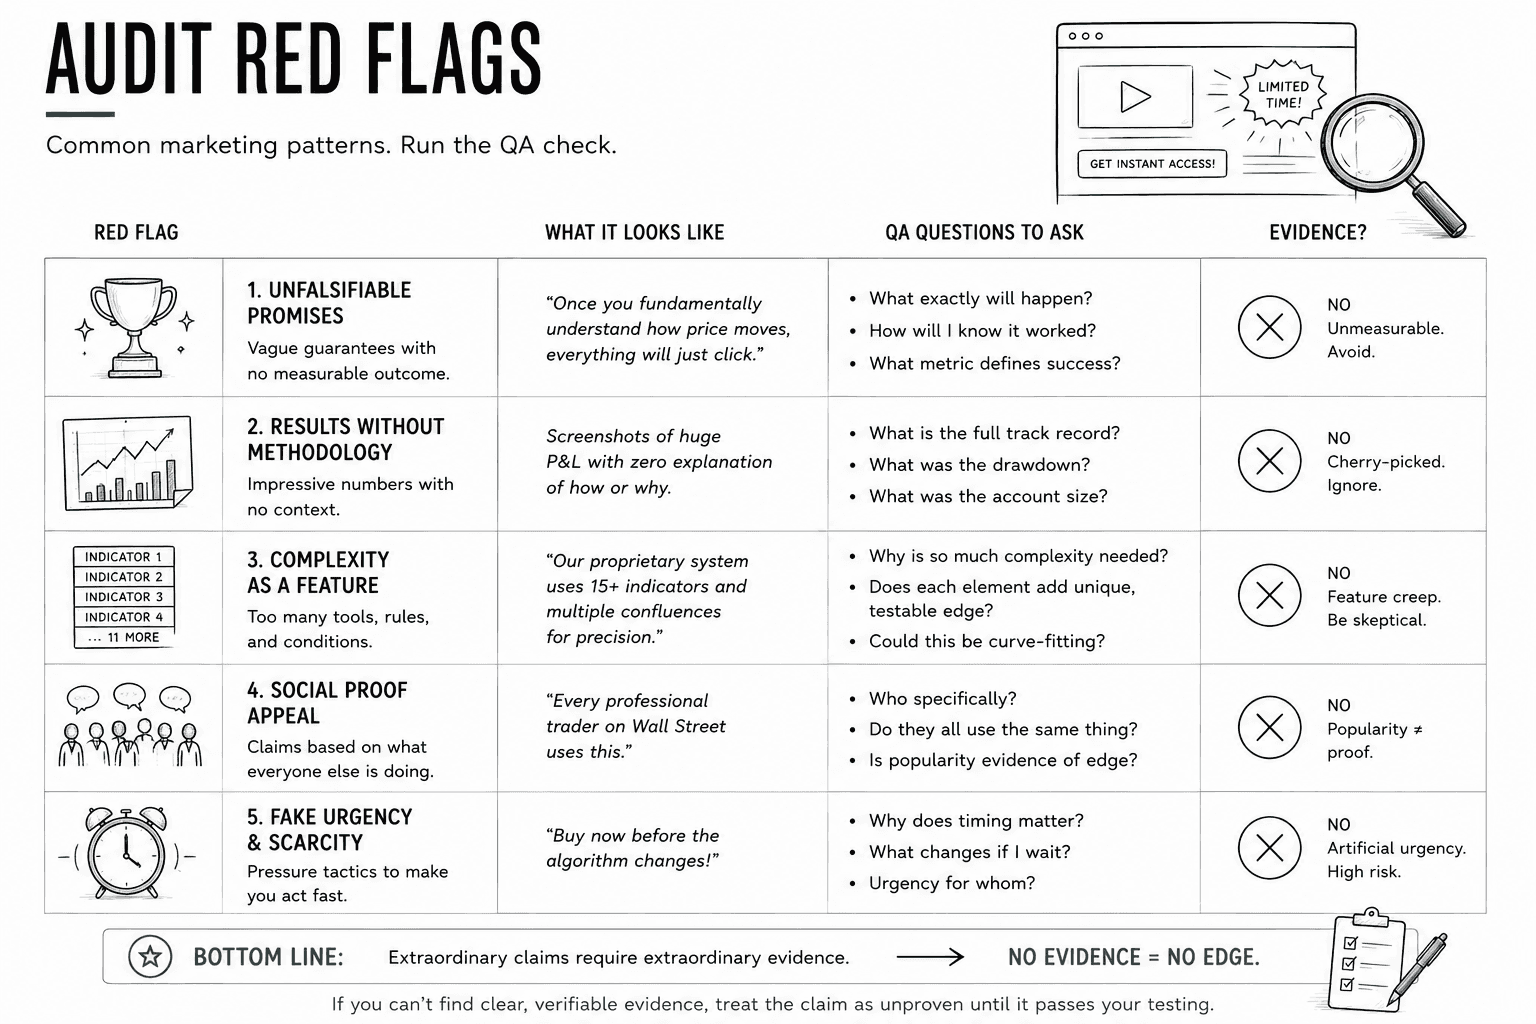
When you are scrolling through social media or shopping for trading tools, your browser should instantly flag these highly predictable marketing patterns:
The Unfalsifiable Promise: "Once you fundamentally understand how price moves, everything will just click." This is a massive logic trap. "Clicking" is a completely vague, unmeasurable emotional state. If you fail, the vendor can simply claim you haven't "clicked" yet, shifting the structural fault away from their broken system and onto your brain.
Results Without Methodology: Cropped screenshots of massive P&L metrics with zero environmental context. What was the total account size? What was the drawdown? Was this an isolated winning trade out of fifty catastrophic losses? A performance metric without a documented methodology is a useless, cherry-picked data point.
Complexity as a Feature: Systems that require 15 separate indicators, multiple overlapping confluences, and highly intricate geometric rules. If a strategy needs seventeen indicators, three lunar cycles, and your lucky coffee mug before it generates a signal, you're probably looking at feature creep rather than market insight. In software engineering, feature creep introduces bugs; in trading, extreme complexity is usually just a sign of historical curve-fitting.
The Social Proof Appeal: "Every single professional Wall Street trader uses this moving average." First of all, professionals use wildly conflicting, chaotic strategies. Second, consensus is not a mathematical argument.
False Urgency & Scarcity Sales Tactic: "Buy not before the algorithm changes! Take five and ask yourself, if anything will actually happen if you wait? Is the urgency really to save you from something, or is it urgency on their behalf to take your money?
3. Debugging Your Own Embedded Beliefs
The most painful part of system maintenance isn't auditing external gurus. The most painful part is auditing the deeply held beliefs already running inside your own subconscious operating system. These are the assumptions that feel true simply because they fit your recent memory.
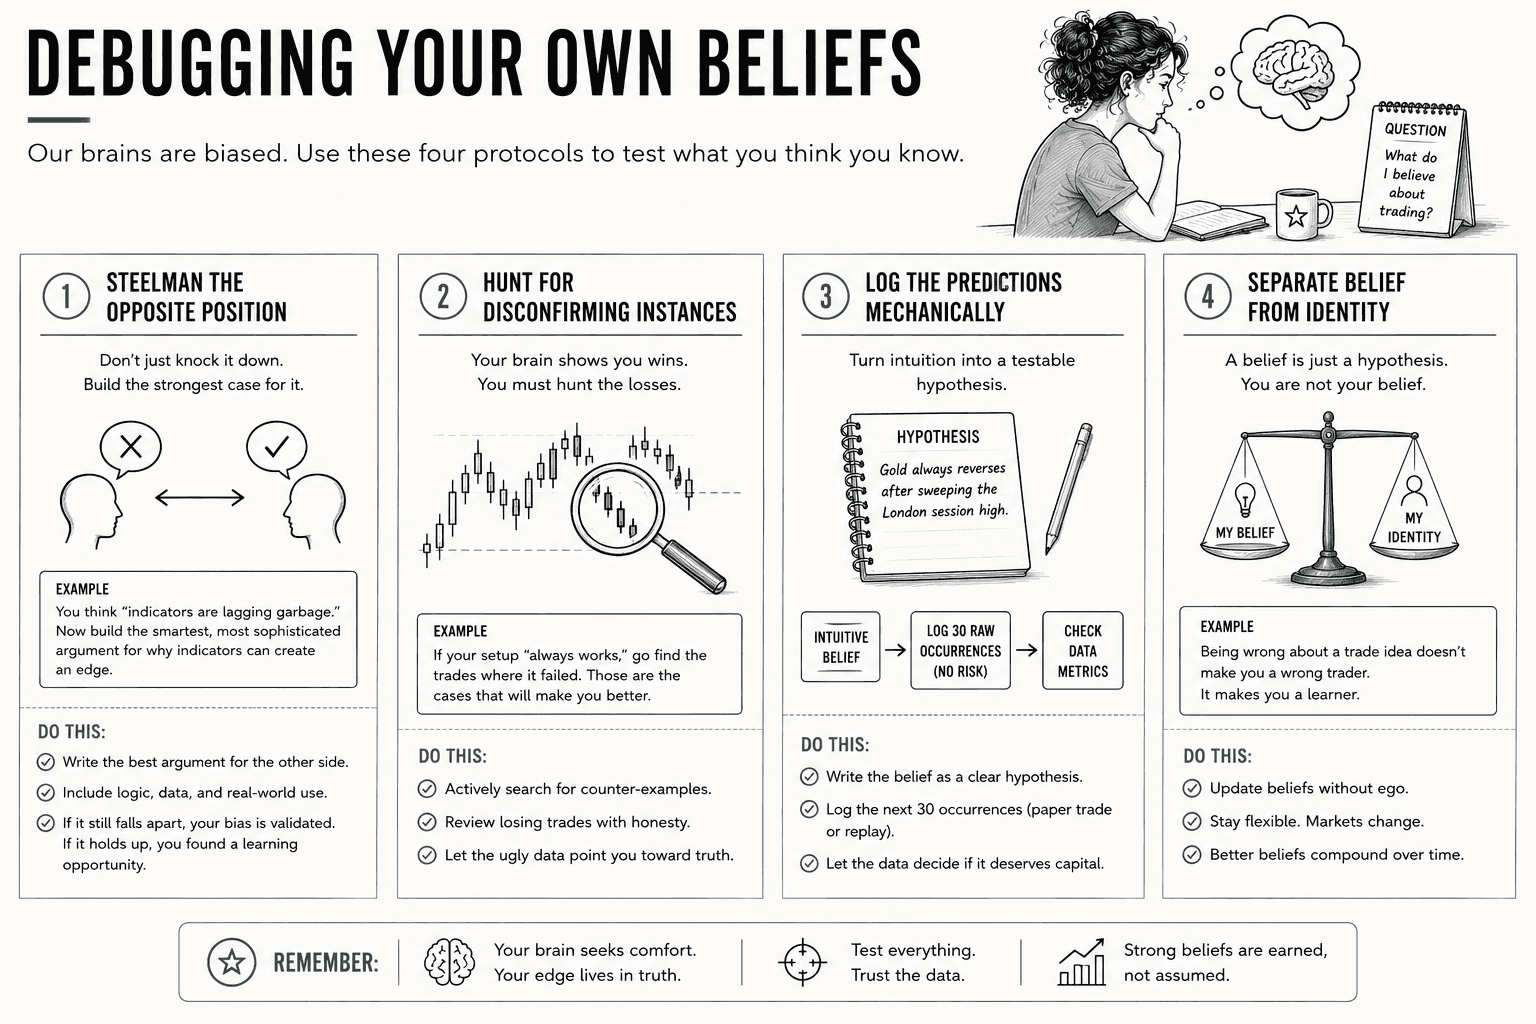
To pressure-test your own convictions, run these four mental debugging protocols:
Protocol 1: Steelman the Opposite Position
Before you completely dismiss an idea, like deciding that "indicators are pure lagging garbage", force your brain to construct the absolute strongest, most sophisticated argument for that exact tool. If the strongest possible case still falls apart under scrutiny, your bias is validated. If it's compelling, congratulations! You just uncovered a system update opportunity.
Protocol 2: Hunt for Disconfirming Instances
The human brain is a confirmation bias engine. If you believe your entry setup is highly reliable, your memory will naturally highlight the three times it caught a massive, clean breakout. You have to actively go into your charts and hunt for the ugly cases where your setup failed miserably. These bad reports are infinitely more valuable to your edge than your wins.
Protocol 3: Log the Predictions Mechanically
If you have a strong intuitive belief like, "Gold always reverses after sweeping the London session high," stop trading it immediately. Write it down as a strict hypothesis and log the next 30 occurrences without skin in the game. Let the cold, hard data decide if your intuition deserves capital allocation.
Protocol 4: Separate Belief From Identity
Belief tends to carry a heavier weight than is necessary in the trading world. Let's tone it down a bit and call it a hypothesis instead. Why? Because a hypothesis is often proven wrong, and when it is, it's not a failure, it's the scientific process working. You are going to be wrong sometimes in trading, that doesn't make you a bad trader. Everyone makes bad trades. The key is to learn from it.
4. The Goal: Perfect Calibration
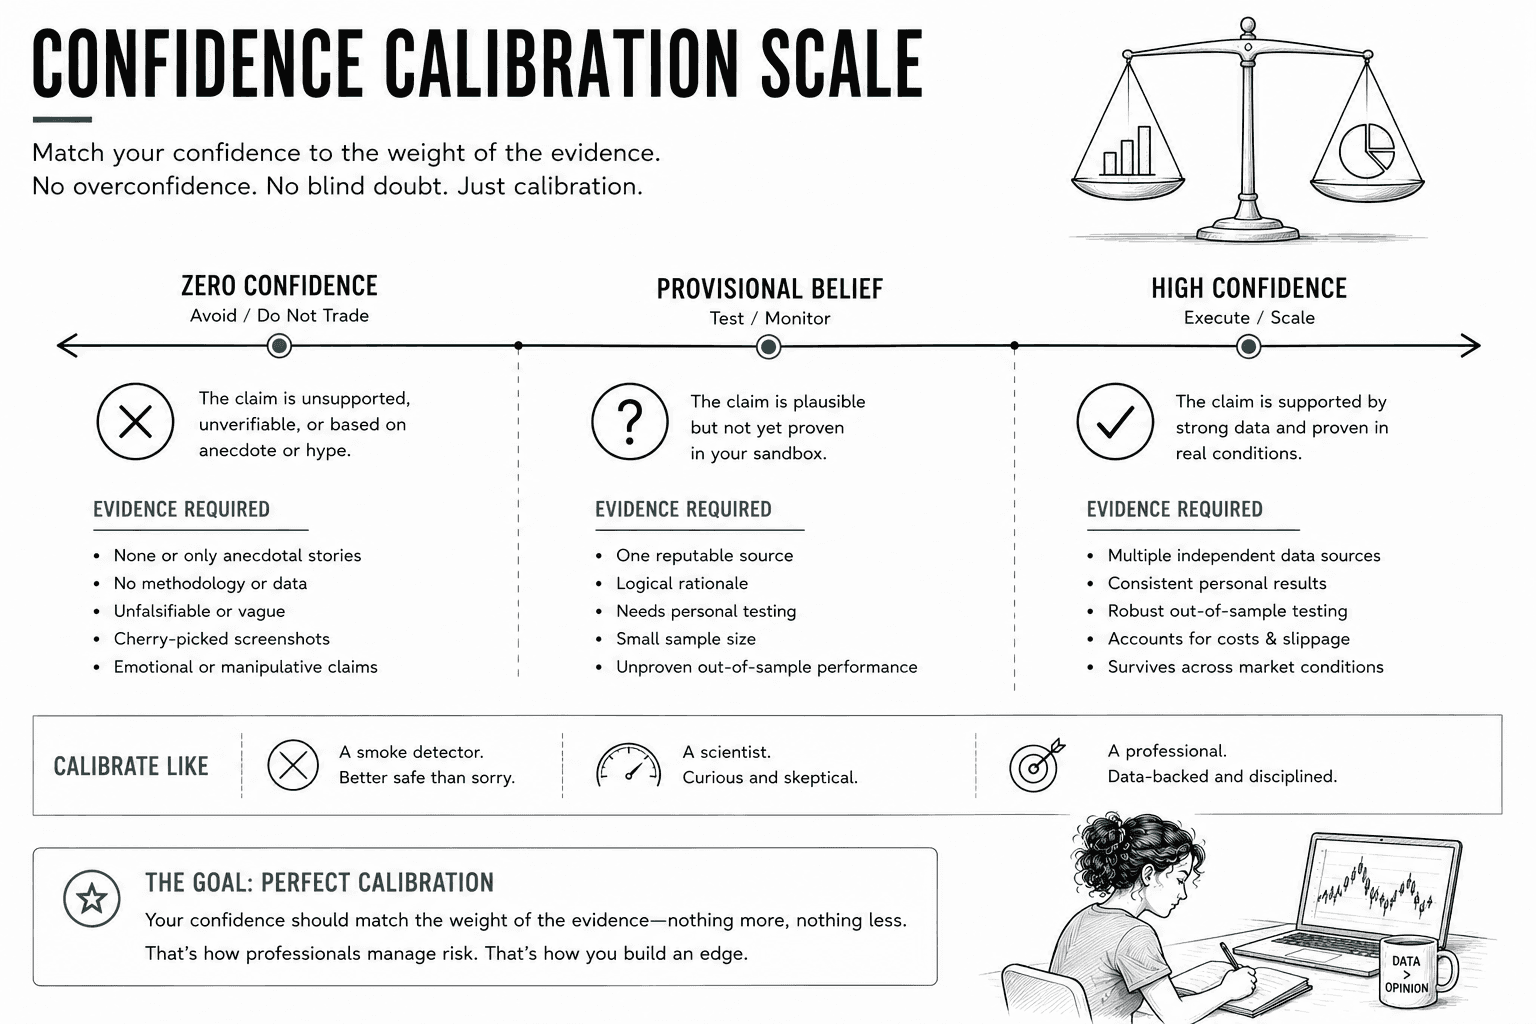
The ultimate objective of this QA process is calibration. Your level of confidence in any given trading strategy should strictly match the weight of the empirical evidence backing it up.
High Confidence
It's been verified by multiple independent data sources and your own consistent, rigorous personal testing.
Provisional Belief
There is at least a single reputable source that has verified it, plus it follows plausible logic, however you haven't tested it yourself.
Zero Confidence
All you have to go on is anecdotal stories, a lot of marketing hype like flashy screenshots and hoax-like retail claims.
A properly calibrated trader avoids toxic, binary certainty. They don't say, "Support and resistance always holds," or "Technical analysis is a total scam." Instead, they say:
"I execute this specific session-high sweep strategy with moderate confidence. My personal out-of-sample testing across 100 samples shows a 55% win rate with a 2:1 R-multiple reward structure, though I am closely monitoring the current expansion in volatility."
That is the language of a system developer. Calibration is the exact line of demarcation that separates professional risk managers who learn from sample distributions, from retail gamblers who simply accumulate highly confident, incredibly expensive wrong beliefs. The unverified assumption you never thought to question will always cost you significantly more than an obviously bad piece of advice.
Think about one trading belief you currently hold with complete confidence. Where did that belief come from? What evidence supports it? What evidence would convince you that it's wrong?
Success Criteria
After completing this lesson, you should be able to:
Break down any marketing claim into four types (Empirical, Mechanical, Psychological, or Narrative) and know exactly how to verify each one.
Spot at least three common manipulation tactics on any course landing page or social media ad: empty promises, cherry-picked stats, feature overload, and fake urgency.
Stress-test your own trading beliefs by finding real examples that prove you wrong, then building the strongest possible case for the opposite view.
Talk about your trades with honest confidence - sized to your actual data and real results, not gut-feel certainty.
Common Misconception
If an entry setup or trading tool makes logical sense, has a beautiful visual interface, and I've personally seen it work a few times, it is a validated edge.
The Truth: A trading edge isn't validated because it feels logical or looks convincing. It becomes credible only after surviving rigorous testing, accounting for real-world trading costs, and continuing to perform across unseen market conditions.
FAQ's
Q: Should I trust trading content from people who are profitable?
Q: What should I do when two credible sources disagree?
Q: How do I know if something I've learned about trading is actually true?
Table of Contents
About Me

Krista Weber
After a career as a VP of UX and EdTech executive, I retired early—and quickly realized the traditional world of trading education is fundamentally broken.
As someone with a Master’s in HCI who specialized in the design of e-learning systems, I saw a massive gap: beginners aren't failing because trading is impossible; they’re failing due to massive cognitive overload and terrible instructional design.
This site bridges that gap. I’m applying the principles of learning science, systems thinking, and minimalist UX to strip away the market noise and teach trading the way it actually should be taught.
Stay in Touch
Some of the pages on my travel blog contain affiliate links. Whenever you buy something through one of these links, I get a small commission at no extra cost to you. As an affiliate, I only recommend products and services that I feel are high quality and helpful to my readers. Thanks for your support.
Read More

Open almost any trading platform and you'll see EUR/USD sitting next to XAU/USD, NQ, ES, and a dozen CFDs on stocks you've heard of. They all show up as candlesticks moving left to right, which quietly implies they're all the same kind of thing. They aren't. Before going deeper into any one of them, it's worth drawing the map.
Updated on Sep 6, 2026

Futures are standardized contracts tied to defined specifications and a future settlement date. They can look complex at first, but the mechanics become much clearer once you know what the contract specification controls. Here's what you actually need to know.
Updated on Sep 6, 2026

CFDs appear everywhere in retail trading – but most new traders couldn't explain exactly what they are or why that matters. Here's a plain-language breakdown, including the parts that most introductions skip.
Updated on Sep 6, 2026