
Trend Following Part 2: How It Works. The Mechanics Behind the Strategy
Higher highs and higher lows sounds simple. The mechanics of actually trading it — entries, stops, trailing, and exits — are where the work lives.

Learning Path Stage 6: Find Your Strategy
Learning Level 2: Understanding
Primary Learning Objective
By the end of this lesson, you will be able to apply a basic trend following system including trend identification, entry, stop placement, and trailing exit.
The Core Logic: Why Trends Keep Happening
Markets spend more time trending than not—and trend following is the strategy built to exploit exactly that.
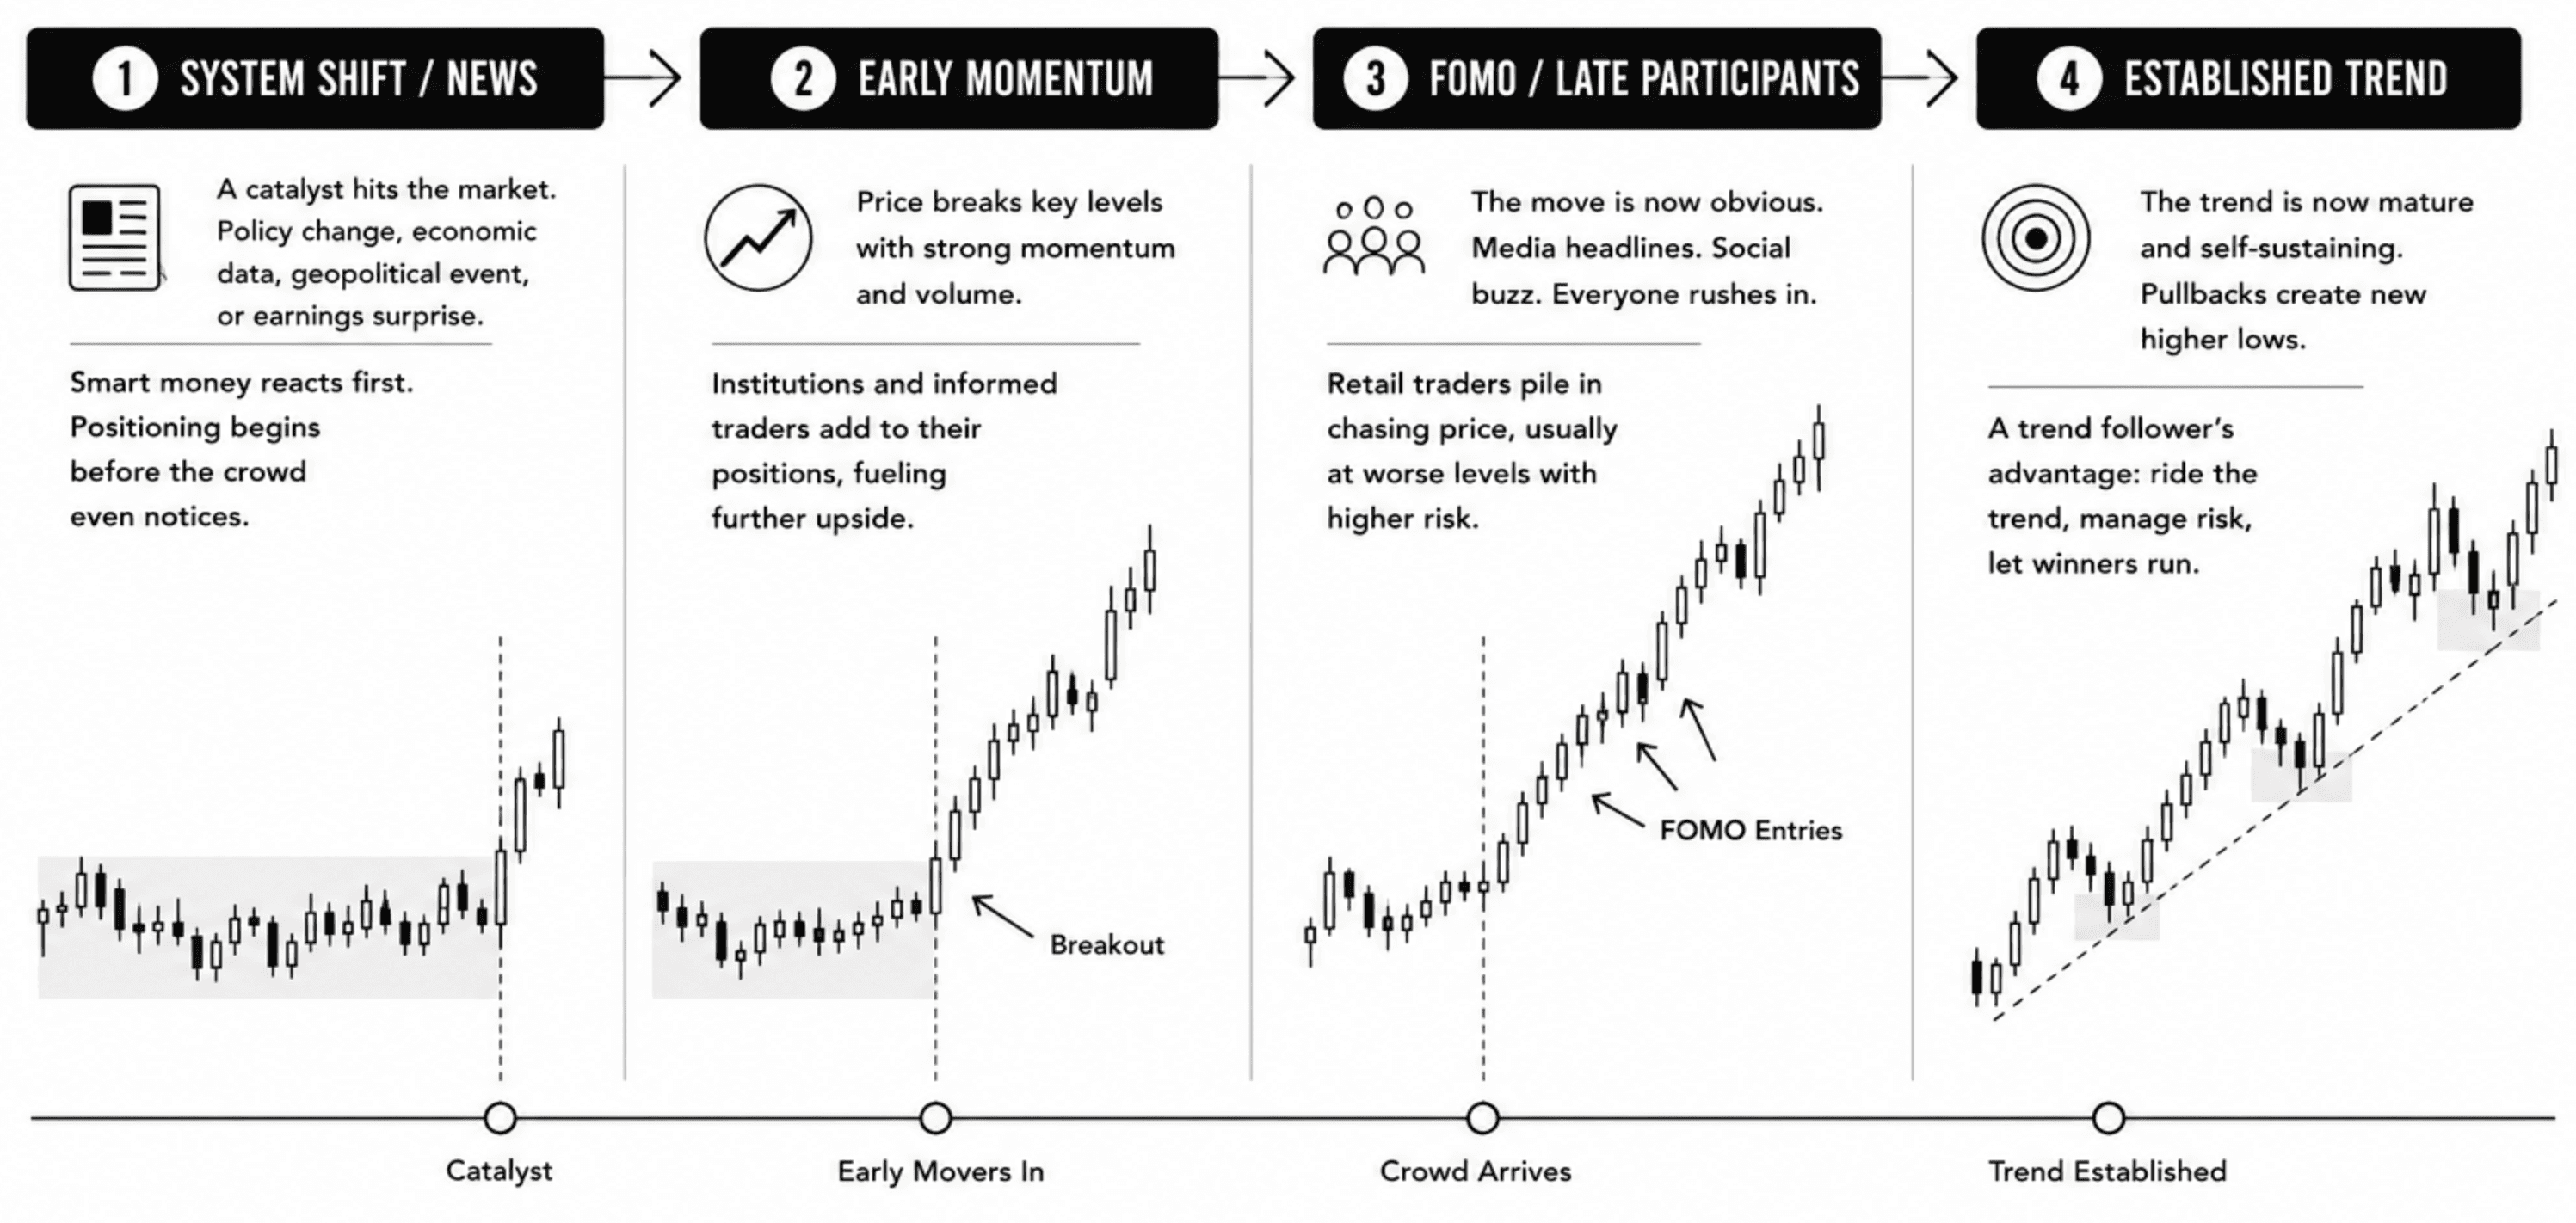
Prices move in extended runs because of deep-seated human psychology. When something meaningful shifts for a company, currency, or commodity, good news tends to cluster. Momentum builds. Late participants see the price moving, panic-buy so they don’t miss out, and add fresh fuel to the fire. Soon, compelling narratives form around why the move makes sense.
This behavior is well-documented in behavioral finance. It persists because of how our brains process information and make decisions under extreme uncertainty. We look at what the crowd is doing to validate our own choices.
As a trend follower, your user persona isn't "The Prophet." Your job description is simple:
Identify that a trend has begun.
Join it without overthinking.
Stay in until the data explicitly proves it's over.
You don't predict where trends start. You execute a clear, binary rule: "When signal X occurs, I buy." Prediction requires being right about an imaginary future. Execution just requires consistency over time.
💡 The hard part? Holding through the user interface of a messy chart. Trends don't move in clean, straight lines. A position that is up significantly will pull back and erase some of your gains before continuing higher. Watching your unrealized profit shrink while you sit on your hands takes immense conviction. That conviction cannot come from guessing; it has to come from trusting the mathematical engine across a massive sample size of trades.
Entry Methods: Breakouts vs. Pullbacks
When it comes to getting into a trend, entries generally fall into two design patterns:
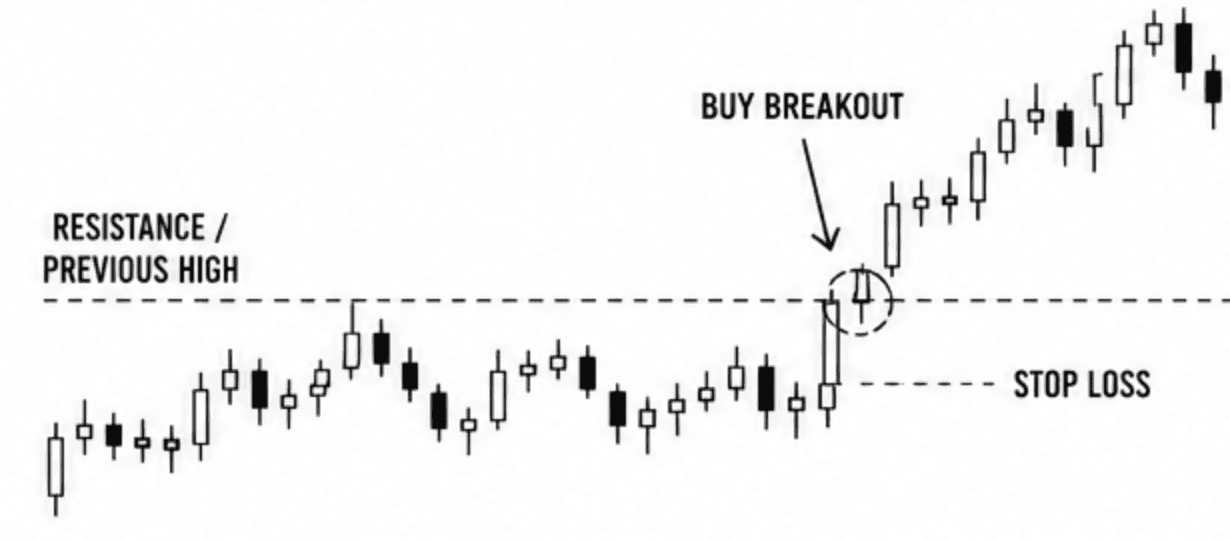
1. Breakout Entries
You buy the moment price breaks above a major psychological boundary, like resistance or a previous high. Your stop loss sits just below that broken level.
The Benefit: You catch fast, explosive moves early.
The Trade-off (The "Whipsaw"): Price breaks out, triggers your entry, immediately reverses to hit your stop, and drops back into the range. These false breakouts are a normal, unavoidable cost of running a breakout system.
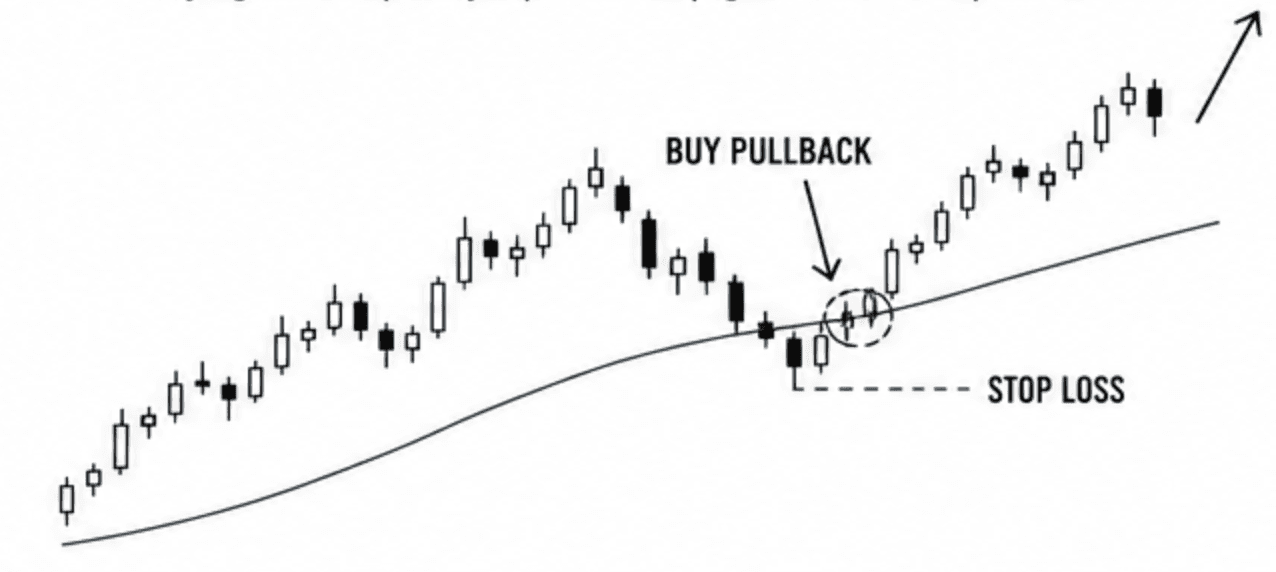
2. Pullback Entries
You wait for price to retrace toward a moving average or support level within an established trend, buying the temporary dip. Your stop goes below the pullback low.
The Benefit: You get a much better average price and a tighter stop.
The Trade-off: Buying into a falling price within an uptrend feels entirely wrong to our survival instincts. It triggers cognitive friction for beginners, even when the structural context is completely sound. Plus, if the market is moving fast, you risk missing the train entirely if it never pulls back.\
Entry Type | Core Advantage | Psychological Friction Point |
Breakout | Catches fast moves instantly; easy to automate. | High frequency of false breakouts (whipsaws). |
Pullback | Better risk-to-reward ratio; tighter stops. | Feels like catching a falling knife; risk of missing the move. |
Systematic and algorithmic funds love breakouts because they are incredibly easy to define precisely in code. Pullbacks tend to suit discretionary retail traders because they offer more favorable risk-to-reward ratios. Ultimately, the entry method you choose matters far less than your ability to apply it consistently without shifting goals mid-trade.
Stop Management: Designing Your Exit
If entries get all the glamorous marketing, the stop loss is the actual mechanical framework that keeps you alive. In trend following, you have two primary options:
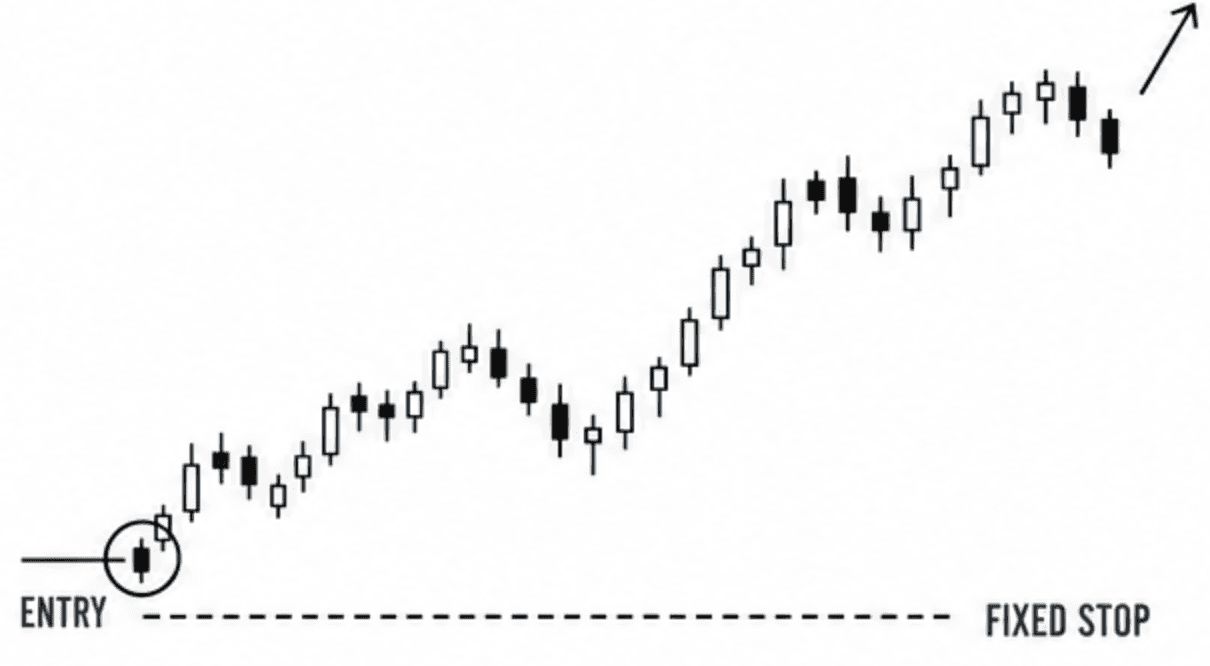
Fixed Stop: Placed a set distance from your entry—whether that's a specific Average True Range (ATR) multiple, a dollar amount, or a fixed percentage. It’s simple, consistent, and cleanly caps your maximum risk relative to your account balance.
Trailing Stop: This is a dynamic mechanism that moves in your favor as the trade prints profit. You can trail it below the most recent swing low, an exponential moving average (like the 20 or 50 EMA), or a fixed ATR multiple dropped from the highest peak.
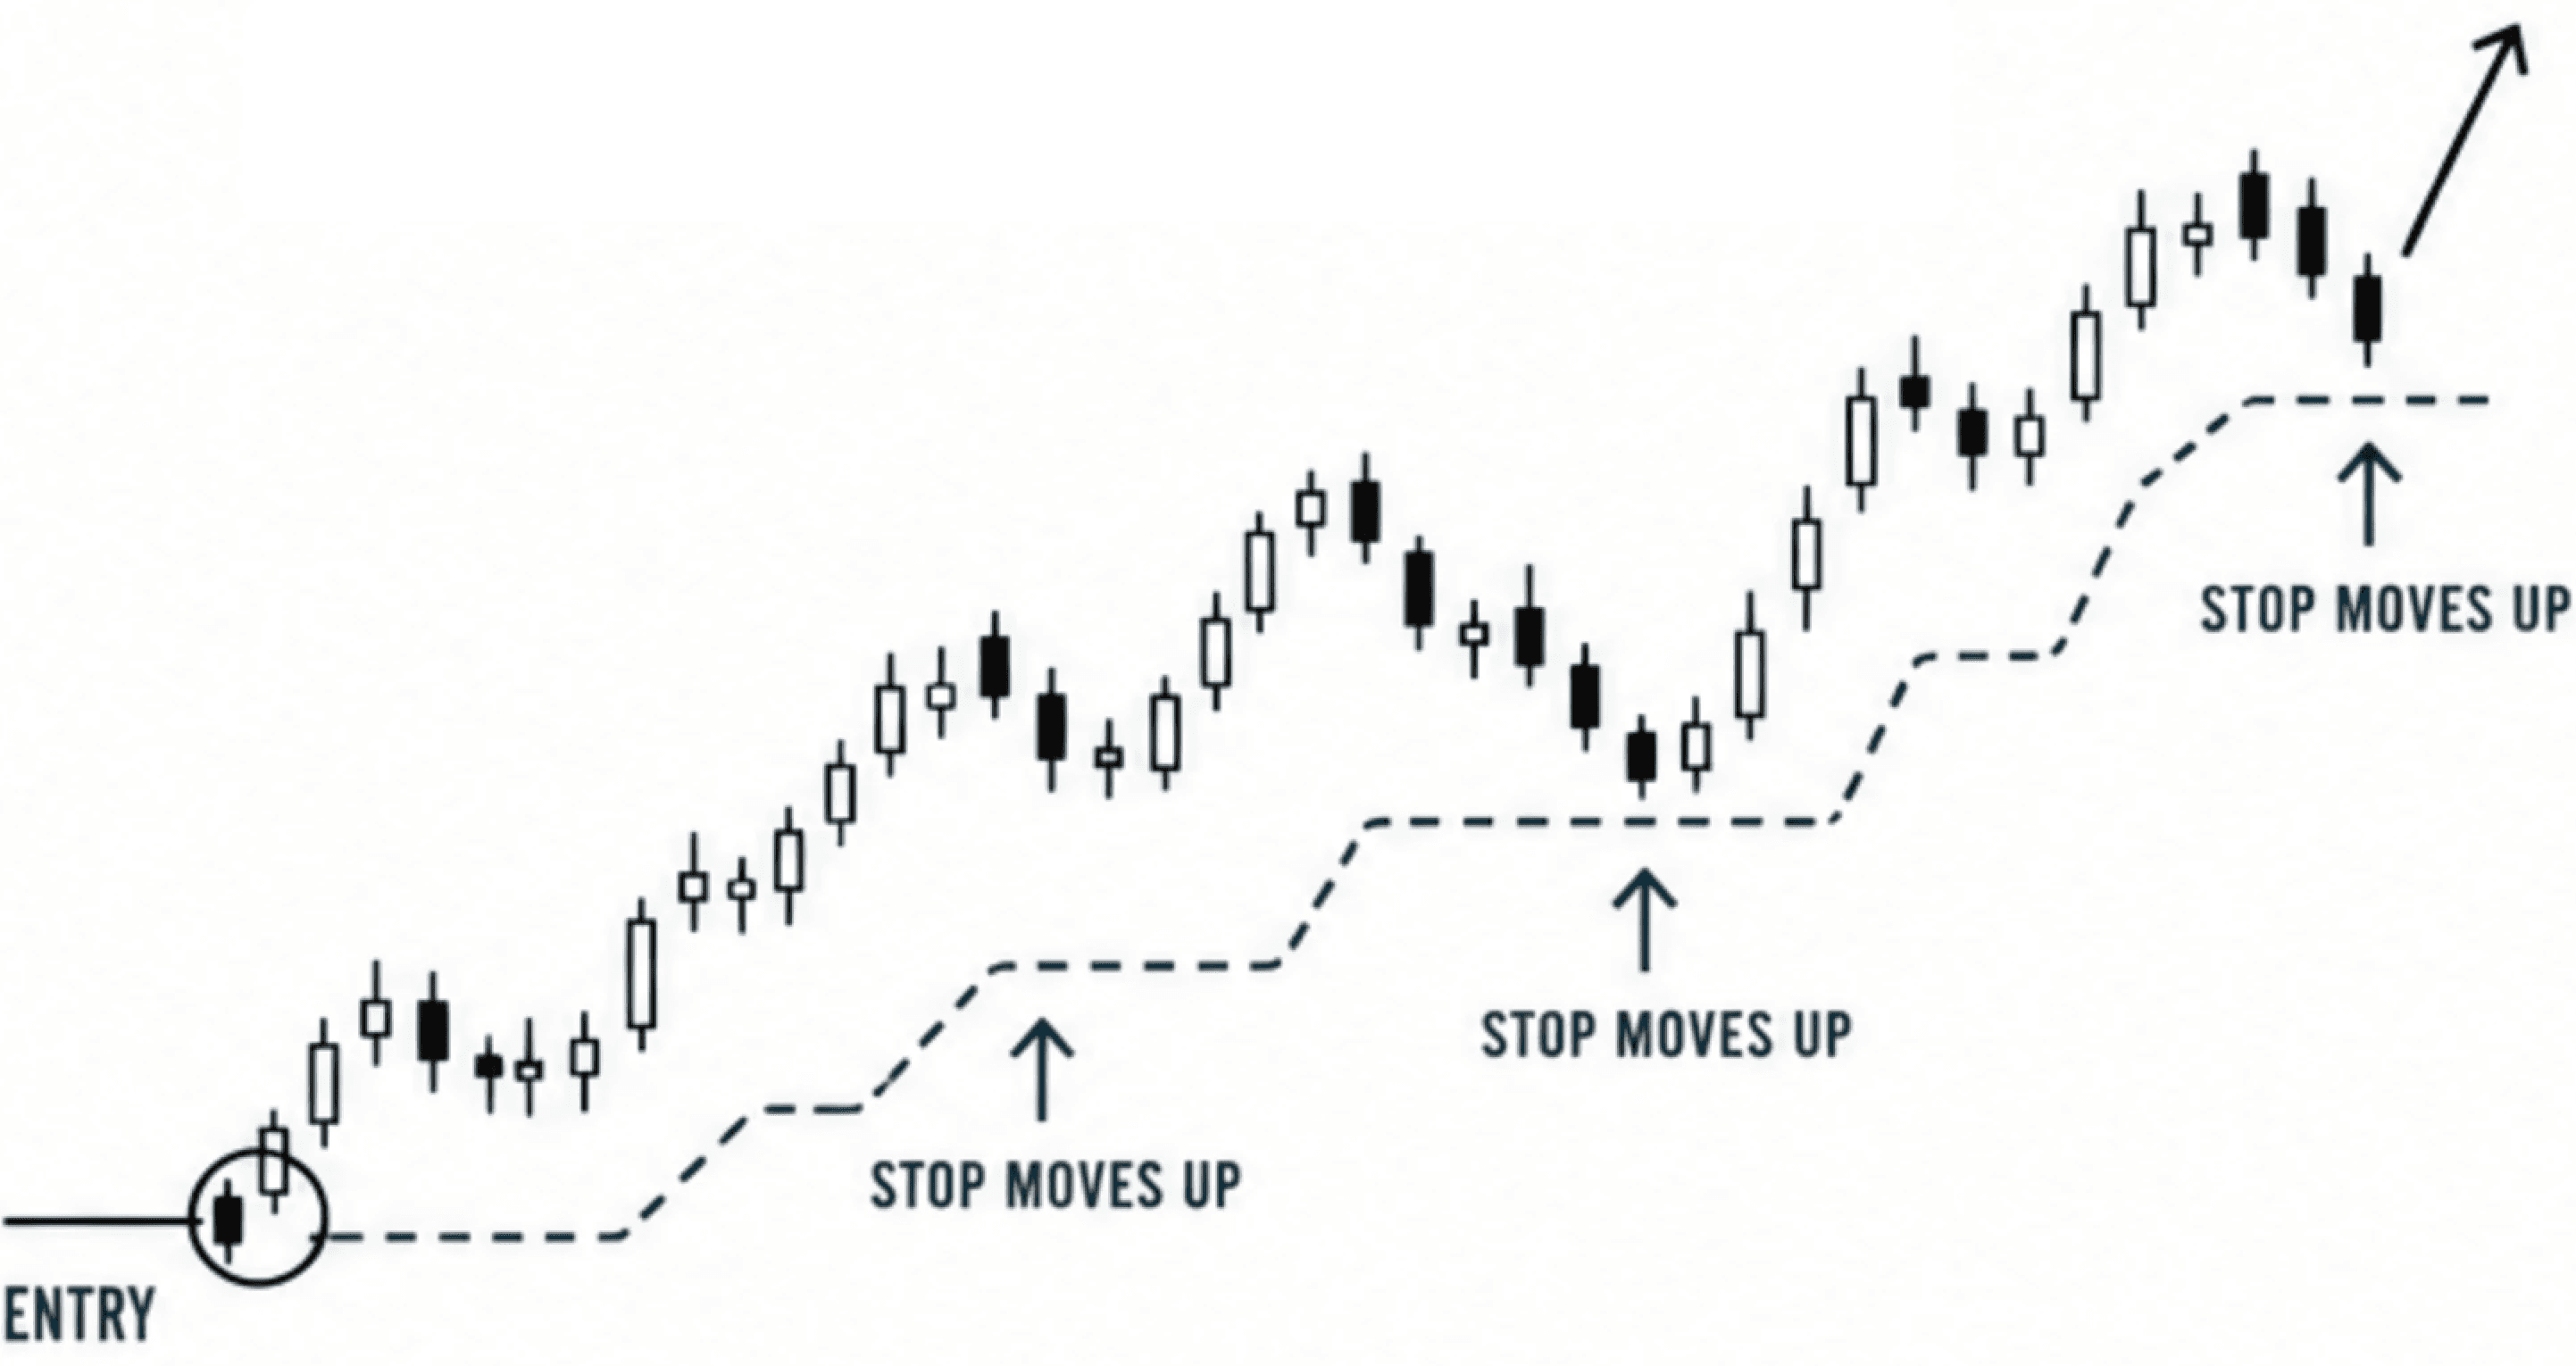
The trailing stop solves the ultimate psychological boss battle in trading: knowing when to exit a winner. Instead of turning your exit into an exhausting judgment call about whether the trend is "still good," the trailing stop gives you an objective, data-driven signal. When the price breaches the line, the position closes. No deliberation, no bargaining, no existential dread.
Most experienced trend followers heavily favor trailing stops over fixed profit targets. A fixed target might happily click you out of a trade at a $3:1$ reward-to-risk ratio ($3R$), right before the trend explodes into an $8R$ monster. A trailing stop forces you to stay in the game until the trend actually expires. That massive difference in average winning trade size is what mathematically drives your edge.
Position Sizing: Calibrating the Mathematical Engine
Trend following accepts a low win rate by design. Because you will often be wrong, your position sizing carries all the weight. The math is designed to work beautifully over a 100-trade sample size, not on any single random Tuesday.
The standard layout is to risk a fixed percentage of current account equity per trade—typically between 0.5% and 2%.
For example, if you are risking 1% of a $10,000 account ($100) on a trade with a stop loss spaced 50 pips away, your position size is strictly limited to the exact number of units that will lose exactly $100 if that stop gets hit.
This discipline creates your positive expectancy engine:
Losses stay strictly boxed in because your position size automatically shrinks when your stop distance widens.
Winners are allowed to scale exponentially because they are unconstrained by artificial profit targets.
The absolute moment you start risking more money on "high confidence" setups, or revenge-trading smaller sizes because you're on a losing streak, you break the system's logic. The math only works if the rules remain uniform.
Why Your Brain's Default Wiring Works Against You
Even traders who fully understand this math intellectually usually blow themselves up in practice. Let's look at the exact cognitive bugs built into human hardware that conflict with this strategy:
A low win rate triggers a "failure" alert: Losing 65% of your trades—even when your few winners completely eclipse those losses—feels deeply demoralizing to a human brain wired for constant validation. It triggers the immediate impulse to tweak the system.
Drawdowns feel permanent: Our brains are notoriously bad at telling the difference between "this is a standard statistical drawdown in a functioning system" and "the sky is falling and this system is broken forever." In the heat of the moment, both charts look identical.
Holding winners triggers loss aversion: When a trade is up 40%, your brain screams at you to smash the "Take Profit" button to lock in the gains and feel secure. The correct, system-valid action is to sit on your hands until the trailing stop forces you out. This directly violates our survival instinct to protect gathered resources.
Exit discipline is incredibly fragile: Entry rules get 90% of the attention in forums and books. But exit discipline—specifically refusing to exit early when uncertainty spikes—is where traders quietly bleed away their edge, one emotional override at a time.
The Historical Track Record
Despite the psychological friction, systematic trend following has one of the most robust, long-term asset-class track records in modern history.
In the 1980s, the famous Turtle Traders experiment proved that a mechanical trend-following system could be taught to absolute beginners and run profitably. Decades later, major Commodity Trading Advisors (CTAs) and trend-following hedge funds consistently serve as standard diversifiers during market crises. When equity markets crash, it creates exactly the kind of massive, sustained directional macro-movements that this strategy relies on to feast.
Historical performance doesn't mean market dynamics never change. Execution technology accelerates, and algorithms dominate the micro-levels.
But the underlying behavioral flaws that generate trends in the first place—human FOMO, herd behavior, institutional order-lag, and our obsession with narrative storytelling—evolve at a snail's pace. That is why trend following has successfully survived the leap from telegraph tapes to high-frequency algorithmic servers.
The Bottom Line
You will be wrong most of the time. But you will be incredibly right when you are right, and your losses will stay remarkably small when you are wrong.
Accepting that reality isn't just a trading strategy—it’s the entire edge.
Success Criteria
After completing this lesson, you should be able to describe the mechanical rules of a simple moving average trend following system and explain what each component does and why.
Common Misconception
The entry signal is the most important part of a trend following system.
The Truth: The trailing stop mechanism and position sizing determine most of the system's mathematical characteristics; entry timing has relatively less impact on overall performance.
FAQ's
Q: How do you know when a trend is "real" versus a false breakout?
Q: What markets are best suited to trend following?
Q: What's the difference between trend following and just "buying in an uptrend"?
Table of Contents
About Me

Krista Weber
After a career as a VP of UX and EdTech executive, I retired early—and quickly realized the traditional world of trading education is fundamentally broken.
As someone with a Master’s in HCI who specialized in the design of e-learning systems, I saw a massive gap: beginners aren't failing because trading is impossible; they’re failing due to massive cognitive overload and terrible instructional design.
This site bridges that gap. I’m applying the principles of learning science, systems thinking, and minimalist UX to strip away the market noise and teach trading the way it actually should be taught.
Stay in Touch
Some of the pages on my travel blog contain affiliate links. Whenever you buy something through one of these links, I get a small commission at no extra cost to you. As an affiliate, I only recommend products and services that I feel are high quality and helpful to my readers. Thanks for your support.
Read More

Open almost any trading platform and you'll see EUR/USD sitting next to XAU/USD, NQ, ES, and a dozen CFDs on stocks you've heard of. They all show up as candlesticks moving left to right, which quietly implies they're all the same kind of thing. They aren't. Before going deeper into any one of them, it's worth drawing the map.
Updated on Sep 6, 2026

Futures are standardized contracts tied to defined specifications and a future settlement date. They can look complex at first, but the mechanics become much clearer once you know what the contract specification controls. Here's what you actually need to know.
Updated on Sep 6, 2026

CFDs appear everywhere in retail trading – but most new traders couldn't explain exactly what they are or why that matters. Here's a plain-language breakdown, including the parts that most introductions skip.
Updated on Sep 6, 2026