Breakout Trading Part 5: Backtesting and Metrics

Learning Path Stage 6: Find Your Strategy
Learning Level 5: Evaluation
Primary Learning Objective
By the end of this lesson, you will be able to backtest a breakout trading system and interpret the results with appropriate skepticism about the difference between historical and forward performance.
We have made it to the final chapter of our breakout series. We’ve covered the psychological hype, the mechanical order flow, the core setup environments, the curated learning resources, and the raw reality of my personal testing sandbox.
But if this series were a software product launch, Part 6 is the rigorous, automated quality assurance testing phase. This is where we strip away all remaining human ego, open up the diagnostic terminal, and let cold, hard historical data tell us if our trading thesis actually possesses a positive mathematical expectancy.
If you want to survive as a market operator, you must stop evaluating your performance based on individual "winning" or "losing" feelings. You need to view your strategy through the lens of data architecture. Let’s look at why breakout strategies are uniquely suited for rigorous backtesting, the exact metrics framework you need to build, and what institutional academic research reveals about the reality of the breakout edge.
Why Breakout Systems Are a Software Engineer's Dream
Many discretionary trading strategies are an absolute nightmare to backtest because they rely on vague, subjective design choices. ("Enter when the pullback feels deep enough.")
Mechanical breakout systems (like a 20-day high/low channel or an intraday Opening Range Breakout) have a massive structural advantage: the rules are entirely binary.
There is zero room for interpretation. No hindsight contamination. No mid-session existential crises. No tweaking the lines after the fact to convince yourself that a losing trade "didn't really count." Because the criteria are clinical, a backtest shows you exactly what the system would have done in historical market environments. You get high-fidelity performance data, not a reconstructed fantasy.
Building the Backtest Architecture
To build a clean, automated backtest without frying your cognitive circuits, follow this systematic four-step blueprint:
Step 1: Define Your Entry Rule with Total Precision
Do not just code "buy the break." Choose an explicit execution path:
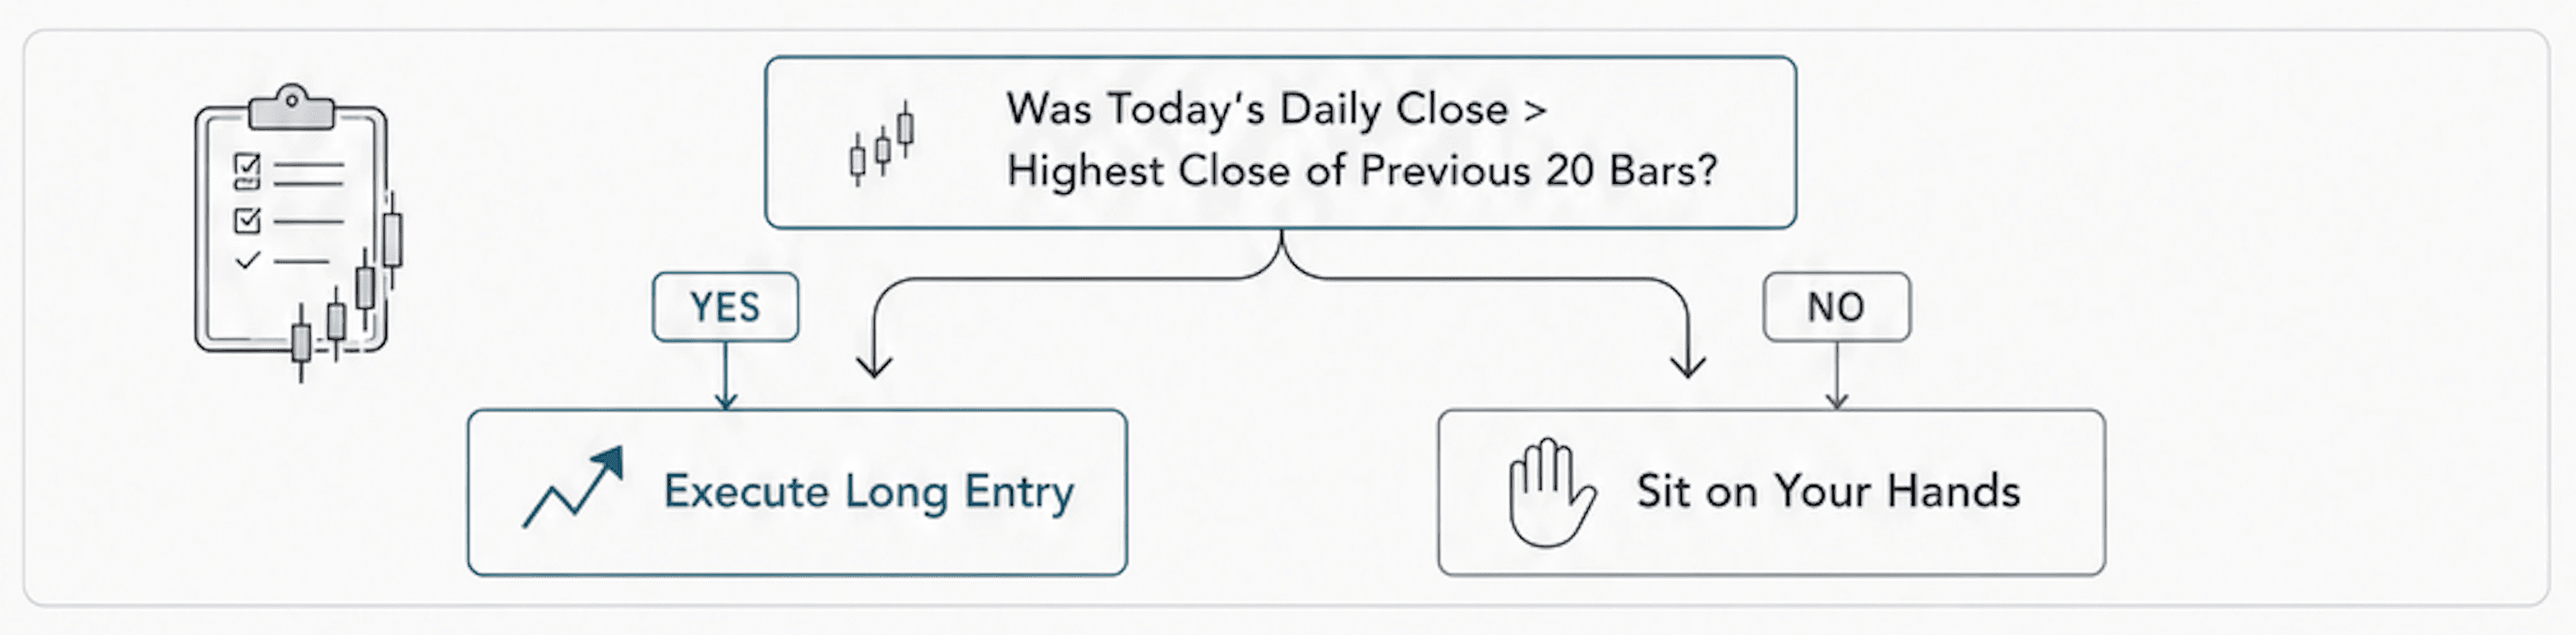
The Raw Breakout: Long immediately when the daily close is greater than the highest close of the previous 20 bars.
The Two-Bar Confirmation: Long only if today's close and yesterday's close both print above the 20-day high ceiling.
The Structural Retest: Long when price pulls back to within 5 pips of the broken 20-day high, provided it happens within 3 bars of the initial breakout close.
Step 2: Establish Clinical Exit Conditions
A system is completely useless without an automated escape hatch. Pick one:
The Trailing Stop (Turtle-Style): Exit the position completely when price prints a close below the rolling 10-day low.
The Volatility Trailing Stop: Trail your stop-loss at exactly $2 \times \text{ATR}$ (Average True Range) below the highest high achieved since your entry.
The Rigid Risk-Reward Matrix: Set a hard profit target at a 2.5:1 reward-to-risk ratio relative to your entry price, with your stop tucked safely inside the breakout level.
Step 3: Source the Code
You do not need a computer science degree to start. The classic 20-day breakout system is available for free inside TradingView's public indicator library. If you want to customize your rules, basic Pine Script can be learned over a single weekend using TradingView's native documentation.
Step 4: Isolate a Minimum 5-to-10 Year Window
Testing a strategy over a 6-month window is a critical design flaw. You risk capturing a single, highly favorable market regime. Running your script over a 5-to-10 year window ensures your strategy gets punched in the face by trending structures, sideways consolidations, and extreme macro crisis environments.
The Metrics Framework: Decoding the Diagnostic Report
When your backtest finishes running, ignore the total net profit dollar figure. That is a vanity metric. To evaluate whether your system is built for long-term survival, look at this diagnostic dashboard:
Core Metric | Target Healthy Range | What It Actually Tells You |
Win Rate | 35% – 50% | Expectedly low. Breakout systems lose frequently but win big. |
Average Reward-to-Risk | 3:1 to 5:1 R | The ultimate shield. Your winners must dwarf your losers to survive the low win rate. |
Profit Factor | 1.4 – 1.8 | Total gross profits divided by total gross losses. Anything above 1.5 is a viable business. |
Maximum Drawdown | 15% – 25% | The peak-to-trough equity drop. Essential for monitoring your real psychological staying power. |
Trade Frequency | 15 – 30 trades/year | Calculated on a daily chart. Low enough to manage without burning out your execution focus. |
Breakout-Specific Analytics:
To truly tune your system, track these three customized data fields:
The False Breakout Rate: Take your total losing trades where price briefly breached the level before reversing, and divide it by your total trades. This metric tells you if adding extra confirmation filters actually protects your capital, or if it just causes you to miss the best moves.
Regime Outperformance: Compare your system's metrics when the Average Directional Index (ADX) is above 25 (trending) versus when it sits below 25 (ranging). A healthy breakout system should show a dramatic performance surge during trending regimes.
Holding Time Asymmetry: How long do your winners breathe compared to your losers? In a high-expectancy breakout model, your losers should hit their stops fast (hours or days), while your winners are held for weeks to maximize the trend.
What the Institutional Research Reveals
If you think breakout trading is a passing fad, the academic data will pleasantly surprise you. Institutional funds have studied these exact mechanics for decades:
The Turtle Experiment (1983-1988): Richard Dennis's original data proved that an unrefined group of retail participants could generate massive positive returns using nothing but a mechanical 20-day breakout model across highly diversified commodities futures.
AQR Capital Management (Time-Series Momentum, 2012): Quantitative researchers Moskowitz, Ooi, and Pedersen published landmark papers proving that breakout models—as a core subset of trend following—have generated persistent, positive returns across multiple asset classes and historical centuries.
The Decay of Simple Signals: Modern institutional research also introduces an important caveat: because simple 20-day breakouts are highly public, high-frequency algorithms have naturally compressed their edge in hyper-liquid markets. The edge hasn't vanished, but it requires cleaner execution—meaning you must focus on high-quality pattern confirmation, trend alignment, or elite exit management.
Multi-Instrument Stress Testing
To prove your strategy isn't just an accidental fluke, you must run it across completely different market behaviors. Look at how a standard Turtle-style 20-day breakout performed historically across different assets over a 10-year window:
Gold (XAU/USD): 44% Win Rate | 1.72 Profit Factor $\rightarrow$ Exceptional performance because Gold is a highly trend-prone asset driven by macro fear.
WTI Crude Oil: 41% Win Rate | 1.65 Profit Factor $\rightarrow$ Strong, persistent institutional trends.
EUR/USD: 38% Win Rate | 1.58 Profit Factor $\rightarrow$ Highly sustainable, solid baseline performance.
USD/JPY: 32% Win Rate | 1.31 Profit Factor $\rightarrow$ Marginally profitable, highly prone to grinding, mean-reverting ranges.
The Design Pattern: Trend-heavy instruments significantly outperform range-bound, mean-reverting instruments under the exact same system rules. Instrument selection isn't a minor detail; it is an active edge variable.
The Ultimate Filter: The Forward Test Requirement
A backtest is an elegant look into the past, but it has one massive limitation: it cannot test the human being sitting in front of the screen. Before you scale up your live capital, you must commit to a minimum 3-to-6 month forward-testing window using a demo account or tiny position sizes. Here is why this step is mandatory:
Subjective Friction: If you are trading geometric patterns (like triangles or flags) instead of mechanical 20-day rules, a backtest cannot record your personal real-time chart accuracy. Forward testing exposes whether your eyes can actually identify the setup before the resolution happens.
Psychological Execution: A historical backtest spreadsheet handles a 14-trade losing streak in a single microsecond. In live forward testing, experiencing 14 consecutive losses means staring at a declining equity curve for nine straight months. Forward testing doesn't test the system; it tests you.
A backtest proves the mathematical validity of the software code. Forward testing proves whether you are the operator who possesses the discipline to run it without overriding the script.
FAQ: Frequently Answered Truths
Q: What's the best Pine Script breakout system to start backtesting?
A: Keep your interface simple. Start with the classic 20-day high/low breakout. Go long when the daily close exceeds the highest high of the last 20 days. Exit entirely when the daily close drops below the 10-day low. Open TradingView's public library and search for "Turtle Trading" to find a pre-built script. Just audit the lines of code to make sure it matches your exact parameters before hitting "Run." This provides a clean, unpolluted baseline to measure all your future modifications against.
Q: How do I account for false breaks in my backtest results?
A: You don't need to manually filter them out. False breakouts will naturally record themselves as clean, standard losing trades. Your only job is to evaluate whether adding specific confirmation layers (like volume spikes or a second confirming candle close) improves your profit factor. Keep the big picture in mind: if a confirmation filter boosts your win rate by 10% but slashes your overall trade frequency by 40%, it might actually lower your net dollar return. Always optimize for overall expectancy, not just a prettier win rate.
Q: Should I backtest one instrument or multiple?
A: Always build your baseline prototype on a single liquid pair, like EUR/USD daily. Once your script works flawlessly there, run the exact same parameters across four or five completely different asset classes—like GBP/USD, Gold, Crude Oil, and a equity index future. If the performance metrics remain positive across the board, your system has found a legitimate, structural edge. If the profit factor completely collapses on everything except your first chart, you haven't found an edge—you’ve just accidentally curve-fitted your data to past noise.
Success Criteria
After completing this lesson, you should be able to define testable rules for a breakout system, run a backtest, and identify the specific ways breakout backtests are prone to overstating future performance.
Common Misconception
A good breakout backtest requires complex filters and parameters.
The Truth: Starting with the simplest possible breakout rules and accepting their honest results is more informative than building filters that fit the historical data particularly well.
FAQ's
Q: How do I account for false breaks in my backtest results?
Q: Should I backtest one instrument or multiple?
Q: What's the best Pine Script breakout system to start backtesting?
Table of Contents
About Me

Krista Weber
After a career as a VP of UX and EdTech executive, I retired early—and quickly realized the traditional world of trading education is fundamentally broken.
As someone with a Master’s in HCI who specialized in the design of e-learning systems, I saw a massive gap: beginners aren't failing because trading is impossible; they’re failing due to massive cognitive overload and terrible instructional design.
This site bridges that gap. I’m applying the principles of learning science, systems thinking, and minimalist UX to strip away the market noise and teach trading the way it actually should be taught.
Stay in Touch
Some of the pages on my travel blog contain affiliate links. Whenever you buy something through one of these links, I get a small commission at no extra cost to you. As an affiliate, I only recommend products and services that I feel are high quality and helpful to my readers. Thanks for your support.
Read More
Breakout trading is the practice of entering a position the moment price moves beyond a defined level of support or resistance. It sounds simple, and it is, in structure. The challenge is that most breakouts are false.
Updated on Jun 12, 2026

Why matching a strategy to your cognitive style matters more than finding the 'best' one.
Updated on Apr 27, 2026

Before exploring individual strategies, it's worth asking a more fundamental question: what actually counts as a trading strategy? The answer shapes everything.
Updated on Apr 27, 2026