How to Critically Read a Backtest
A backtest can make almost any strategy look profitable. Knowing what makes a backtest meaningful (and what makes it misleading) is a foundational skill for evaluating any system you encounter or build yourself.

Learning Path Stage 1: Foundations
Learning Level 5: Evaluation
A backtest simulates what would have happened if you had applied a strict set of rules to historical price action data. It is a fantastic tool for structural hypothesis testing.
But let's establish a blunt reality check right now: A backtest shows you the past. It does not predict the future.
The core industry problem is that backtests are routinely presented (by retail vendors to buyers, and by traders to their own desperate egos) as definitive proof of a profitable system. The implied, low-friction message is always the same: "Look how well this script performed in 2022; therefore, your future wealth is mathematically guaranteed."
A well-constructed backtest is simply evidence of an historical edge under a very specific set of environmental conditions. That is a completely different asset class from proof of future profitability.
Here is how to audit a backtest like a cynical software engineer, whether you are evaluating a vendor's flashy spreadsheet or stress-testing your own code.
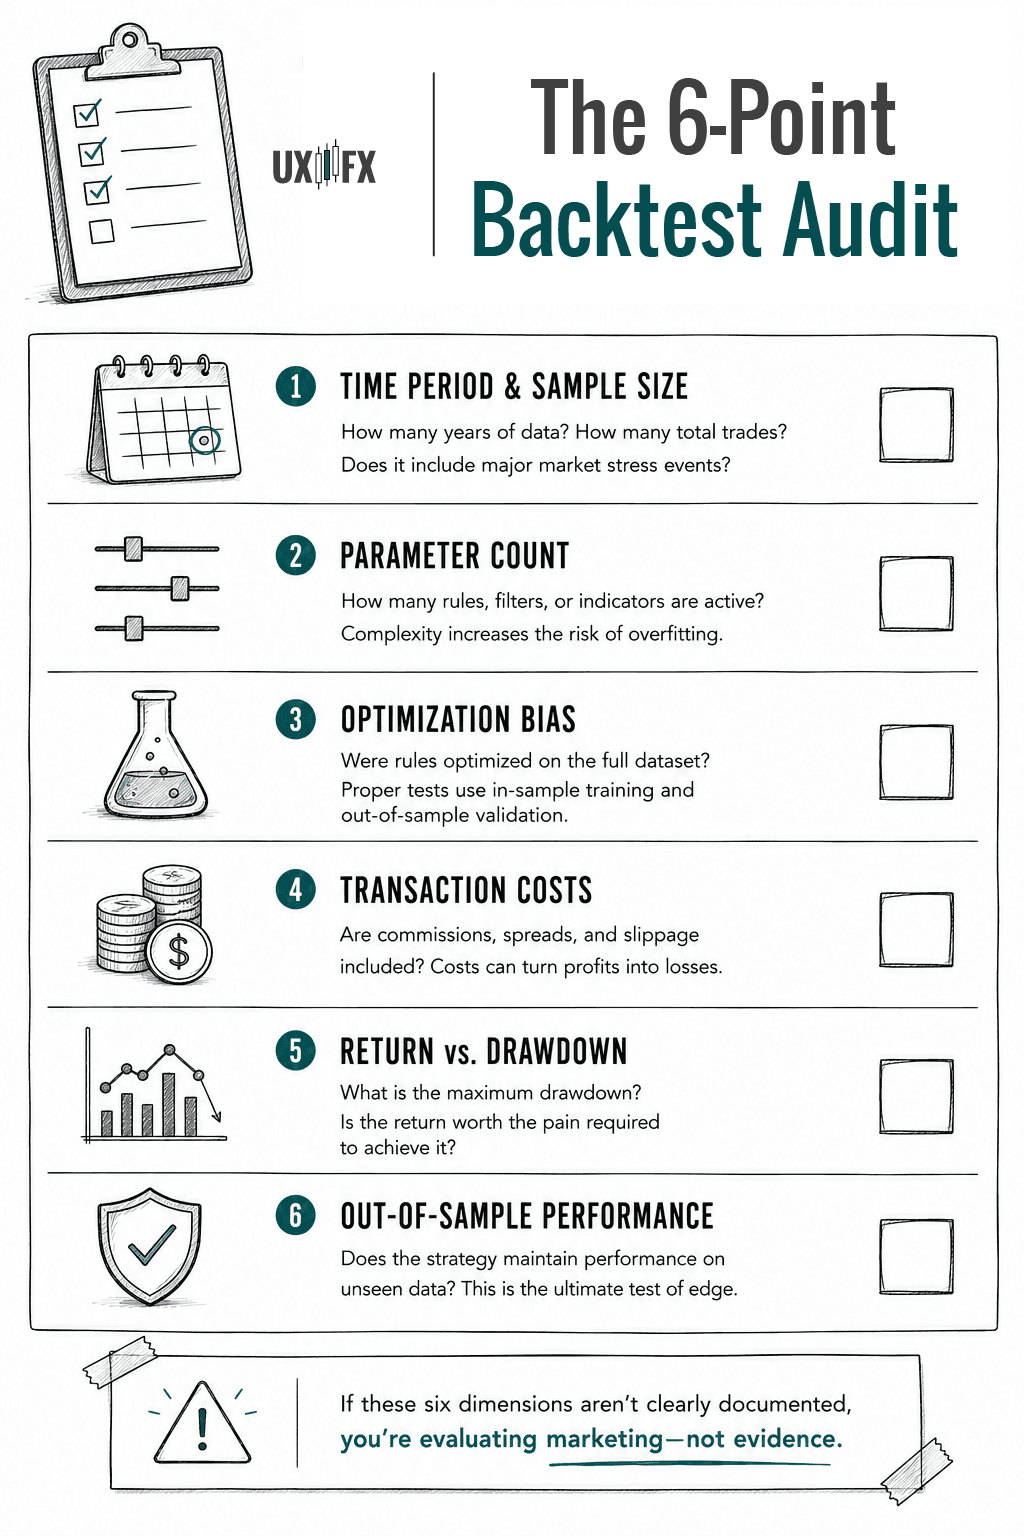
1. The 6-Point Backtest Audit Checklist
If you are reviewing a backtest and it doesn't clearly document these six database dimensions, you aren't looking at data. Instead, you're looking at marketing material.
1. Time Period & Sample Size
How many years does the dataset cover, and what is the total N-count of the trades? A 10-year backtest containing 500 execution samples is a robust statistical baseline. A 6-month backtest containing 45 trades is just a lucky streak. Furthermore, check if the data includes major tail-risk volatility events (like 2008 or 2020). If a strategy hasn’t been stress-tested in a chaotic market regime, you have no idea when the system will crash.
2. Parameter Count (Feature Creep)
Count the active rules. Every single constraint or indicator filter you add—a 20-period moving average, an RSI threshold below 35, a strict time-of-day clock, a MACD crossover—vastly increases your risk of overfitting. A strategy built on 2 or 3 core behavioral rules is highly likely to capture a genuine market dynamic. A strategy requiring 8 specific parameters is just a math equation forced to look pretty on one specific slice of history.
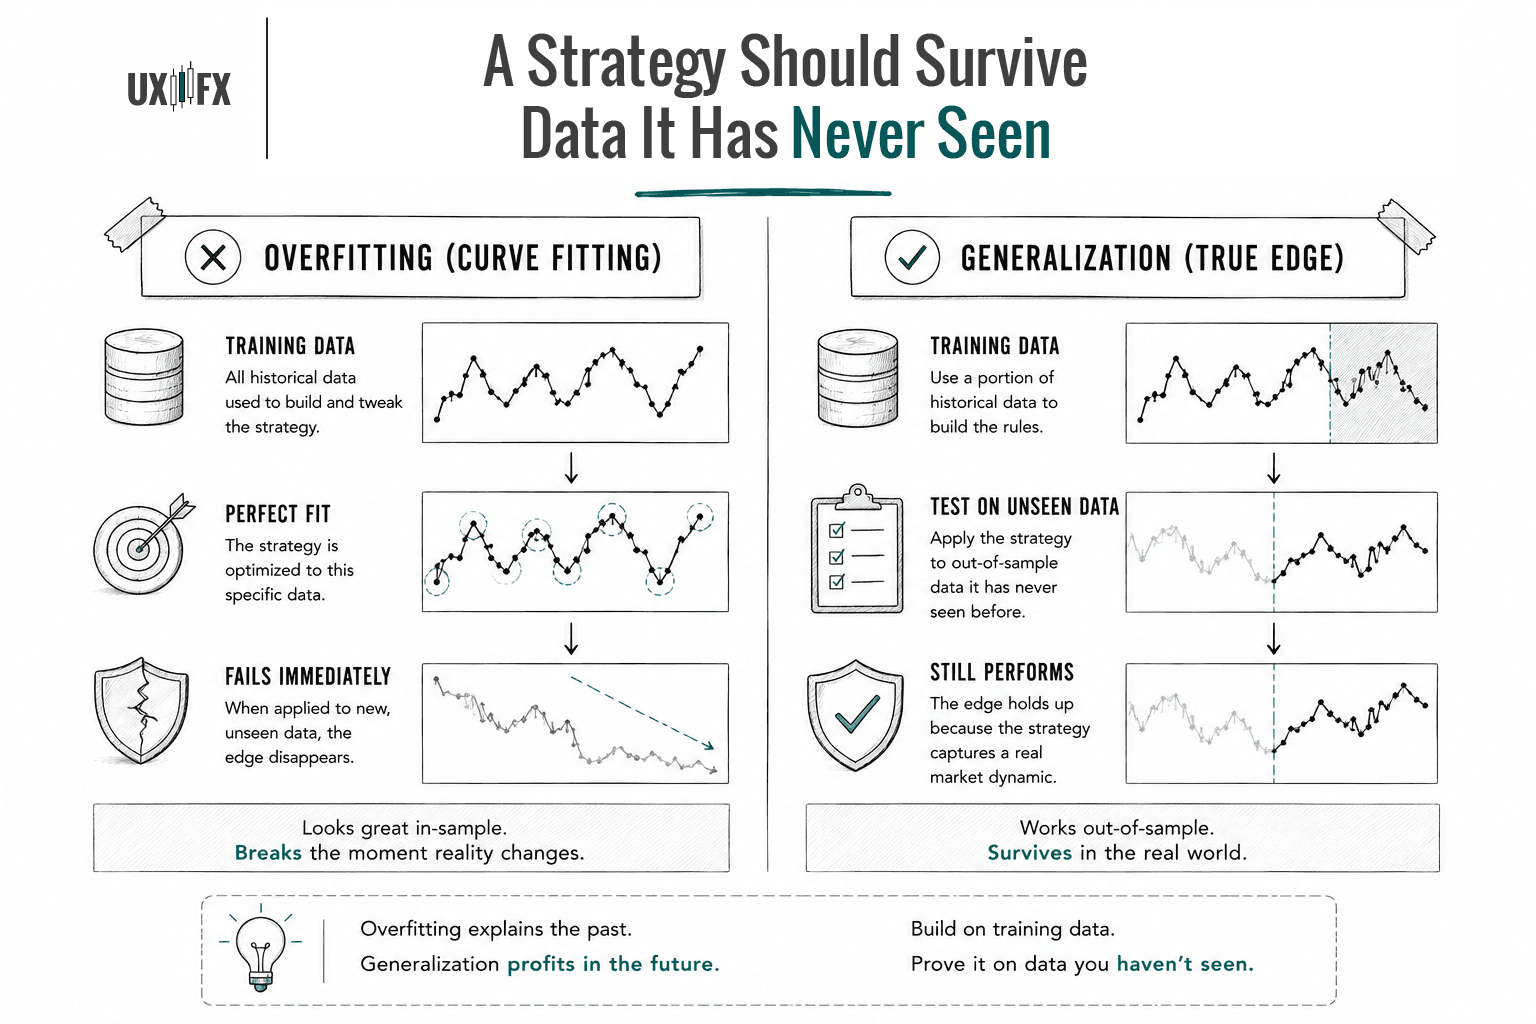
3. Optimization Bias (Curve Fitting)
If a vendor boasts that their system uses a "proprietary 31.4-period variable moving average," run away. This means they ran an optimization script that tested every single decimal point to find the exact combination that generated the highest historical return on that specific data, and then packaged it as a feature.
The professional protocol requires splitting your data: you build and optimize your parameters on a "Training" dataset, and then you run the system on completely unseen, Out-of-Sample historical data. If the performance degrades out-of-sample, the strategy is broken.
4. Transaction Costs (The Silent Killer)
Does the backtest account for real-world execution friction? Many published curves show performance before costs, which is completely irrelevant. If a scalping strategy shows an 8% annual return over 400 trades, but didn't factor in commissions, a 1-tick spread, and occasional slippage, the live version of that system is a guaranteed bankruptcy machine.
5. The Return-to-Drawdown Ratio
Maximum drawdown tells you exactly how painful the strategy was to execute at its absolute worst performance cycle.
Strategy Profile | Annualized Return | Max Historic Drawdown | The Reality Check |
The Ego Trap | 35% | 40% | Looks amazing on paper, but you will human-error override the system and panic-quit during the 40% account wipe. |
The Professional | 15% | 7% | Highly sustainable, low cognitive load, easily leveraged through proper position sizing. |

6. Out-of-Sample Performance Stability
The ultimate metric. If a strategy maintains its equity curve slope when dropped onto a block of data it has never seen before, it has passed its quality assurance test. If the line goes flat or plunges into the floor, the edge is a ghost.
2. Common Backtest Manipulation Techniques
When scrolling through social media or looking at software vendor landing pages, you must actively look for malicious shortcuts designed to exploit your greed:
Cherry-Picked Epochs: The backtest covers exactly 2021 to 2023 because that specific window perfectly favored the strategy's bias. The quiet drawdowns of 2024 and 2025 are conveniently sliced out of the timeline.
The Golden Child Instrument: The vendor shows you a beautiful curve on the Nasdaq (NQ) futures, but conveniently omits the fact that they ran the exact same script across ten other assets and only showed you the single winner.
Unrealistic Limit Fills: Assuming that limit orders fill with 100% certainty the exact millisecond price touches the line, or assuming immediate execution at the dead close of a candle. In live, fast-moving markets, order routing physics do not work that way.
The Impossibly Smooth Equity Curve: Real edge is a game of probability distribution. It has jagged edges, losing streaks, and stagnation phases. If an equity curve looks like a smooth, perfect 45-degree angle without a single flatline, it is a post-hoc simulation adjustments fiction.

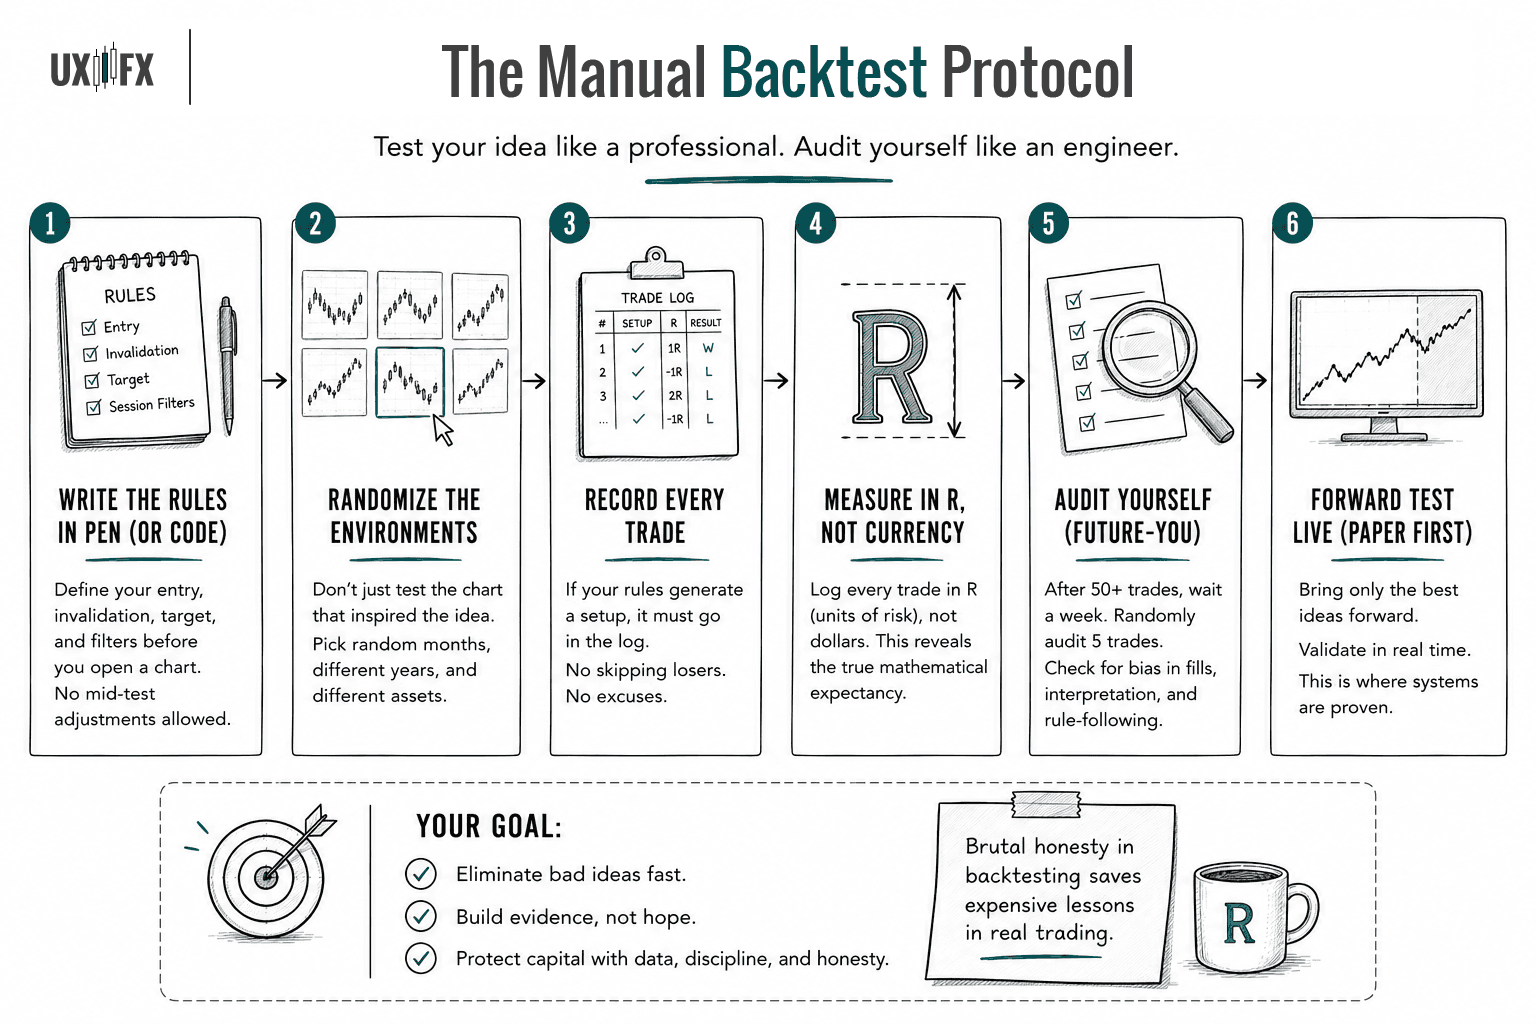
3. How to Run an Honest Manual Backtest
If you are testing your own manual price action framework, you have to be your own brutal quality assurance manager. Humans are naturally desperate to see their ideas succeed, which leads to massive cheating during manual testing. Use this optimization protocol:
The Self-Audit Protocol
Write the Rules in Code or Pen First: Define your entry trigger, your invalidation point, your target, and your session filters explicitly before you open chart replay. No mid-test adjustments allowed.
Randomize the Environments: Don't just backtest the specific historical chart that inspired the setup in the first place. Pick random months from multiple different years across different assets.
Log the Ugly Setups: If your written rules generate a setup, it must go into the spreadsheet. You cannot skip a losing sample because you tell yourself, "Well, in real life, I would have known the session volume felt weird here." That is hindsight bias protecting your feelings.
Use R-Multiples, Not Currency: Never log your backtest in dollars. Track the results strictly in $R$ (units of risk). This normalizes the data regardless of account size and reveals the pure mathematical expectancy of the edge.
The "Future-You" Audit: Once you finish testing 50 trades, wait a week. Then, randomly select 5 of those trades and audit your own work. Check if you unconsciously gave winning trades a generous benefit-of-the-doubt fill while holding your losing trades to a hyper-strict standard.
The Bottom Line
Backtests are incredibly useful for one primary reason: they are significantly better than guessing. They easily eliminate fundamentally broken strategies and prevent you from burning real capital on completely illiterate ideas. They give you a structured hypothesis to bring into a live forward-testing environment.
But a valid backtest can never guarantee that you will actually possess the cognitive discipline required to click the button when the system experiences five consecutive losses in real-time.
A backtest is merely the opening step of basic operational due diligence. If you treat it as the final proof, you've skipped the most critical part of the system design: the human execution factor.
FAQ's
Q: What sample size makes a backtest meaningful?
Q: Can I trust a backtest I ran myself on my own strategy?
Q: What is the most common way backtests mislead traders?
Table of Contents
About Me

Krista Weber
After a career as a VP of UX and EdTech executive, I retired early—and quickly realized the traditional world of trading education is fundamentally broken.
As someone with a Master’s in HCI who specialized in the design of e-learning systems, I saw a massive gap: beginners aren't failing because trading is impossible; they’re failing due to massive cognitive overload and terrible instructional design.
This site bridges that gap. I’m applying the principles of learning science, systems thinking, and minimalist UX to strip away the market noise and teach trading the way it actually should be taught.
Stay in Touch
Some of the pages on my travel blog contain affiliate links. Whenever you buy something through one of these links, I get a small commission at no extra cost to you. As an affiliate, I only recommend products and services that I feel are high quality and helpful to my readers. Thanks for your support.
Read More

Trend following has the best-documented body of public knowledge of any trading approach. The resources below represent decades of practitioner wisdom. Many of them are freely available and more rigorous than anything in the paid course market.
Updated on Jun 28, 2026

Trend following has been around longer than modern financial markets. Understanding why it persists, despite being psychologically uncomfortable to execute, reveals something important about what actually produces trading edge over time.
Updated on Jun 28, 2026

Higher highs and higher lows sounds simple. The mechanics of actually trading it — entries, stops, trailing, and exits — are where the work lives.
Updated on Jun 26, 2026