
Why Most Beginner Traders Overcomplicate Everything (And How to Stop)
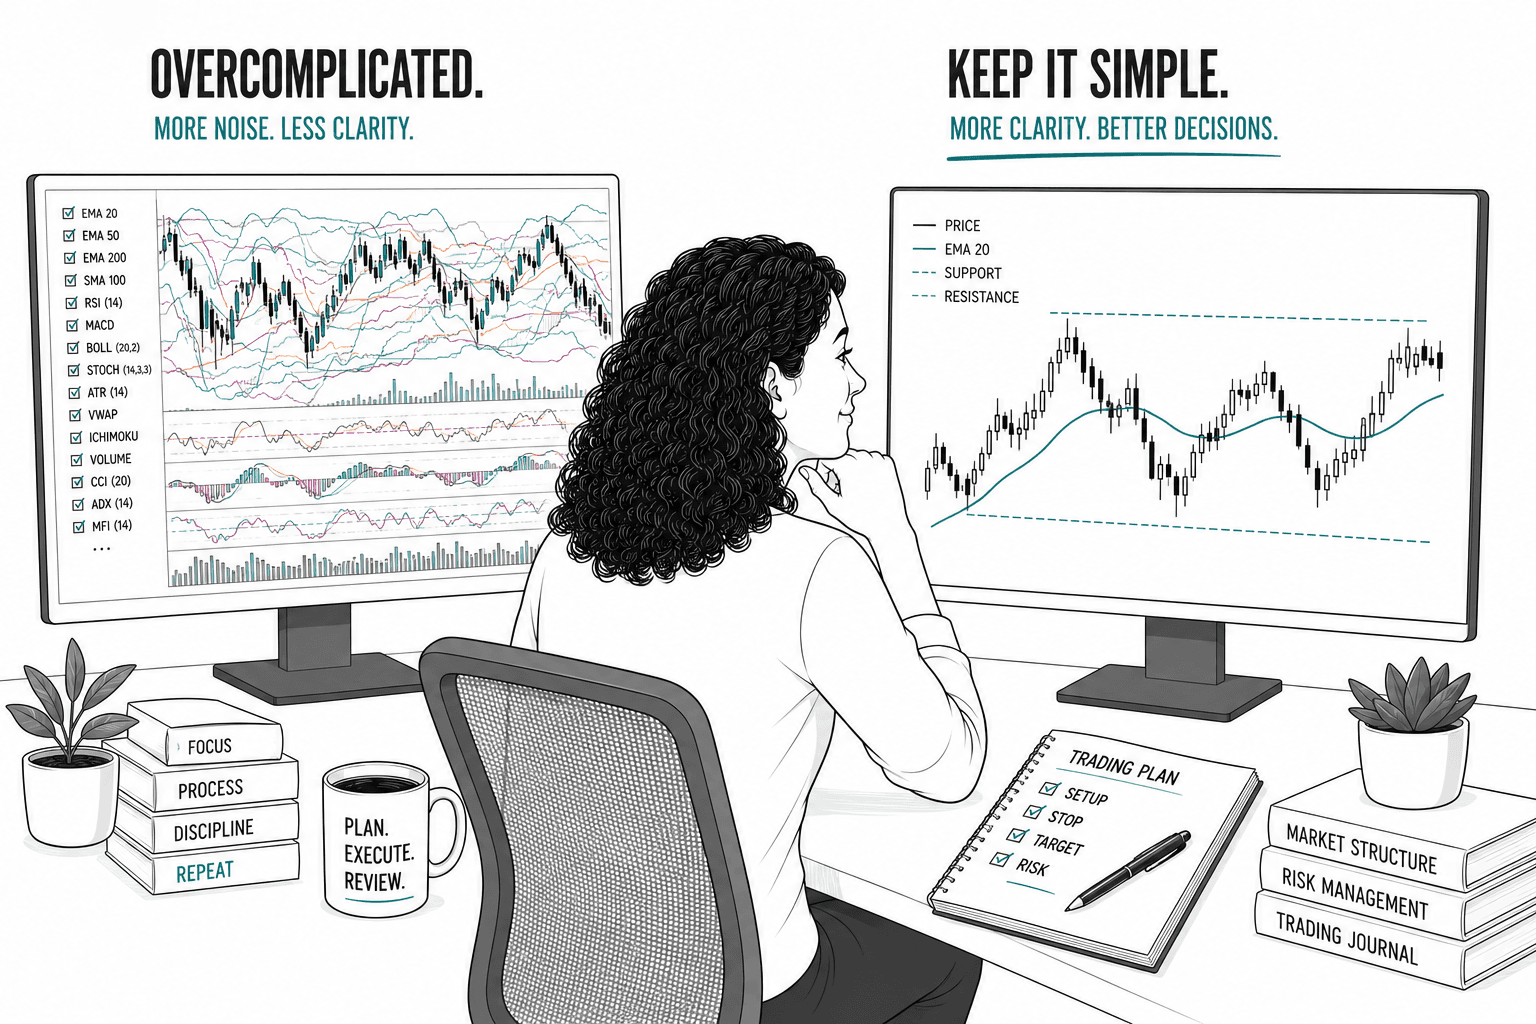
New traders tend to add complexity (more indicators, more strategies, more analysis) believing that sophistication leads to better results. It almost never does. Here's why simplicity wins and complexity costs more than it gives.
Learning Path Stage 1: Foundations
Learning Level 2: Understanding
Primary Learning Objective
By the end of this lesson, you will be able to explain why most beginner traders overcomplicate their strategies and connect that understanding to simplifying your own technical analysis and execution rules.
Let’s be honest: when you first start trading, a clean chart feels illegal. It feels like you're trying to perform open-heart surgery with a butter knife. So, what do you do? You add stuff. A lot of stuff. Until your screen looks like a neon disco exploded on a matrix grid.
Here is the truth about why we do this, what it’s costing you, and how to build a trading system that doesn't require a PhD in astrology.
The Complexity Trap (A 6-Month Timeline)
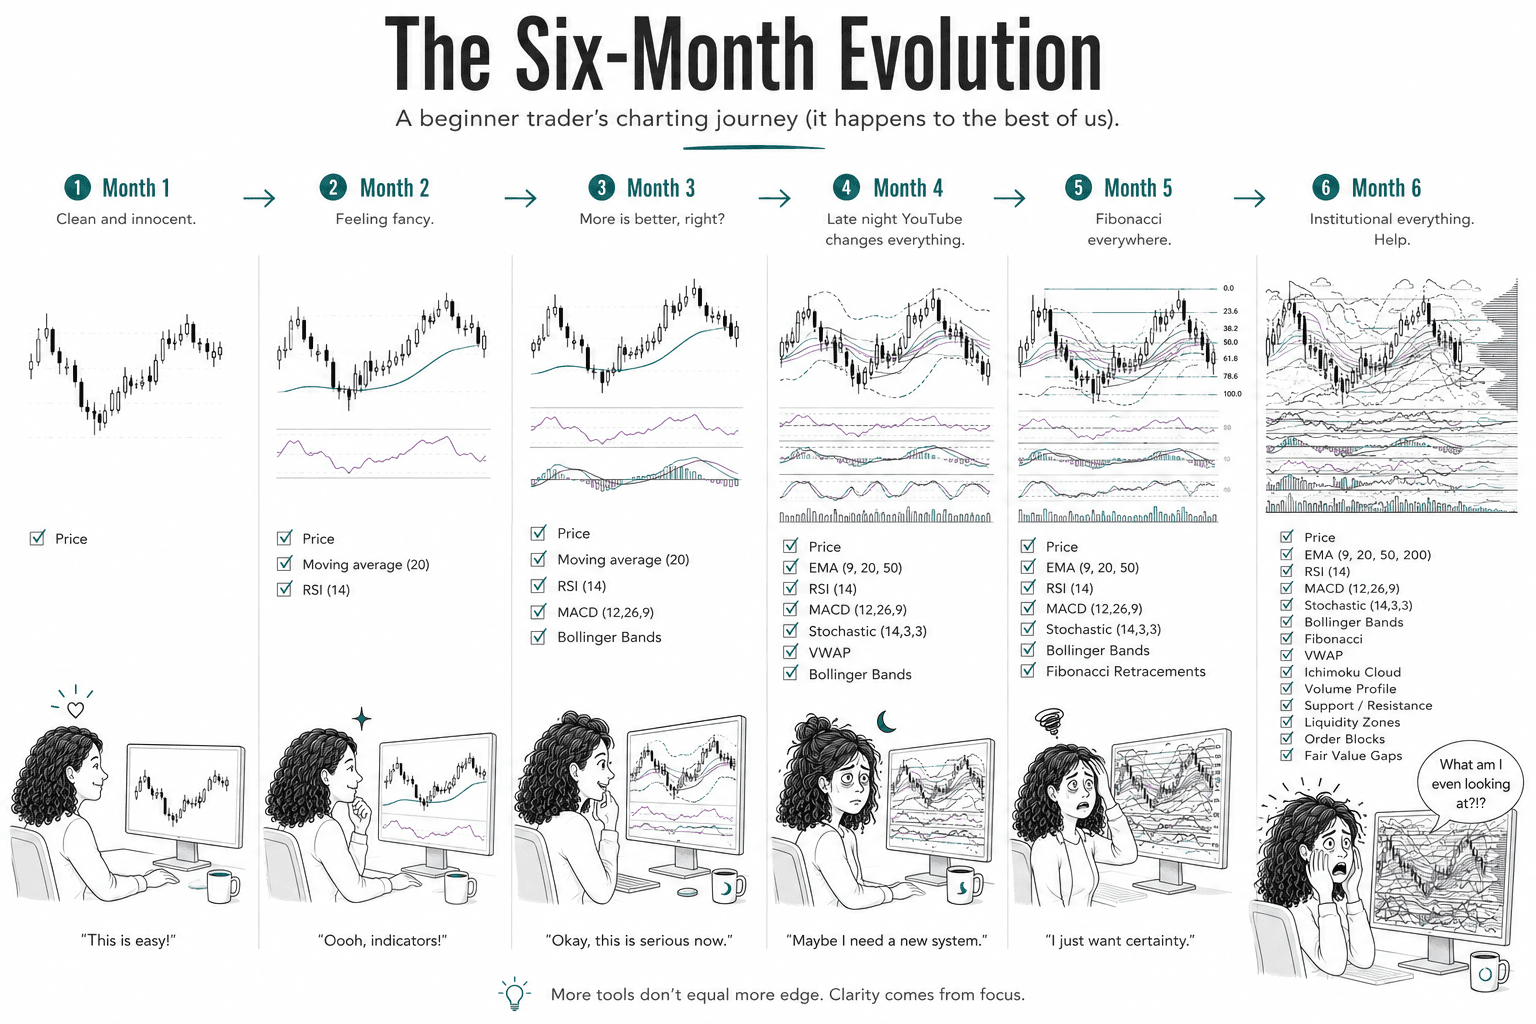
Most beginner traders follow a highly predictable, tragicomic chart evolution during their first year:
Month 1: Clean chart. Just pure, innocent candlesticks.
Month 2: You discover Moving Averages and the RSI. Feeling fancy already.
Month 3: You add MACD and Bollinger Bands. You now have two momentum indicators telling you the exact same thing, just in different colors.
Month 4: You watch a late-night YouTube video. You abandon the old tools and add a completely different set of indicators.
Month 5: You discover Fibonacci. Suddenly, you're drawing spiderwebs across your screen like a caffeinated arachnid.
Month 6: You discover institutional trading concepts and immediately try to use every one of them at the same time.
By month 6, your chart looks like a Jackson Pollock painting. You can’t make a decision because your indicators are locked in an endless argument, and you end up missing the move entirely.
The True Cost of Your "Sophisticated" Chart
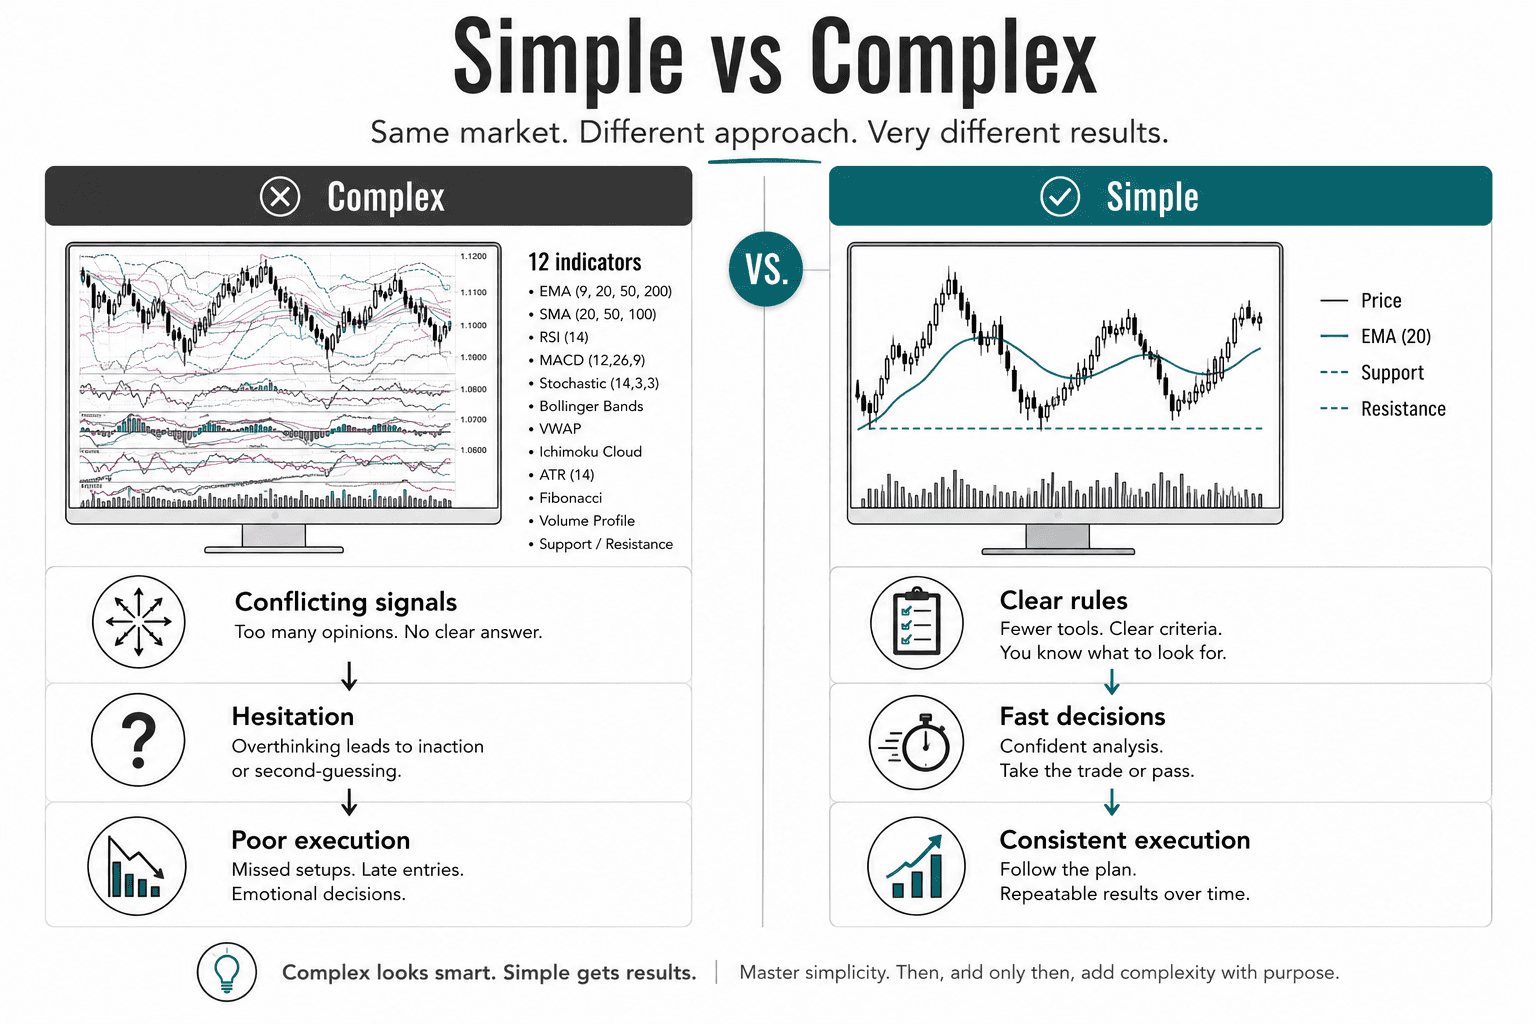
Analysis Paralysis: A setup that takes two minutes to analyze is a setup you’re going to miss or chase.
Inconsistent Execution: If your rule is "Enter when price crosses the 20 EMA, while RSI is above 50, MACD crosses, the daily chart is bullish, and the moon is in a waxing crescent," you will always have an excuse to break it. Ambiguity breeds hesitation.
Zero Learning Speed: When you lose a trade with a two-variable system, you can diagnose the issue. When you lose a trade with an eight-variable system, you have no idea who the culprit is. It's like trying to find out who stole your lunch in a crowded stadium.
The "Stupidly Simple" Version That Actually Works
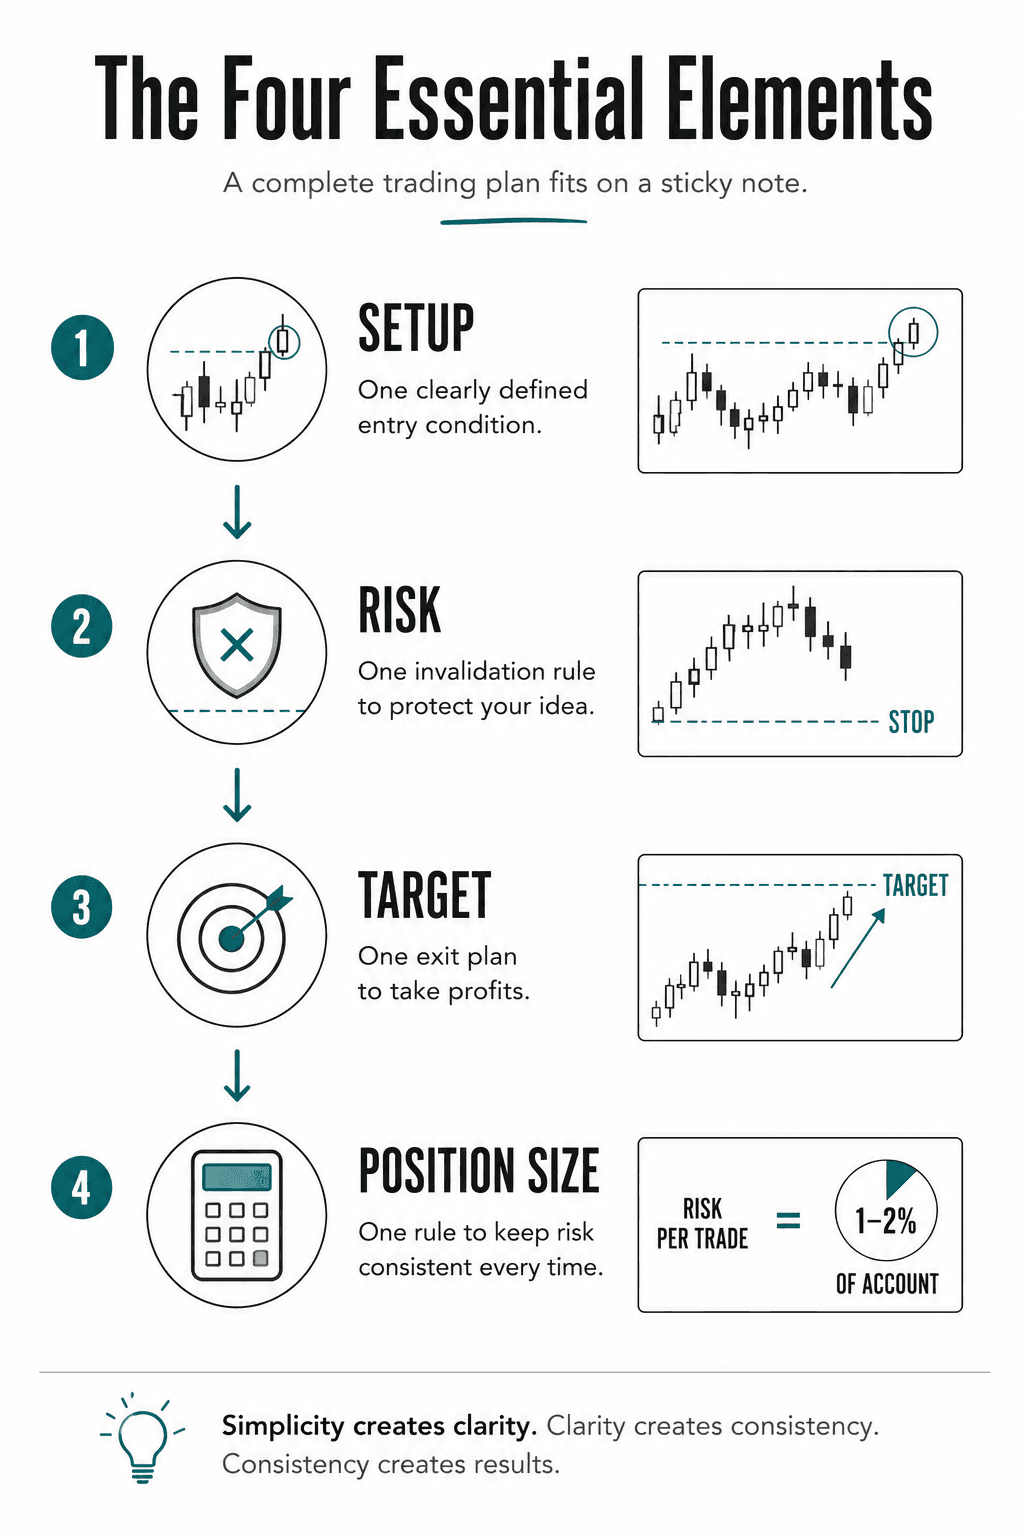
If you want to survive this game, your trading plan needs to fit on a sticky note, not a legal brief. Here is a complete, robust framework:
Element | Example | Element |
Setup | One clearly defined entry condition | Setup |
Stop | One invalidation rule | Stop |
Target | One exit plan | Target |
Risk | One position sizing rule | Risk |
Does this approach lack nuance? Sure. But consistency beats nuance every single day of the week.
The Golden Rule for Adding Complexity
You are only allowed to add a new rule or tool if you have hard data proving it fixes a specific, recurring flaw in your trading.
Good Addition: "I notice I keep buying into heavy daily downtrends. I will add a rule to check the daily chart trend before entering." (Specific problem —> specific solution).
Bad Addition: "I lost three trades this week, so I'm going to download this custom indicator I saw on TikTok to make me feel safe again." (Anxiety-driven addition).
The best traders in the world don't have complicated charts because they've learned which details actually matter; they have simple charts because they finally realized how much the rest of the clutter was costing them. Strip it down. Your future self will thank you.
Success Criteria
After completing this lesson, you should be able to:
Explain why adding more indicators doesn't necessarily improve decision-making.
Recognize signs that a trading plan has become unnecessarily complicated.
Identify the four essential elements every trading plan needs.
Describe when a new rule improves a strategy and when it simply reflects fear or frustration.
Common Misconception
Adding more indicators and criteria to a chart improves decision quality and accuracy.
The Truth: Beyond a small set of complementary tools, each additional variable introduces conflicting signals, data ambiguity, and severe decision paralysis. In live markets, simplicity breeds execution speed and consistency, while extreme complexity just hides past data tuning.
FAQ's
Q: Isn't a more complex analysis more accurate?
Q: What is the bare minimum required to actually trade?
Q: Why do traders reach for complexity in the first place?
Table of Contents
About Me

Krista Weber
After a career as a VP of UX and EdTech executive, I retired early—and quickly realized the traditional world of trading education is fundamentally broken.
As someone with a Master’s in HCI who specialized in the design of e-learning systems, I saw a massive gap: beginners aren't failing because trading is impossible; they’re failing due to massive cognitive overload and terrible instructional design.
This site bridges that gap. I’m applying the principles of learning science, systems thinking, and minimalist UX to strip away the market noise and teach trading the way it actually should be taught.
Stay in Touch
Some of the pages on my travel blog contain affiliate links. Whenever you buy something through one of these links, I get a small commission at no extra cost to you. As an affiliate, I only recommend products and services that I feel are high quality and helpful to my readers. Thanks for your support.
Read More

Open almost any trading platform and you'll see EUR/USD sitting next to XAU/USD, NQ, ES, and a dozen CFDs on stocks you've heard of. They all show up as candlesticks moving left to right, which quietly implies they're all the same kind of thing. They aren't. Before going deeper into any one of them, it's worth drawing the map.
Updated on Sep 6, 2026

Futures are standardized contracts tied to defined specifications and a future settlement date. They can look complex at first, but the mechanics become much clearer once you know what the contract specification controls. Here's what you actually need to know.
Updated on Sep 6, 2026

CFDs appear everywhere in retail trading – but most new traders couldn't explain exactly what they are or why that matters. Here's a plain-language breakdown, including the parts that most introductions skip.
Updated on Sep 6, 2026