Breakout Trading Part 1: What Is Breakout Trading?
Breakout trading is exactly what it sounds like: trading the moment when price moves through a significant level with momentum. It's one of the most intuitive strategies available and one of the most commonly misapplied. Here's what it is at its clearest.

Learning Path Stage 6: Find Your Strategy
Learning Level 1: Recognition
Primary Learning Objective
By the end of this lesson, you will be able to explain what breakout trading is and how it differs from trend following and support and resistance approaches.
What a Breakout Actually Is (And Isn't)
Price hits a level. It bounces. It hits it again. Bounces again. Then, one day, it punches straight through the drywall and makes a run for the parking lot.
That is a breakout.
More specifically: a breakout occurs when price moves past a defined boundary that previously contained it—above resistance or below support—with enough institutional force to suggest that the old boundary is officially dead.
Breakout trading simply means jumping on the train right as it bursts through the station gates. You are placing a bet that the broken level is the catalyst for a brand-new directional trend.
Why It Works (The Frictionless Engine)
Price levels don't hold because of magic lines on a chart; they hold because orders are stacked there like sandbags. Sellers protect resistance; buyers defend support. When those orders are completely exhausted or overwhelmed by aggressive market orders, price doesn't just trickle through—it runs. The sudden lack of opposing liquidity creates a vacuum, carrying price quite a distance before new opposition can even lace up its boots.
The Four Flavors of Escape
Instead of categorizing breakouts by the hundreds of classic chart patterns named after household objects, let's look at the four structural environments where they actually happen:
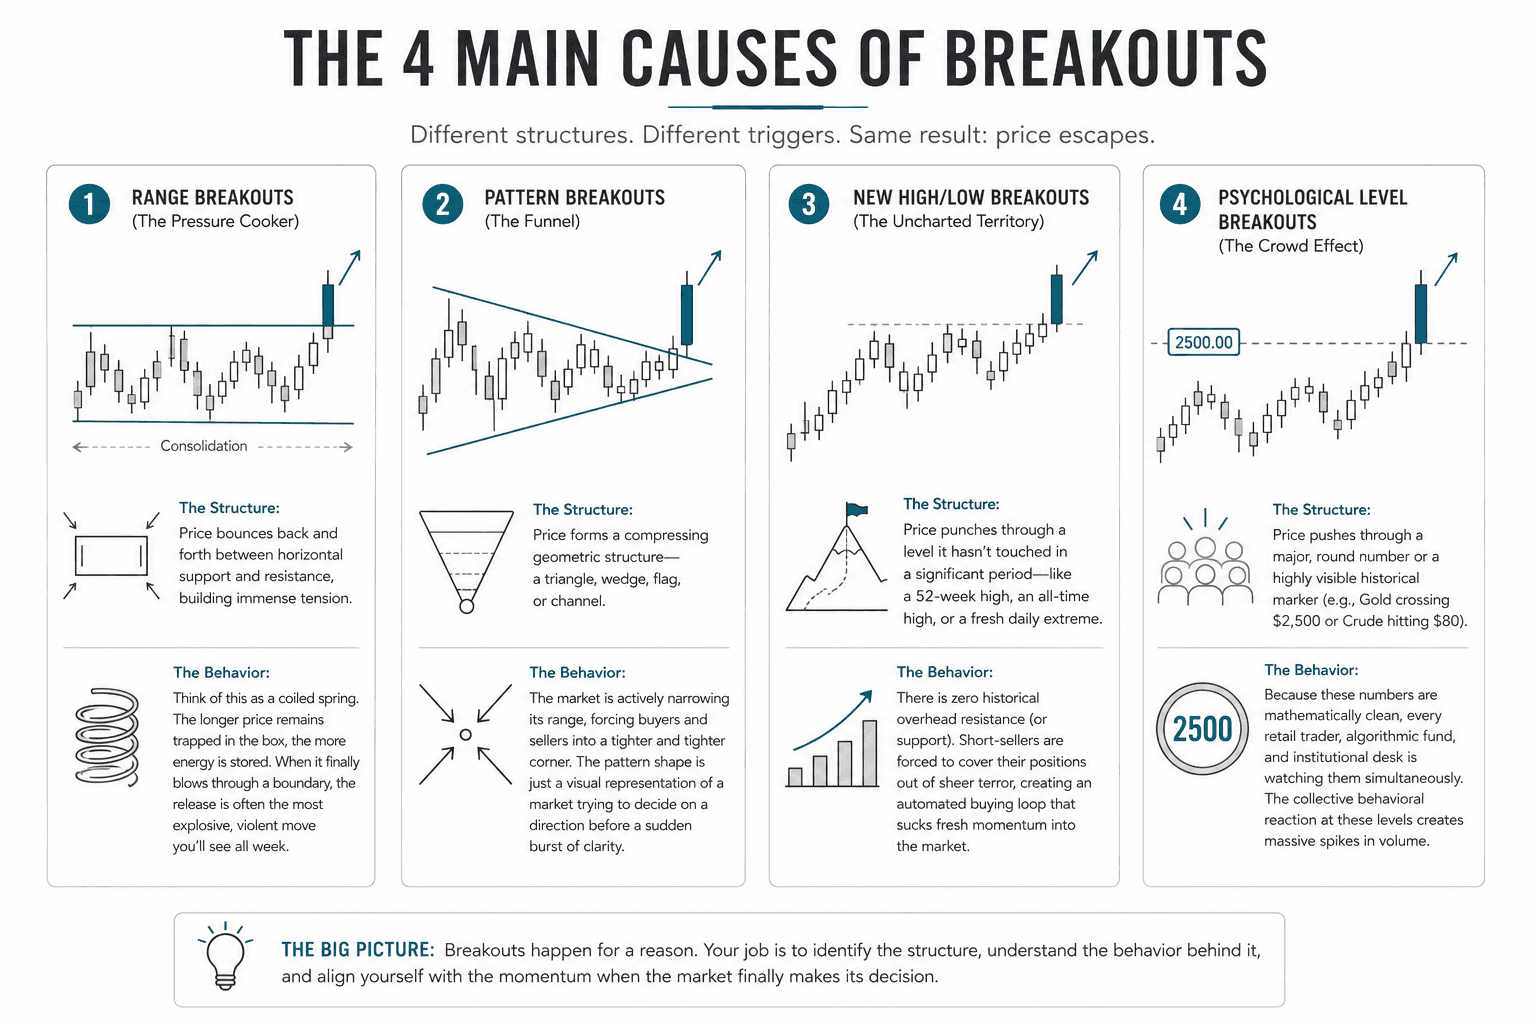
1. Range Breakouts (The Pressure Cooker)
The Structure: Price bounces back and forth between horizontal support and resistance, building immense tension.
The Behavior: Think of this as a coiled spring. The longer price remains trapped in the box, the more energy is stored. When it finally blows through a boundary, the release is often the most explosive, violent move you'll see all week.
2. Pattern Breakouts (The Funnel)
The Structure: Price forms a compressing geometric structure—a triangle, wedge, flag, or channel.
The Behavior: The market is actively narrowing its range, forcing buyers and sellers into a tighter and tighter corner. The pattern shape is just a visual representation of a market trying to decide on a direction before a sudden burst of clarity.
3. New High/Low Breakouts (The Uncharted Territory)
The Structure: Price punches through a level it hasn't touched in a significant period—like a 52-week high, an all-time high, or a fresh daily extreme.
The Behavior: There is zero historical overhead resistance (or support). Short-sellers are forced to cover their positions out of sheer terror, creating an automated buying loop that sucks fresh momentum into the market.
4. Psychological Level Breakouts (The Crowd Effect)
The Structure: Price pushes through a major, round number or a highly visible historical marker (e.g., Gold crossing $2,500 or Crude hitting $80).
The Behavior: Because these numbers are mathematically clean, every retail trader, algorithmic fund, and institutional desk is watching them simultaneously. The collective behavioral reaction at these levels creates massive spikes in volume.
What the Trade Looks Like (The Blueprint)
To keep your cognitive load low when the market is moving fast, a breakout trade can be distilled into four clinical steps:
![[ STEP 1: The Setup ] -> Identify a clean level tested multiple times. More tests = more orders trapped. ↓ [ STEP 2: The Trigger ] -> A large breakout candle opens on one side of the level and closes firmly on the other. Volume expands. ↓ [ STEP 3: The Entry ] -> Option A: Enter immediately at the candle close (higher risk of a fakeout, zero risk of missing the move). -> Option B: Wait for a retest of the broken level (lower risk, but the train might never come back for you). ↓ [ STEP 4: The Invalid ] -> Place your stop just inside the broken level. If price climbs back into the old house, the escape failed.](https://framerusercontent.com/images/bWTt7bnsMe8EcUv7X6TWG4AHw.png)
Your profit target is typically a measured move (taking the height of the prior range and stacking it on top of the breakout point) or the very next major architectural level on the higher timeframe.
The Elephant in the Room: Fakeouts
If breakout trading were as simple as "buy the line break," we would all be trading from yachts. The reality is that every breakout trader looks a fakeout in the face on a regular basis. Price peeks its head out of the window, looks around, changes its mind, and aggressively reverses to hunt your stop.
Surviving this discipline boils down to two distinct psychological shifts:
Filtering them intelligently: Using firm candle confirmation criteria, volume expansion checks, and avoiding sloppy, overextended patterns.
Accepting them mathematically: Accepting that a portion of these setups will fail, and cutting the losses cleanly without letting them turn into existential crises.
The math behind this strategy relies entirely on skew, not a flawless win rate. Because your stops are kept incredibly tight (just inside the broken level) and your targets aim for the birth of a new trend, a win rate of just 40% to 50% can easily fund a highly profitable career. Your average winners simply dwarf your average losers.
The Road Ahead
This is only the opening chapter. Over the next few weeks, we are going deep into the structural mechanics of how to trade this edge without melting your brain.
Here is the roadmap for our six-part series:
Part 1: What a Breakout Actually Is (That's this article)
Part 2: Mechanics – How to spot quality breakouts and structure your risk
Part 3: The Popularity Trap – Why everyone loves breakouts (and exactly when they fail)
Part 4: The Noise Filter – Legitimate learning resources vs. textbook garbage
Part 5: Into the Wild – My personal experience testing breakout strategies
Part 6: The Hard Data – Backtesting protocols and core performance metrics
Breakout trading is ultimately the art of catching price at the exact millisecond it escapes confinement. The real skill isn't finding the lines—it’s learning to tell a legitimate prison break from a false alarm. And that takes time, screen hours, and honest tracking.
Success Criteria
After completing this lesson, you should be able to define a breakout in precise structural terms, explain what market conditions create breakout opportunities, and describe the core entry logic.
Common Misconception
Any break above a prior high is a valid breakout trade.
The Truth: Legitimate breakouts require structural context: a period of consolidation, a meaningful level being broken, and confirming momentum; trading every break of a price level produces a high false breakout rate.
FAQ's
Q: What types of levels produce the best breakouts?
Q: Can you trade breakouts on any instrument?
Q: What's the difference between a breakout and a fakeout?
Table of Contents
About Me

Krista Weber
After a career as a VP of UX and EdTech executive, I retired early—and quickly realized the traditional world of trading education is fundamentally broken.
As someone with a Master’s in HCI who specialized in the design of e-learning systems, I saw a massive gap: beginners aren't failing because trading is impossible; they’re failing due to massive cognitive overload and terrible instructional design.
This site bridges that gap. I’m applying the principles of learning science, systems thinking, and minimalist UX to strip away the market noise and teach trading the way it actually should be taught.
Stay in Touch
Some of the pages on my travel blog contain affiliate links. Whenever you buy something through one of these links, I get a small commission at no extra cost to you. As an affiliate, I only recommend products and services that I feel are high quality and helpful to my readers. Thanks for your support.
Read More
Breakout trading is the practice of entering a position the moment price moves beyond a defined level of support or resistance. It sounds simple, and it is, in structure. The challenge is that most breakouts are false.
Updated on Jun 12, 2026

Why matching a strategy to your cognitive style matters more than finding the 'best' one.
Updated on Apr 27, 2026

Before exploring individual strategies, it's worth asking a more fundamental question: what actually counts as a trading strategy? The answer shapes everything.
Updated on Apr 27, 2026