
Bullish vs Bearish Candles Without the Drama
Bullish and bearish candles carry far more emotional weight than they deserve. They are records of one finished period, not predictions or moral events.

Learning Path Stage 2: Reading Charts
Learning Level 1: Recognition
Primary Learning Objective
By the end of this lesson, you will be able to read individual candlesticks and determine what happened during that time period at a glance.
What the Body vs Wick Actually Tells You
Once you accept that a candlestick is basically a compressed, over-caffeinated record of one period of trading, the obvious next question is: how do you read this thing without accidentally hallucinating patterns that aren't there?
The answer starts with two parts: the body and the wick.
Almost everything a candle tells you comes from the relationship between those two things. They aren't decoration, they aren't interchangeable, and they certainly aren't telling you the same story. They’re answering different questions—mostly about who is winning and who is currently having a mid-life crisis.
The Anatomy, Briefly
A candlestick has a rectangular body and usually one or two thin lines extending from it. These lines are called "wicks" or "shadows." I assume they’re called "shadows" because trading makes you feel like you’re constantly chasing something that isn't actually there.
The Body: Represents the distance between the open and the close. It is the part of the move that actually stuck. Whatever chaos happened during that period, the body is the "final result"—the part that made it into the record books.
The Wicks: Represent the extremes. The top is the highest price reached; the bottom is the lowest. The wicks show you where price went, realized it was a terrible mistake, and frantically retreated.
The Body Is the Conclusion
The body is the part most beginners read first. It tells you the net outcome.
A large body means price moved decisively from point A to point B. One side, buyers or sellers, was clearly in charge. A small body means price finished close to where it started, regardless of the emotional rollercoaster that happened in between.
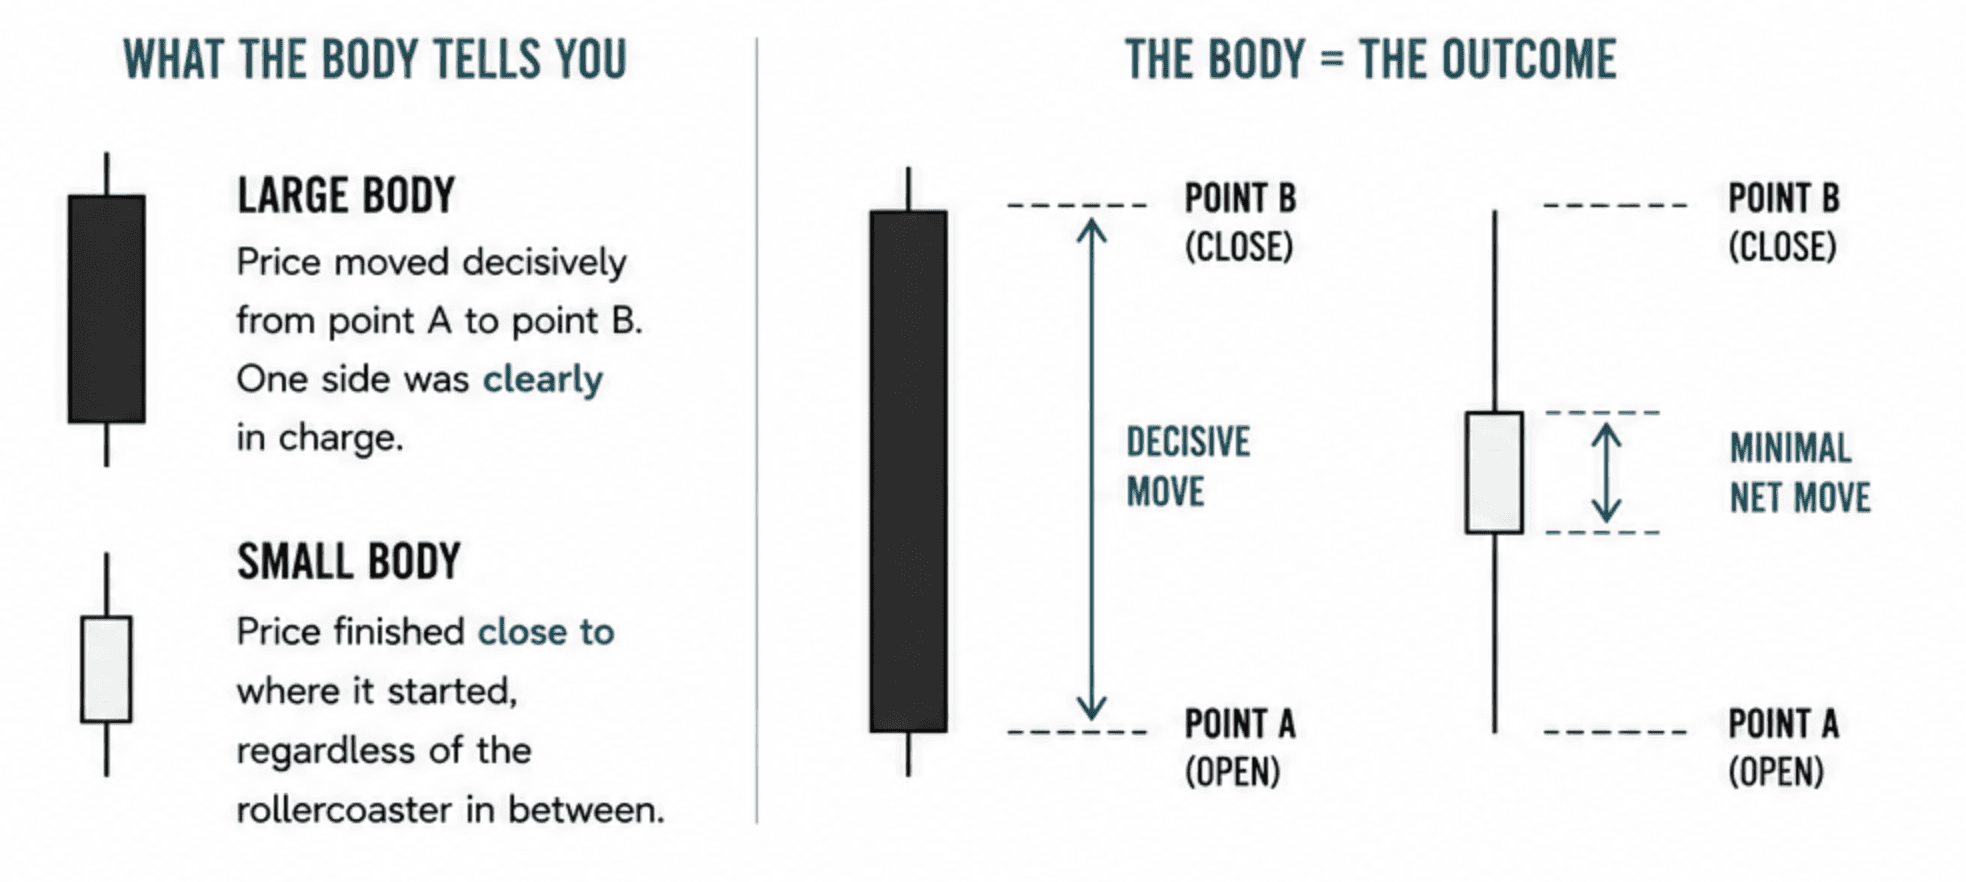
Think of the body as the conclusion of a paragraph. After all the frantic back-and-forth, here is where we actually ended up. If you only had time to glance at one thing on a candle, the body is the "adult in the room." It’s the part that says, "Okay, despite the screaming and the chaos, this is where we landed."

The Wick Is the Argument
The wick, however, is where the drama lives.
It tells you about the part that didn't settle. It shows you the ground price tried to take and then immediately lost.
Imagine a candle with a long, spindly upper wick. That means price surged higher, buyers looked excited, and then—oops—sellers stepped in and shoved the price back down. The upper wick is the visual record of that rejection. It’s the market saying, "I tried, but I really shouldn't have."
A long lower wick is the same story in reverse: sellers tried to crash the party, got shut down, and retreated before the period closed.

This is why wicks are behaviorally more interesting than the body. The body tells you who won the period. The wick tells you where the fight happened, which side got cocky, and who ultimately got embarrassed. A long wick isn't "noise"—it’s a small piece of evidence that price was rejected from a particular area.

Reading the Two Together (The Proportions)
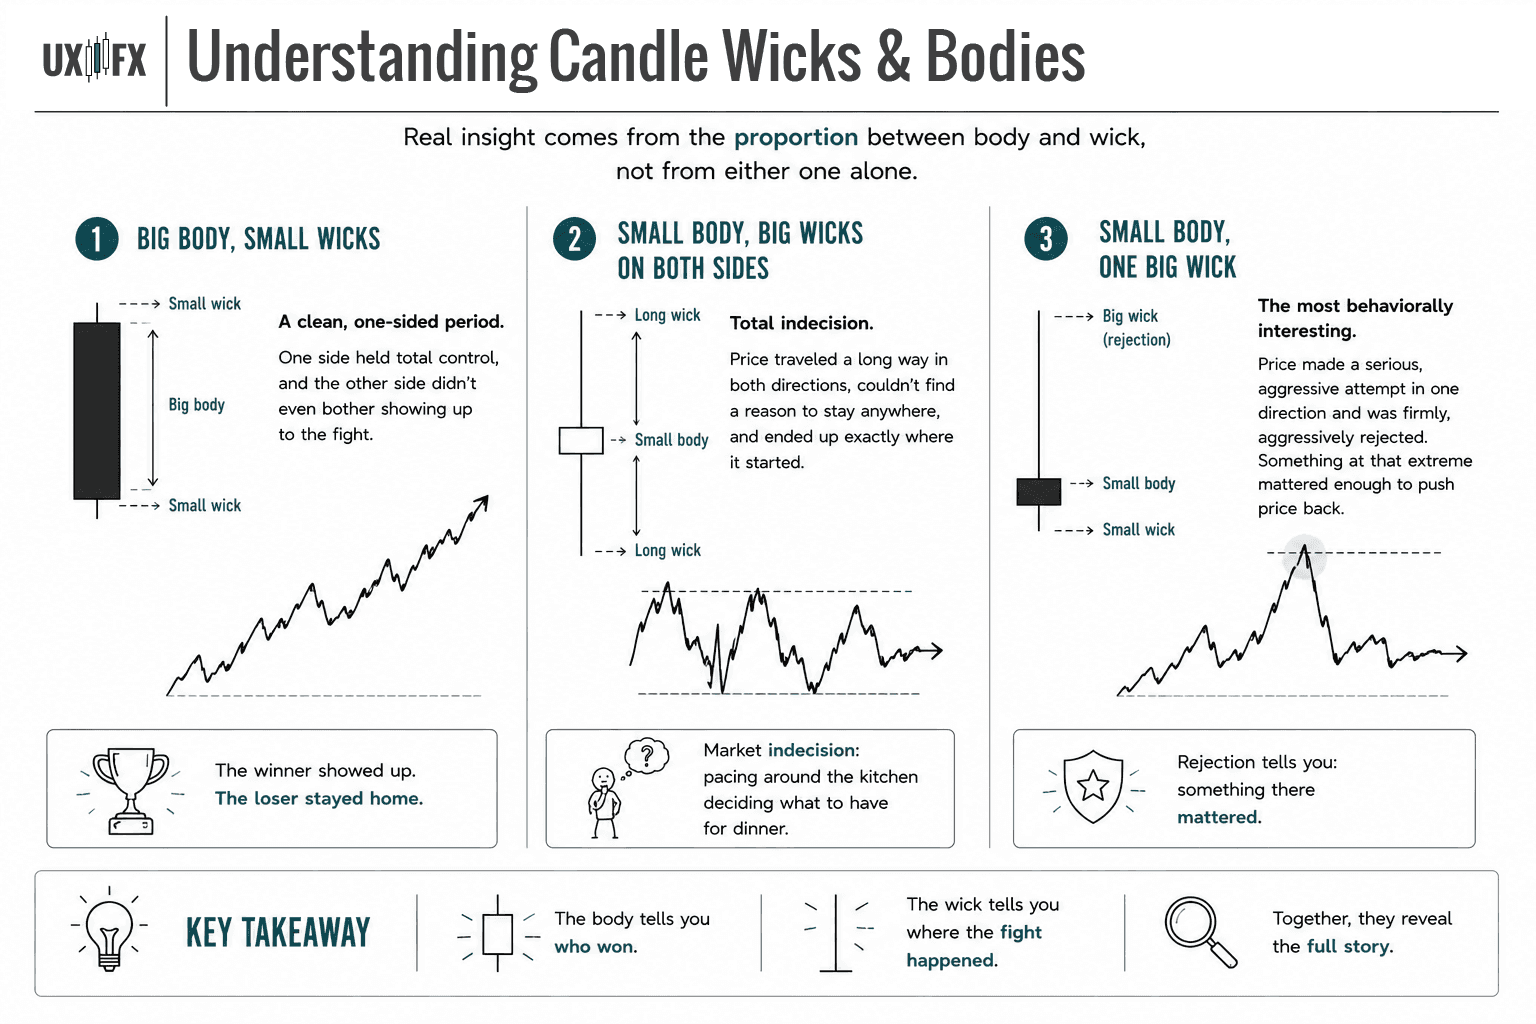
Real insight comes from the proportion between body and wick, not from either one alone.
Big Body, Small Wicks: A clean, one-sided period. One side held total control, and the other side didn't even bother showing up to the fight.
Small Body, Big Wicks on Both Sides: Total indecision. Price traveled a long way in both directions, couldn't find a reason to stay anywhere, and ended up exactly where it started. It’s the market version of someone pacing around their kitchen trying to decide what to have for dinner.
Small Body, One Big Wick: The most behaviorally interesting. Price made a serious, aggressive attempt in one direction and was firmly, aggressively rejected. Something at that extreme mattered enough to push price back.
You don't need fancy pattern names yet. Just look at the proportions. Big body means conviction. Big wicks mean conflict. One big wick means rejection.
A Caution About Single Candles
One honest warning: A single candle is just one period.
It is incredibly tempting, once you learn this, to stare at a single wick and think you’ve discovered the secret to the universe. A long wick feels profound. A giant body feels like a signal.
Sometimes they are. But sometimes they are just what happens when a bored market decides to go for a walk.
Treat a single candle like a sentence, not the whole paragraph. It gives you a piece of the story, but it only becomes truly meaningful when you see where it sits relative to everything else.
For now, keep it simple. Look at a candle, read it honestly, and try not to look for "ghost faces" in the chart patterns. Get comfortable seeing those two things—body and wick—clearly, and the rest starts to feel a lot less like reading tea leaves.
Success Criteria
After completing this lesson, you should be able to distinguish a bullish candle from a bearish one, explain what body size and wick length suggest about buying and selling pressure, and do so without relying on arbitrary rules.
Common Misconception
A green candle simply means price went up and a red candle means price went down.
The Truth: The relationship between body size, wick length, and their positions tells a richer story about who was in control during that period.
FAQ's
Q: Do candle colors matter?
Q: Can a single candle tell you where price is going?
Q: What is the difference between a bullish and bearish candlestick?
Table of Contents
About Me

Krista Weber
After a career as a VP of UX and EdTech executive, I retired early—and quickly realized the traditional world of trading education is fundamentally broken.
As someone with a Master’s in HCI who specialized in the design of e-learning systems, I saw a massive gap: beginners aren't failing because trading is impossible; they’re failing due to massive cognitive overload and terrible instructional design.
This site bridges that gap. I’m applying the principles of learning science, systems thinking, and minimalist UX to strip away the market noise and teach trading the way it actually should be taught.
Stay in Touch
Some of the pages on my travel blog contain affiliate links. Whenever you buy something through one of these links, I get a small commission at no extra cost to you. As an affiliate, I only recommend products and services that I feel are high quality and helpful to my readers. Thanks for your support.
Read More

Open almost any trading platform and you'll see EUR/USD sitting next to XAU/USD, NQ, ES, and a dozen CFDs on stocks you've heard of. They all show up as candlesticks moving left to right, which quietly implies they're all the same kind of thing. They aren't. Before going deeper into any one of them, it's worth drawing the map.
Updated on Sep 6, 2026

Futures are standardized contracts tied to defined specifications and a future settlement date. They can look complex at first, but the mechanics become much clearer once you know what the contract specification controls. Here's what you actually need to know.
Updated on Sep 6, 2026

CFDs appear everywhere in retail trading – but most new traders couldn't explain exactly what they are or why that matters. Here's a plain-language breakdown, including the parts that most introductions skip.
Updated on Sep 6, 2026