Chart Reading: Identify the Regime First, Then Pick Your Trades
Most chart reading education teaches you how to read one type of market. The real skill is recognizing when the market has changed its character and adjusting what you look for, and how you read it, accordingly.

Learning Path Stage 2: Reading Charts
Learning Level 6: Adaptation
The Environment Check
Every single market sits in one of three environmental states. If you don't identify that state before you click a single button, you are essentially trying to play tennis with a golf club.
The underlying environment changes which signals matter, which structural levels count, and whether your software should even be active. In professional trading, we call this the market regime.
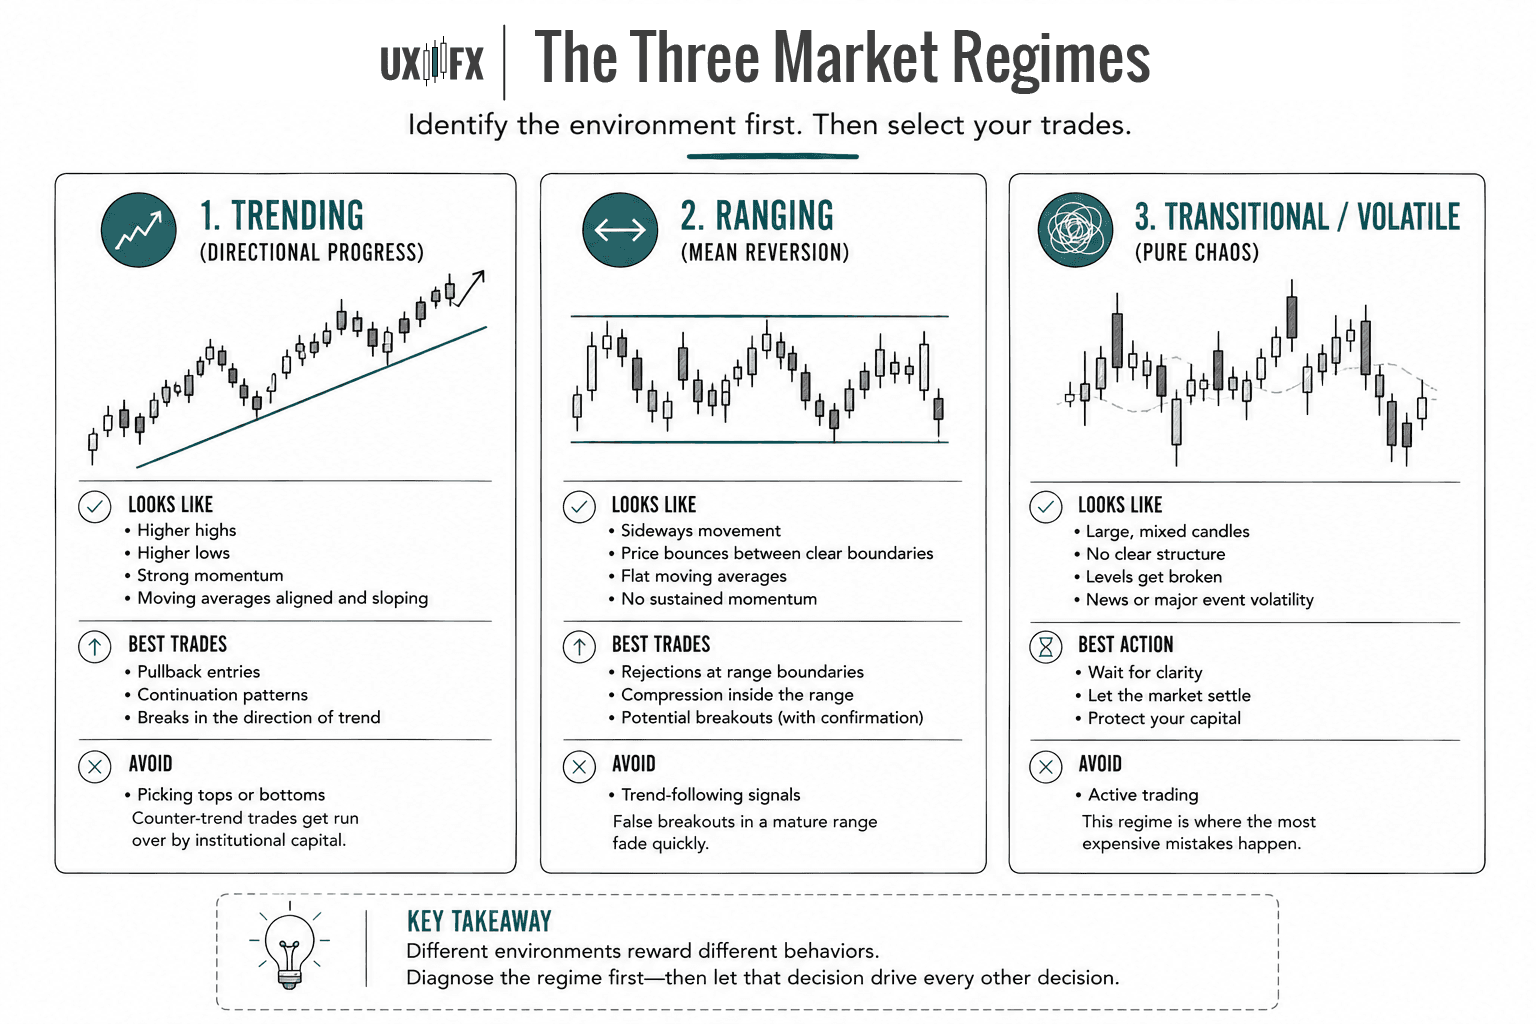
1. The Three Market Regimes
Think of market regimes as different operating systems. You can’t run an iOS app directly on a Windows machine; similarly, you can’t run a range-bound scalping strategy inside a runaway vertical trend.
Regime 1: Trending (Directional Progress)
Price is making steady, aggressive progress in a clear direction. Swings in the dominant direction are massive, while counter-swings look like tiny blips. Moving averages are beautifully aligned and sloping like a ski ramp. Each new high or low pushes meaningfully past the last one.
What to look for: Pullback entries, structural continuation patterns, and minor consolidations breaking in the direction of the macro trend.
What to avoid: Trying to pick tops or bottoms. Counter-trend trading here is a spectacular way to get run over by institutional capital.
Regime 2: Ranging (Mean Reversion)
Price is bouncing back and forth between two defined boundaries like a caffeinated ping-pong ball. Neither buyers nor sellers can sustain an ounce of momentum. Moving averages flatten out entirely, and price slices straight through them over and over again.
What to look for: Rejections at the strict range boundaries, and compression inside the range that might signal a breakout.
What to avoid: Trend-following signals. If you buy a breakout in a mature range before real volume shows up, the market will instantly fade you.
Regime 3: Transitional / Volatile (Pure Chaos)
Candlesticks are suddenly massive, mixed in direction, and the market structure looks like a broken wireframe. This usually happens after a major news release, a geopolitical event, or when the market is suffering from deep structural uncertainty. Moving averages become completely useless.
What to look for: Clarity. Close your platform, go make a coffee, and wait for the dust to settle.
What to avoid: Active trading. This regime is where the most expensive psychological mistakes cluster.
2. Designing an Adaptive Framework
A rigid trading approach uses the exact same signals and rules regardless of the market state. That produces highly erratic results because different regimes reward entirely different behaviors.
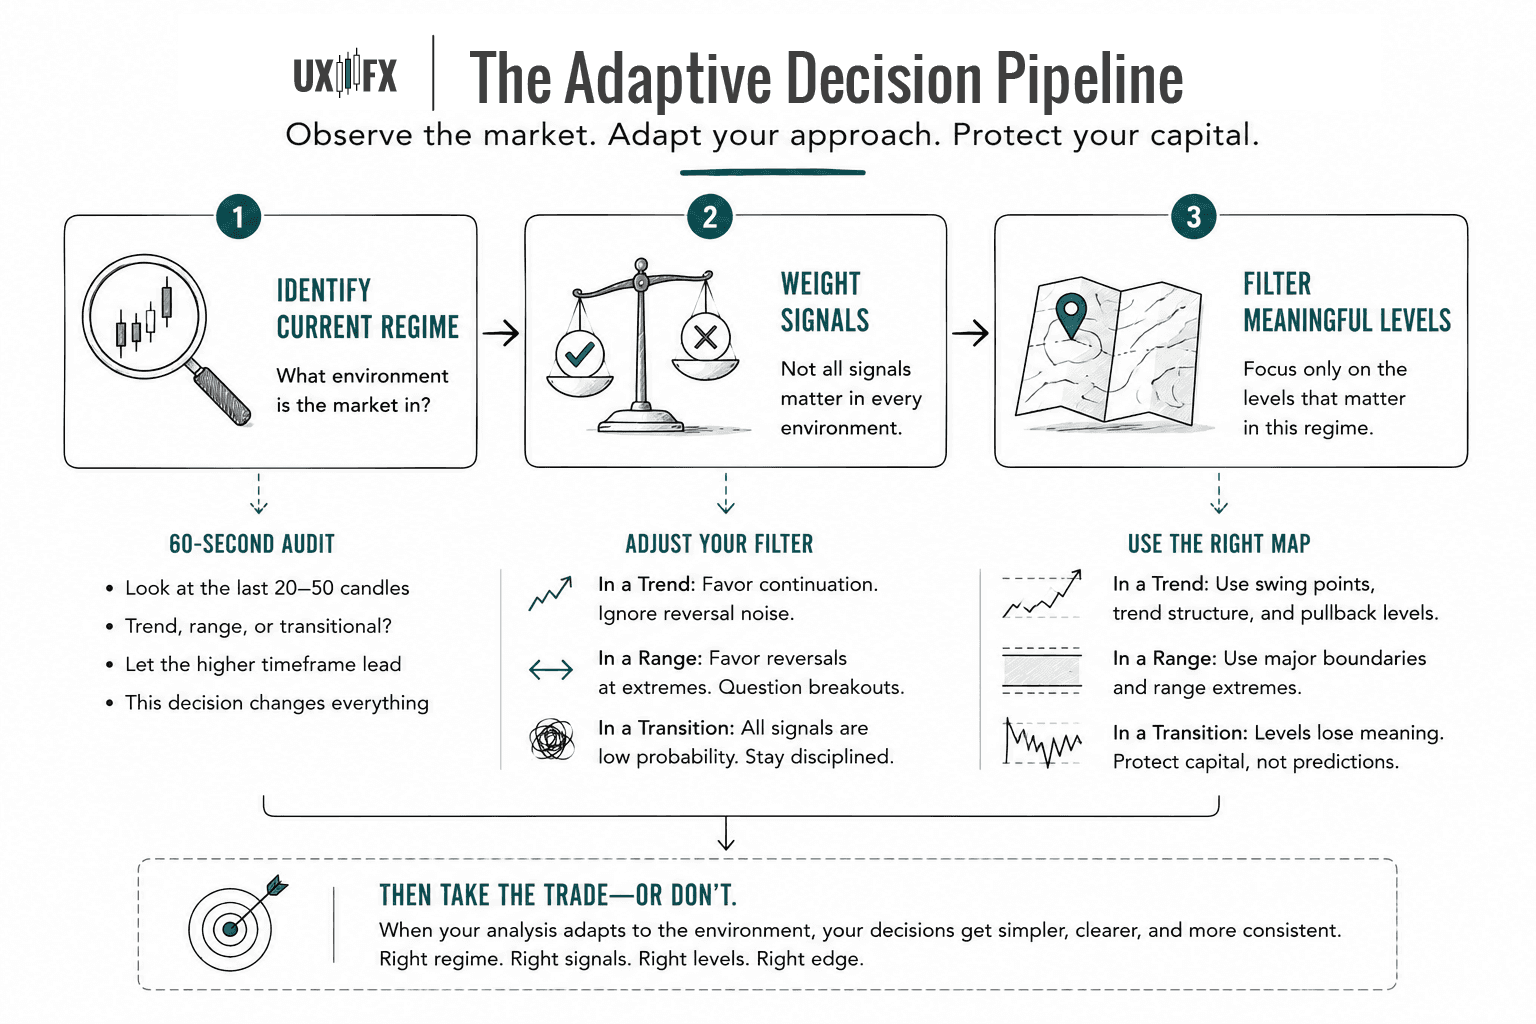
An engineered, adaptive framework requires a strict order of operations:
Step 1: The 60-Second Audit
Before hunting for a setup, look at the last 20 to 50 candles. Are the swings expanding in one direction (Trend)? Are they bouncing off the same horizontal floors and ceilings (Range)? Or has a recent data release turned the chart into a jagged mess (Transition)? This assessment takes one minute, but it changes your entire strategy.
Step 2: Weight Your Signals
In a Trend: Continuation signals are weighted heavily; reversal patterns are discarded as noise.
In a Range: Reversal signals at the extreme boundaries are weighted heavily; breakouts are treated with extreme suspicion.
In a Transition: All signals are weighted near zero. You are in a low-probability casino environment.
Step 3: Filter Your Levels
In a trend, the only levels that matter are the recent swing points where the trend validates its continuation. In a range, only the outer macro boundaries matter. Confusing the two is how beginners end up fighting a raging trend using a minor 5-minute support level that gets absorbed by institutions without a second thought.
3. Multi-Timeframe Regimes: The Matrix Effect
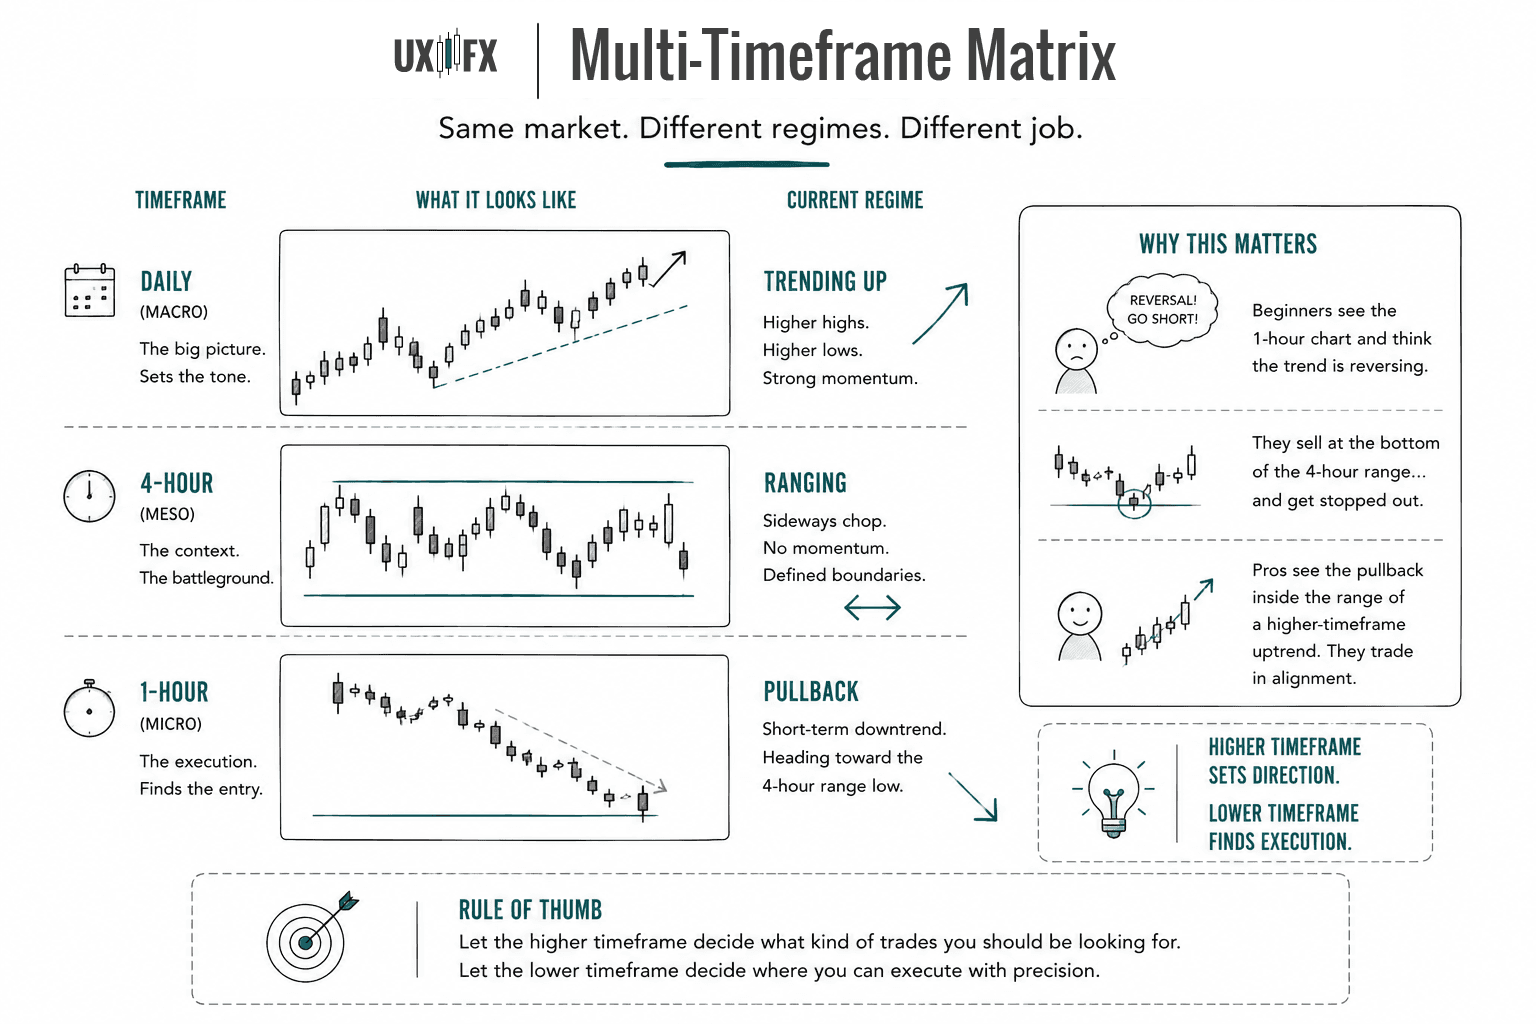
Here is the advanced layer that causes massive cognitive friction for intermediate traders: The regime on your execution chart can be completely different from the regime on your macro chart.
The Multi-Timeframe Breakdown
Daily Chart: Clear, beautiful uptrend (Macro Regime = Trending Up).
4-Hour Chart: Horizontal chop (The daily trend is pausing to consolidate into a Range).
1-Hour Chart: Short-term downtrend heading toward the bottom of that 4-hour range.
The beginner looks at the 1-hour chart, panics, and screams, "The market is reversing! Going short!" They treat a short-term intraday pullback as a macro trend reversal, sell at the exact bottom of the 4-hour range, and get instantly obliterated when the Daily trend wakes up and resumes its upward path.
The regime on your higher timeframe tells you what kind of trade your lower timeframe signal is actually supporting.
4. The Edge of Doing Absolutely Nothing
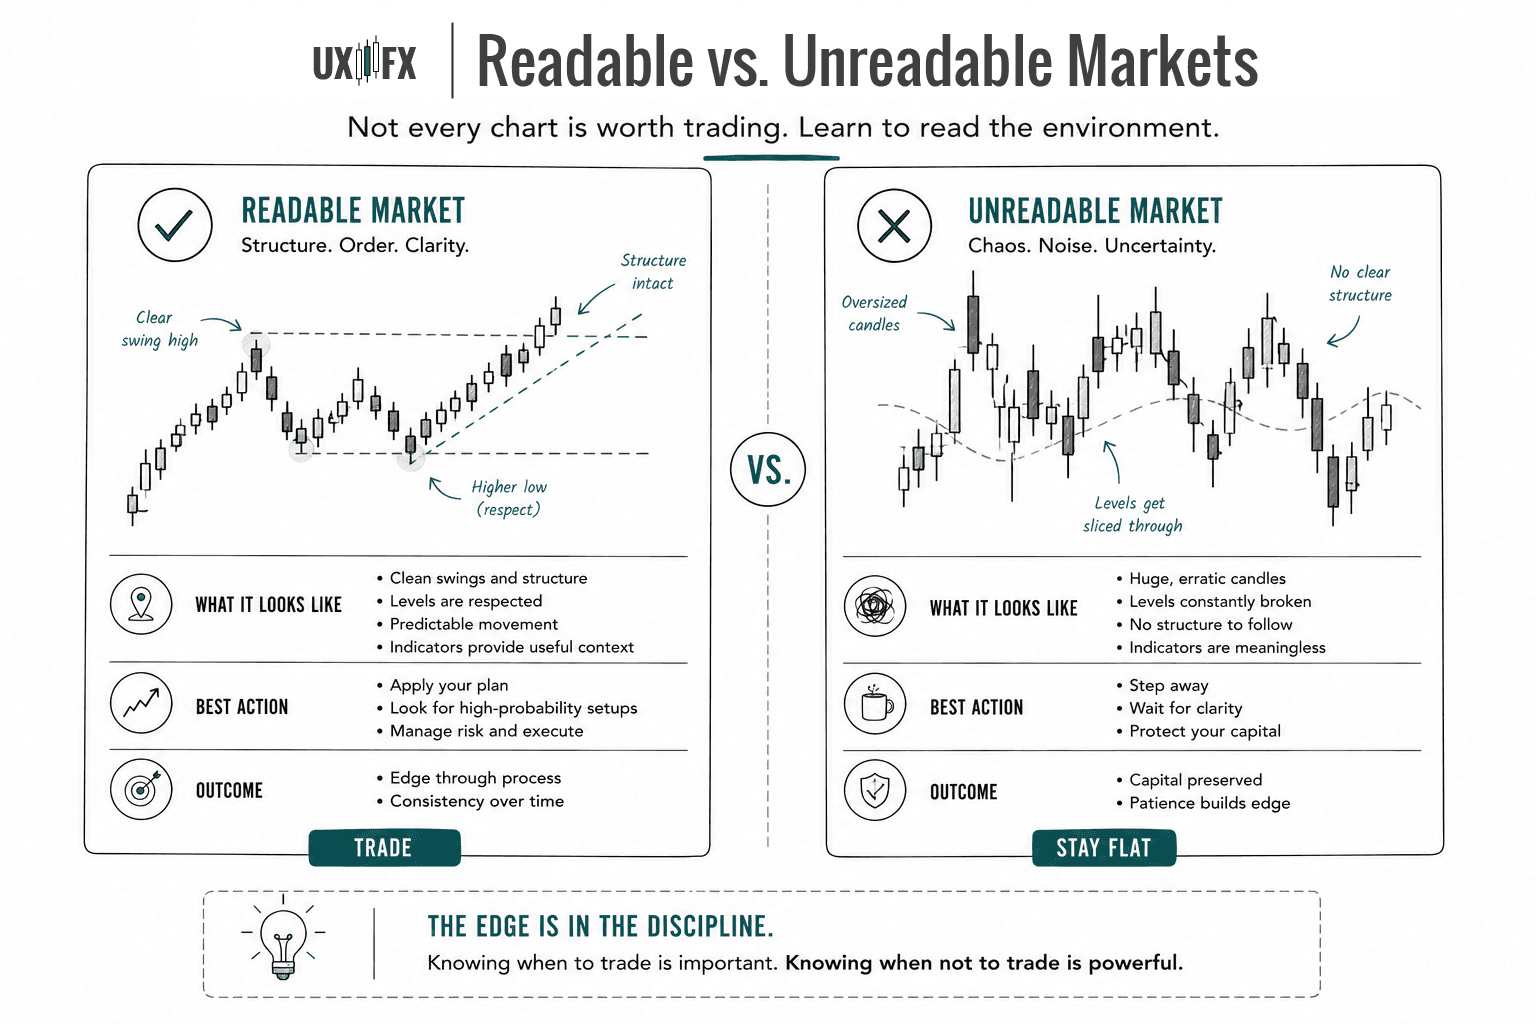
One of the definitive markers of a mature trader is the ability to diagnose a chart as completely unreadable and respond by staying entirely flat.
If you open TradingView and see that the recent candles are three times larger than the moving average, the previous clean levels are being sliced through like hot butter, and the structure is tangled, your technical analysis is dead.
The correct structural read here is: "I have no idea what this asset is doing."
Sitting on your hands feels like a missed opportunity, which hurts the ego. But transitional markets destroy more retail accounts than bad math ever could. Admitting a chart is currently unreadable, and closing the laptop, is a massive statistical edge.
5. The 5-Minute Pre-Session Habit
Regime awareness isn't a superpower you are born with; it’s a form of visual pattern recognition built through deliberate observation.
To fast-track this skill, force yourself to complete this simple text log before you look for a single trade entry:
"Daily context: Uptrend intact. 4-Hour context: Ranging at previous resistance. Plan: Remain flat until price sweeps the 4-hour range low, or cleanly breaks above resistance with high volume."
Do not let your brain hunt for setups until that macro assessment is written down. Over a few months, this protocol becomes entirely automatic. You will open a chart, and the regime will read itself—not because you memorized a textbook layout, but because you’ve trained your brain to read the market's current operating system before trying to run your plays.

FAQ's
Q: How do I know when the regime has changed?
Q: Can the same chart pattern mean different things in different regimes?
Q: What is a market regime and why does it matter for chart reading?
Table of Contents
About Me

Krista Weber
After a career as a VP of UX and EdTech executive, I retired early—and quickly realized the traditional world of trading education is fundamentally broken.
As someone with a Master’s in HCI who specialized in the design of e-learning systems, I saw a massive gap: beginners aren't failing because trading is impossible; they’re failing due to massive cognitive overload and terrible instructional design.
This site bridges that gap. I’m applying the principles of learning science, systems thinking, and minimalist UX to strip away the market noise and teach trading the way it actually should be taught.
Stay in Touch
Some of the pages on my travel blog contain affiliate links. Whenever you buy something through one of these links, I get a small commission at no extra cost to you. As an affiliate, I only recommend products and services that I feel are high quality and helpful to my readers. Thanks for your support.
Read More

Trend following has the best-documented body of public knowledge of any trading approach. The resources below represent decades of practitioner wisdom. Many of them are freely available and more rigorous than anything in the paid course market.
Updated on Jun 28, 2026

Trend following has been around longer than modern financial markets. Understanding why it persists, despite being psychologically uncomfortable to execute, reveals something important about what actually produces trading edge over time.
Updated on Jun 28, 2026

Higher highs and higher lows sounds simple. The mechanics of actually trading it — entries, stops, trailing, and exits — are where the work lives.
Updated on Jun 26, 2026