Developing a Personal Chart Reading Framework
At some point, applying someone else's chart reading framework starts to feel like wearing someone else's prescription glasses. Developing your own — built from tools that suit your perception and trading style — is how chart reading becomes genuinely fluent.

Learning Path Stage 2: Reading Charts
Learning Level 6: Adaptation
Owning the System vs. Renting It
Following a defined trading system is a fantastic starting point. It gives you structure, cuts down on arbitrary mid-session panic, and lets you collect data that doesn’t look like a crime scene.
But as you clear the beginner phase, a second transition happens: moving from simply following a framework to actually owning it.
The difference comes down to whether you understand the underlying user behavior of your tools well enough to know when to apply them, when to skip them, and how to adapt them when the market shifts.
A trader who follows rules without understanding the logic beneath them will either apply them with rigid, algorithmic compliance (even in a market regime where they completely fail) or abandon them the second they hit a drawdown. There is zero conviction underneath the compliance.
Here is the 5-stage engineering process to move your chart reading from a borrowed methodology to a proprietary framework that matches how your brain processes data.
Stage 1: Auditing Your Design Assets
Before you can assemble a personal framework, you need a deep, working knowledge of your building blocks. In technical analysis, your tools generally fall into four design categories:
Tool Category | What It Measures | Examples |
Structure Tools | The skeletal logic of price. | Swing highs/lows, break of structure (BOS), change of character (CHoCH), market phases. |
Level Tools | The spatial grid where price is likely to react. | Support & resistance, supply/demand zones, higher-timeframe order blocks. |
Signal Tools | The precise micro-timing mechanisms. | Candlestick prints, structural chart patterns, momentum exhaustion. |
Context Tools | The macro environmental variables. | Session awareness (Asia vs. London vs. NY), economic calendar releases, volatility regimes. |
The Reality Check: You do not need to master all of these. In fact, if your chart looks like a Jackson Pollock painting covered in neon indicators, you are burning glucose trying to solve a cognitive load crisis. You need just enough depth in a select few that you can explain why each one works—meaning, the exact human behavior it captures, not just what it looks like on a canvas.
Stage 2: The 4-Week User Analytics Audit
Most traders suffer from a massive gap between their stated approach and their actual approach. They design a theoretical methodology in their journal that looks beautiful, but under real-time session stress, their actual execution looks like a chaotic free-for-all.
To build an authentic framework, you need real user data on yourself:
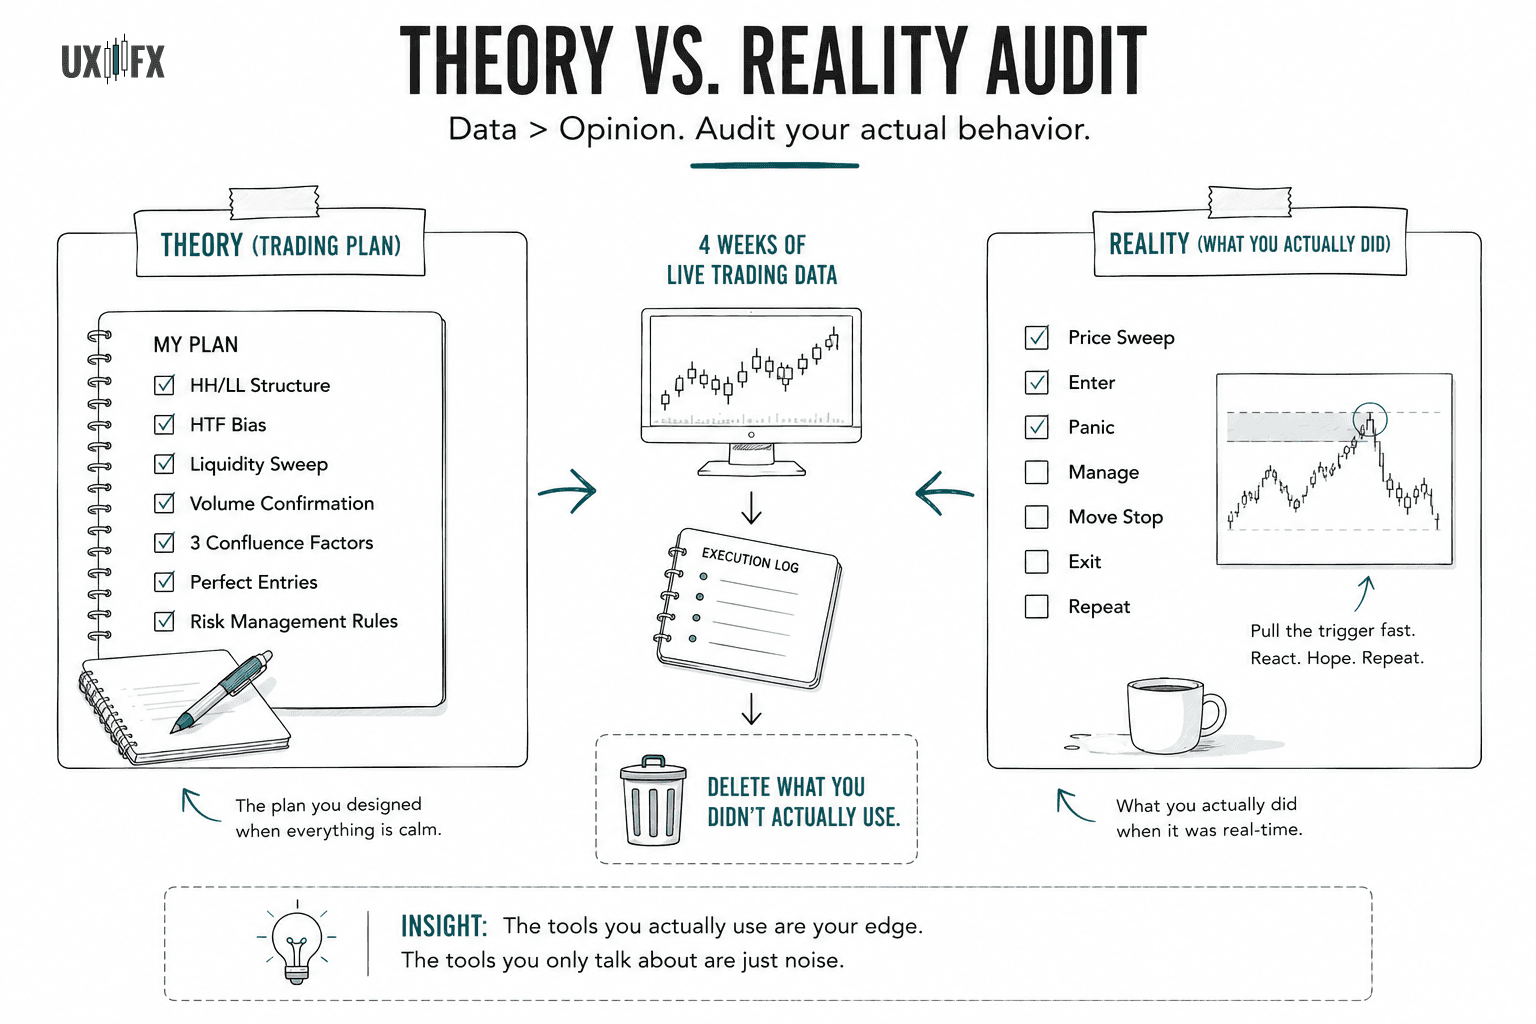
For the next four weeks, track your live analysis. After every single session, note which tools you actually referenced to make a decision. These are the ones your hand reached for, not the ones listed in your idealized trading plan.
Do you say you require three confluence factors but consistently pull the trigger based on a single raw price sweep?
Do you claim to always anchor to the higher timeframe, but frequently skip it when the Nasdaq is moving fast?
The tools that consistently inform your real-time decisions are the core assets of your framework. The tools that appear only in your theory can be safely deleted. They are bloatware.
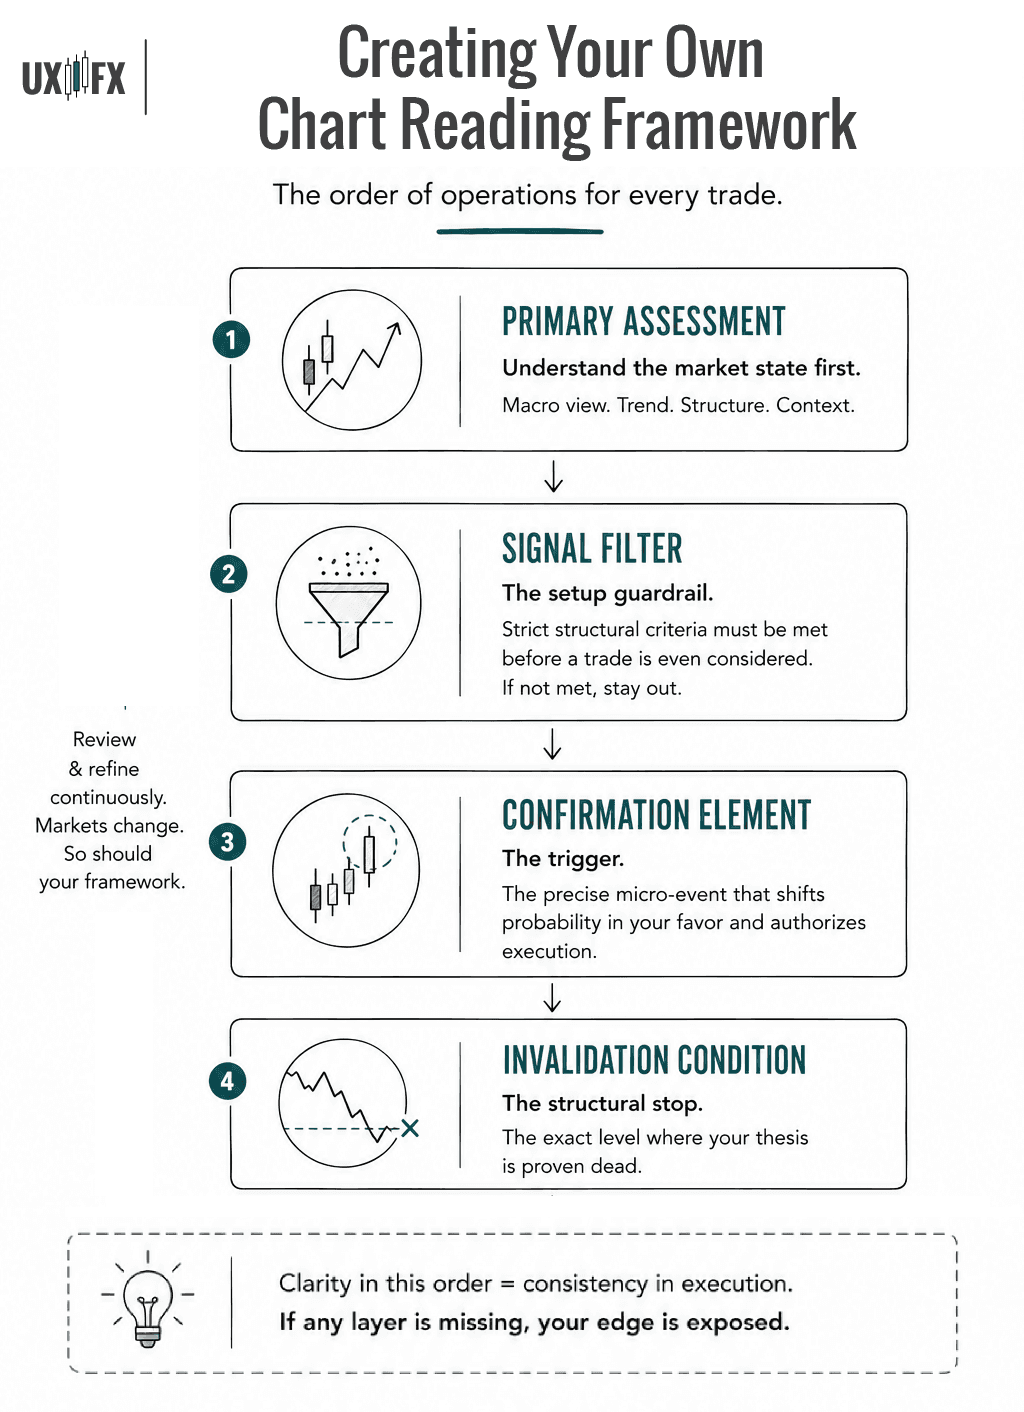
Stage 3: Wireframing the Core Framework
A high-precision, personal chart reading framework requires three to four distinct visual layers. Think of this as the order of operations for your interface:
1. Primary Assessment (The Macro View)
What you look at first to understand the market state. For structure-oriented traders, this is the current trend phase. For level-oriented traders, this is mapping the major daily premium/discount zones.
2. Signal Filter (The Setup Guardrail)
The strict structural criteria required before a trade is even considered valid. For example: Price must sweep a session high/low, followed by an immediate displacement candle back into the range. If this filter isn't met, you remain a passive observer.
3. Confirmation Element (The Trigger)
The precise micro-event that shifts probability enough to authorize execution. This could be a specific candle close, a high-volume rejection wick, or a multi-timeframe refinement level.
4. Invalidation Condition (The Structural Stop)
The exact price level where your behavioral thesis is proven dead. This is defined before entry, never negotiated during a loss.
These four elements create a system that is specific enough to maintain tight consistency, yet flexible enough to handle the market's natural wiggles.
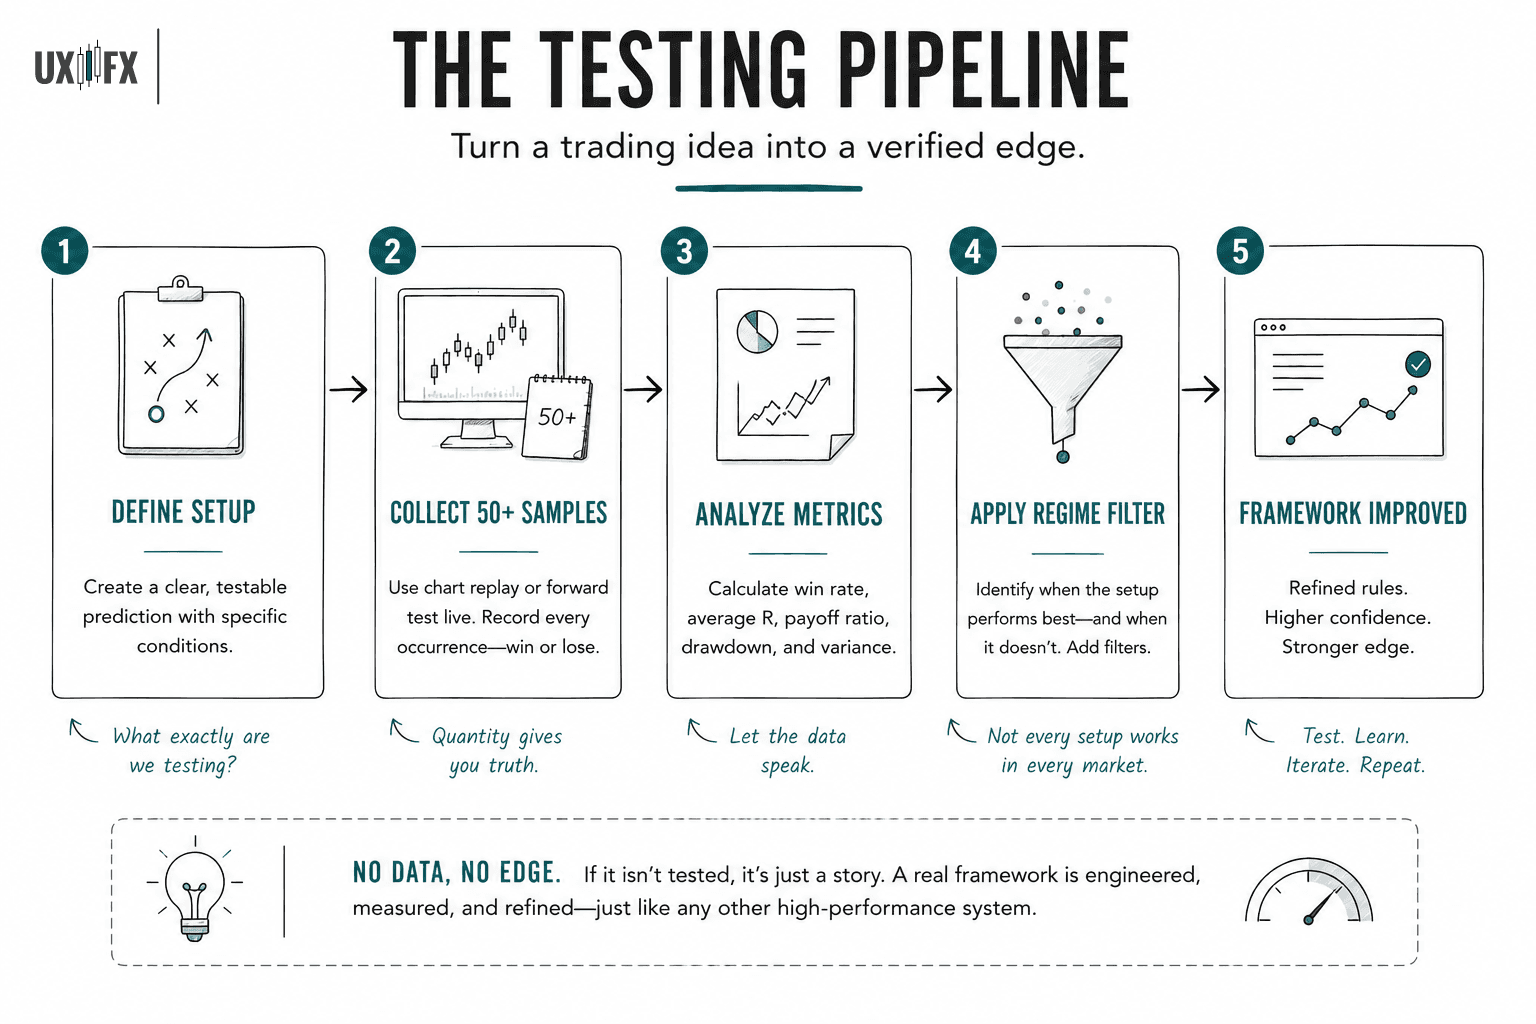
Stage 4: Stress-Testing the Prototype
A framework that hasn't been tested is an emotional hypothesis, not a trading methodology. To move a setup from "something you hope works" to "something you have verified," you must run a strict optimization cycle:
Define the Prediction: It must be a binary, testable statement. "My framework suggests a high-probability short when price sweeps an Asia Session High during London morning liquidity, prints a 5-minute rejection wick, and the hourly market structure is bearish."
Collect 50 Samples: Use chart replay or forward-test live sessions. Record every single instance where those exact conditions were met—regardless of whether you took the trade or got cold feet.
Analyze the Raw Metrics: What is the actual win rate? What is the average R-multiple on winners versus losers? Are there specific days or session times where performance completely falls off a cliff?
If the data shows your setup chokes during low-volume ranging markets, you build a regime filter to turn the system off during those hours. Congratulations: you just converted an opinion into an edge.
Stage 5: Managing the Lifecycle
A personal framework is never a finished monument; it is a living, breathing software application. Markets evolve, volatility regimes expand and contract, and your own screen-time deepens.
Review Quarterly: Audit your metrics every 90 days. Is each individual component still earning its keep, or are you experiencing feature creep?
Investigate Anomalies: If you repeatedly notice a specific structural phenomenon over months of trading, don't just trade it on a whim. Move it to the test environment first.
Deprecate Underperformers: When a component consistently underperforms or adds unnecessary cognitive load without improving your R-multiple, remove it from the code.
The Signature of a Mature Framework
You will know your framework has successfully transitioned from a "borrowed system" to a "proprietary asset" when you hit the following milestones:
The 200-Word Constraint: You can describe your entire execution criteria in writing in under 200 words, completely and specifically.
The Developer Test: Someone else reading your written documentation could look at a raw chart and make the exact same decision you would, with zero ambiguity.
The Zero-Curiosity Shift: You stop scrolling social media looking at other traders' setups as potential replacements for your own. Instead, you look at them with pure analytical curiosity as potential refinements to an edge you already own.
The market does not reward compliance with someone else's rulebook. It rewards the unwavering consistency that can only come from executing a framework your own brain engineered. Stop renting your strategy; build one you actually own.
FAQ's
Q: How do I know which chart reading tools suit my perception specifically?
Q: How do I test whether my framework is actually working?
Q: Isn't it better to stick to one established approach rather than creating my own?
Table of Contents
About Me

Krista Weber
After a career as a VP of UX and EdTech executive, I retired early—and quickly realized the traditional world of trading education is fundamentally broken.
As someone with a Master’s in HCI who specialized in the design of e-learning systems, I saw a massive gap: beginners aren't failing because trading is impossible; they’re failing due to massive cognitive overload and terrible instructional design.
This site bridges that gap. I’m applying the principles of learning science, systems thinking, and minimalist UX to strip away the market noise and teach trading the way it actually should be taught.
Stay in Touch
Some of the pages on my travel blog contain affiliate links. Whenever you buy something through one of these links, I get a small commission at no extra cost to you. As an affiliate, I only recommend products and services that I feel are high quality and helpful to my readers. Thanks for your support.
Read More

Trend following has the best-documented body of public knowledge of any trading approach. The resources below represent decades of practitioner wisdom. Many of them are freely available and more rigorous than anything in the paid course market.
Updated on Jun 28, 2026

Trend following has been around longer than modern financial markets. Understanding why it persists, despite being psychologically uncomfortable to execute, reveals something important about what actually produces trading edge over time.
Updated on Jun 28, 2026

Higher highs and higher lows sounds simple. The mechanics of actually trading it — entries, stops, trailing, and exits — are where the work lives.
Updated on Jun 26, 2026