Support and Resistance for Beginners
Support and resistance are often taught as lines on a chart, but they’re really about behavior. This beginner-friendly guide explains how traders use key price levels to understand crowd psychology, reduce cognitive overload, and make more structured decisions in the market. Without treating charts like financial astrology.

Learning Path Stage 2: Reading Charts
Learning Level 1: Recognition
Primary Learning Objective
By the end of this lesson, you will be able to identify the candlestick patterns with genuine utility and explain what makes them more reliable than the broader catalog of named patterns.
One of the first things you notice when you start learning how to trade is that your software charts begin accumulating lines remarkably quickly. You see horizontal lines, diagonal trendlines, colored boxes, regression channels, and complex Fibonacci ratios stretching across the screen like someone opened a box of laser levels and decided to turn them on all at once. At first, the concepts of support and resistance can feel like they belong to that exact same overwhelming category …just more arbitrary drawings that internet traders sketch onto a canvas while speaking with highly suspicious levels of confidence.
But if you strip away the confusing terminology, the underlying reality is incredibly simple. Support and resistance are just structural areas where market participant behavior has historically tended to change. That is the entire definition. They are not magical price barriers, they are not invisible force fields, and they are certainly not proof that institutional traders secretly discovered sacred financial geometry in bowl of Cheerios this morning. They are simply zones where buyers and sellers once reacted strongly enough to alter the path of price. Once you start thinking about these areas behaviorally instead of mechanically, the chart becomes much easier to organize mentally.
What Support and Resistance Are Actually Showing You
At a basic level, support and resistance are areas where the market previously struggled to continue moving.
Support is an area where price stopped falling and started moving upward.
Resistance is an area where price stopped rising and started moving downward.
But the important part is why that happens. These levels matter because traders remember them. Humans are pattern-recognition machines. Our brains constantly look for reference points, especially in uncertain environments. Markets are full of people making emotional decisions under pressure, which means prior reactions often influence future behavior.
If price reversed aggressively from a certain area before, traders notice that. How they react though? That's where things can get dicey:
Some expect the same reaction again.
Some place orders there.
Some exit trades there.
Some regret missing the move the first time and wait for price to return.
Some cry quietly over their keyboards.
All of that creates participation. And participation is what moves markets. This is why support and resistance are less about “lines” and more about zones where collective attention increases.
The 3-Step "Squint Test" for Finding Levels
To translate this crowd psychology into actual coordination points on your screen without overwhelming your brain, you can utilize a highly practical, three-step blueprint designed to keep your cognitive load low.
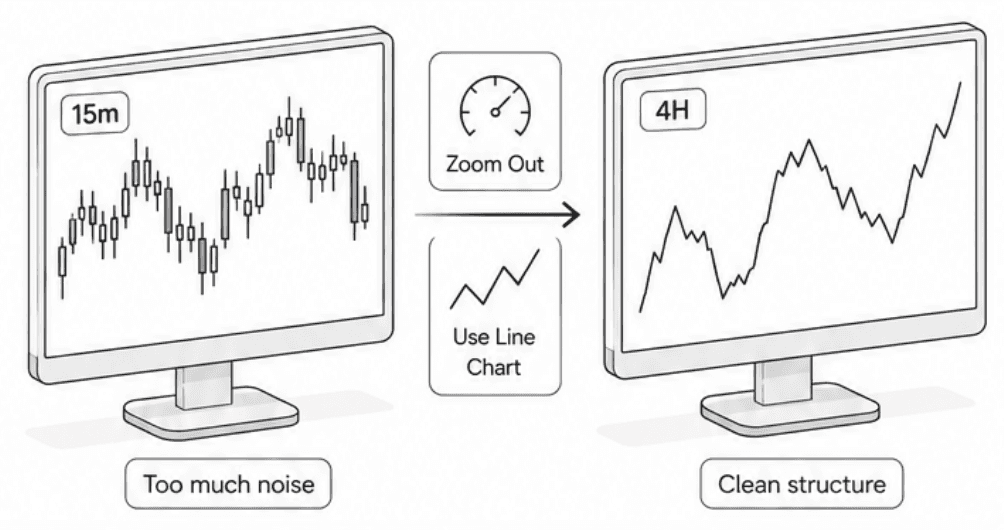
Step 1: Zoom Out and Change the Frame
Before you draw a single line, change your charting platform from an intraday frame (like the 5-minute or 15-minute chart) up to a macro timeframe, like the 1-Hour or 4-Hour chart. Zooming out automatically filters out the short-term market noise, exposing the true structural backbone of the price action. If you are still struggling to see the clean boundaries through the jagged candlestick wicks, temporarily switch your platform layout from Candles to a Line Chart. This completely strips away the daily volatility and leaves you with an incredibly clean map of where price actually managed to close.
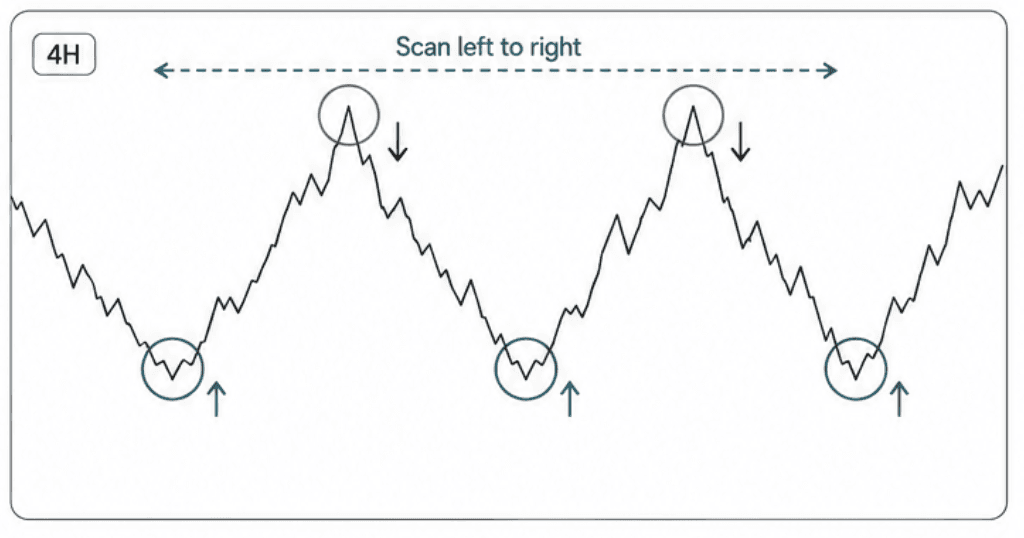
Step 2: Hunt for the V-Shapes (The Squint Test)
Squint your eyes slightly and scan the chart canvas from left to right. You are hunting for sharp, completely obvious structural turning points—places where price was traveling aggressively in one direction, suddenly hit an invisible wall, and immediately reversed into a sharp "V" or inverted "V" shape.
A sharp drop followed by an immediate rocket ship upward leaves a permanent Support footprint.
A massive rally followed by an immediate elevator drop downward leaves a permanent Resistance footprint.
Step 3: Draw a Zone, Not a Line
Once your eyes lock onto a major historical turning point, avoid using the single, razor-thin horizontal line tool. Instead, select the Rectangle Tool inside TradingView. Draw a horizontal box that comfortably captures both the dense cluster of candle bodies where the reversal took place and the extreme tips of the longest wicks in that immediate turning point.
Extend that rectangle forward all the way to the right side of your screen. You now have a high-probability boundary zone mapped out—a predictable pocket of market friction where you can naturally expect the auction to hesitate or aggressively react the next time live price wanders into it.

Why Beginners Struggle With This Concept
I think one reason support and resistance initially feels confusing is because most examples online make it look far more precise than it really is. You’ll often see charts where someone drew a perfectly straight line touching three exact candle wicks while explaining the market with the confidence of an architect reviewing structural blueprints.
Real charts are messier than that. Price rarely respects a level down to the exact pip or tick. Markets are made of human behavior, not laser alignment systems. Support and resistance work more like areas of interest than exact coordinates.
It's a little messy, which can actually help alleviate some psychological pressure. Often newer traders often assume if price touched the line and went through it slightly, the level failed. Not necessarily. Because:
Sometimes price overshoots.
Sometimes it briefly breaks through and reverses.
Sometimes it reacts slightly before the level.
Sometimes the market behaves like it drank too much coffee before the open.
This is why experienced traders usually think in zones rather than single lines. The market is interpreting value dynamically, not snapping to a perfectly straight line in on the chart. It's slightly less surgical and precise than that.
Support and Resistance Are Really About Memory
One thing I find interesting is how much support and resistance resemble user behavior in UX. If users struggle at a certain step in a product purchase flow, future users often struggle there too. That friction point becomes predictable because human behavior tends to repeat under similar conditions. And because there is usually a reason it's hard to do that particular step. While it might be a confusing interaction in an interface, in the market it could be something like a psychological level, such as oil hitting $100 a barrel prior to the US going to war with Iran.
Markets work similarly.
A support level is essentially an area where buyers previously became aggressive enough to overpower sellers.
A resistance level is where sellers previously pushed back hard enough to stop upward movement.
Those reactions create memory.
And markets are constantly responding to memory. But remember this is probably not happening perfectly, or consistently. However it is happening enough that traders pay attention. .
That’s really what support and resistance are about. Areas where participation previously shifted in a meaningful way.
Why These Levels Matter Psychologically
Support and resistance are important because they help traders frame decisions. Without structure, charts become overwhelming very quickly. There’s too much movement, too much noise, and too many possible interpretations happening at once.
Support and resistance reduce cognitive load. They give you reference points. Instead of staring at random price movement wondering what matters, you begin asking more structured questions:
Is price reacting near an important area?
Is momentum slowing down?
Is the market rejecting this level or accepting it?
Are buyers or sellers losing control?
That’s a much calmer and more useful way to think about charts. You’re no longer reacting emotionally to every candle. You’re observing behavior around important locations.
The First Mistake Most People Make
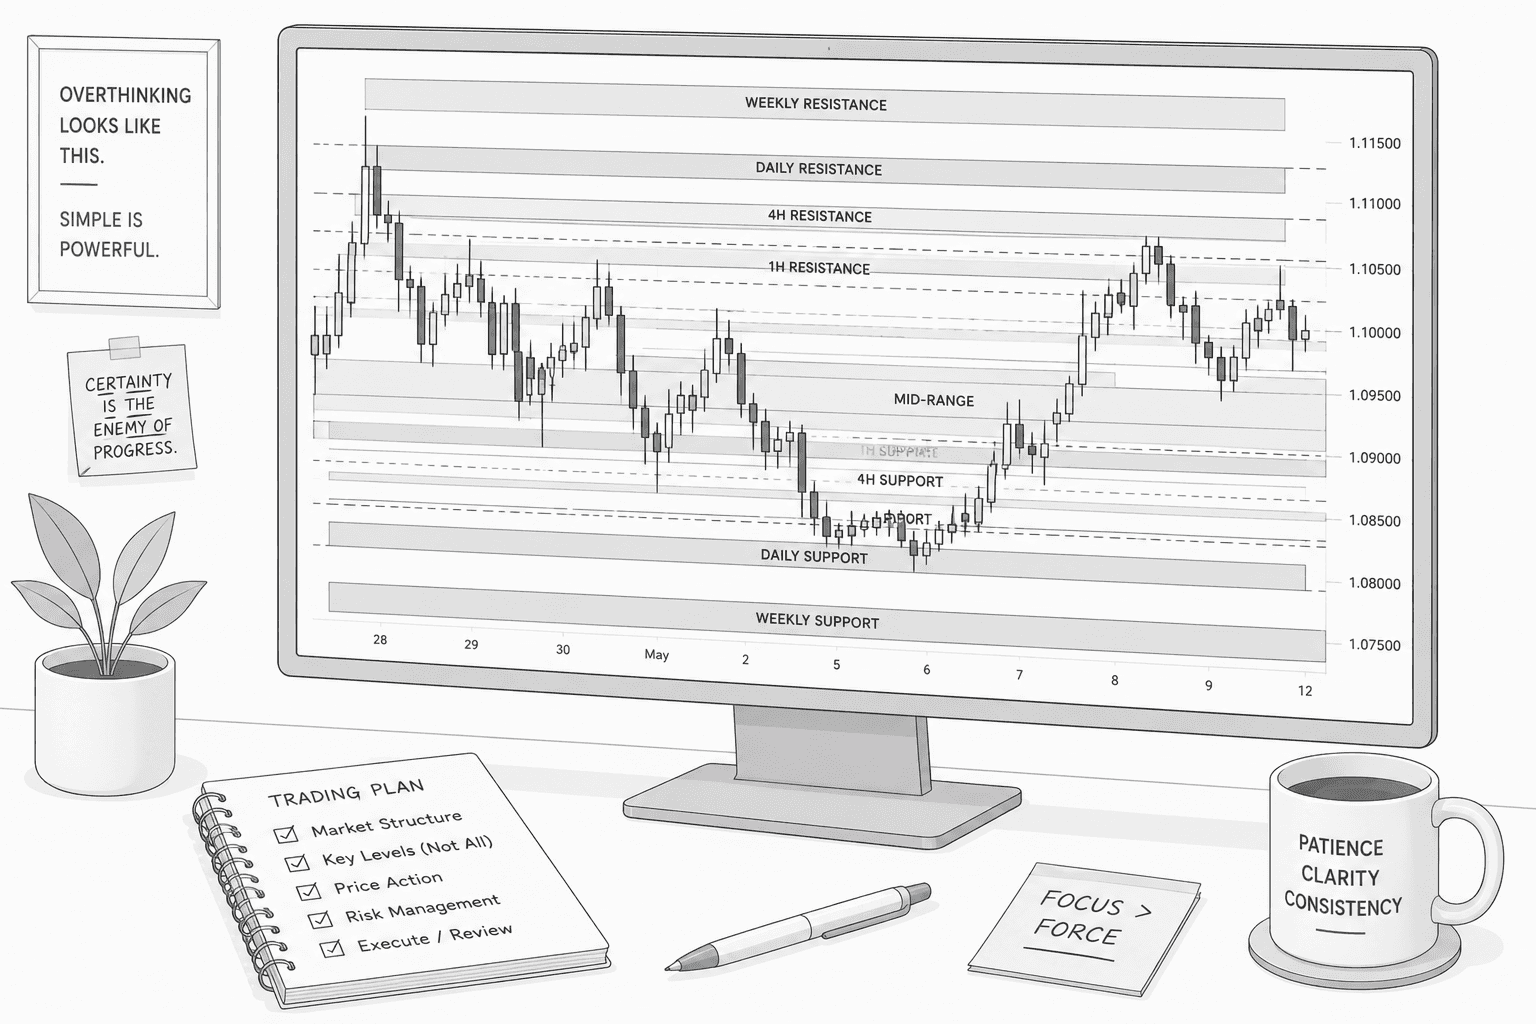
Most beginners immediately try to draw too many levels. Every swing high becomes resistance. Every tiny bounce becomes support. Eventually the chart looks less like market analysis and more like someone attempted to trap the candles inside a prison of horizontal lines.
This usually happens because newer traders are trying to create certainty. More levels feel safer. More information feels smarter. But in practice, too many levels can cause analysis paralysis and make decision-making worse.
A cleaner chart is usually easier to interpret.
Personally, I’ve found it much more useful to focus on major reactions first. Large swing highs. Large swing lows. Obvious turning points where price reacted aggressively. If you have to squint at the chart, rotate your laptop slightly, and convince yourself the level “basically counts,” it probably isn’t significant enough to matter yet. The stronger levels are usually fairly obvious.
Support and Resistance Are Not Predictions
This is another important mindset shift. A support level does not guarantee price will bounce. A resistance level does not guarantee price will reverse. These areas are not promises. They are locations where reactions become more likely.
That distinction matters because trading is probabilistic, not deterministic. Beginners often approach support and resistance with the idea that price hit support so it's time to buy. More experienced traders usually think more conditionally: Price is approaching an important area. Let’s see how participants respond.
That’s a very different mental framework. You’re observing behavior first, not forcing certainty onto the chart—as that does not usually go your way.
Breakouts, Failures, and Trapped Traders
One reason support and resistance become so interesting over time is that they also reveal emotional behavior. For example, imagine price repeatedly fails to move above a resistance area. Eventually traders begin expecting rejection there. Then suddenly price breaks through aggressively.
What happens?
Some traders rush to buy.
Some traders who were short are forced to exit.
Some traders waiting for confirmation jump in late.
Participation shifts quickly. The market waits for no one.
The opposite happens too. Sometimes price appears to break a level, pulls traders into the move, and then immediately reverses back the other direction. This is what traders call a fakeout. And unfortunately, fakeouts are a very human phenomenon. Markets constantly exploit emotional certainty. That’s one reason trading feels psychologically difficult. The market is essentially a live environment of competing expectations, fear, greed, hesitation, impatience, and reaction. Candles are just the visual record of all of it.
A Simpler Way to Practice This
If you’re brand new, don’t worry about trading support and resistance yet. Just practice observing. Open a chart in TradingView and scroll backward. Look for areas where price reacted strongly multiple times.
Notice:
where momentum slowed down
where reversals happened
where price repeatedly struggled
where breakouts accelerated
Then ask yourself, “What changed here?” That question is far more valuable than memorizing dozens of technical definitions. Because support and resistance are ultimately about behavior. The lines themselves are not the point. The reactions are.
Closing Thought
Support and resistance are often taught like technical drawing exercises. But underneath the lines, they are really showing something much more human. They are showing memory, hesitation, agreement, disagreement, and shifts in participation.They are areas where traders collectively decided something mattered.
And once you start viewing charts that way, technical analysis becomes much less mysterious. You stop seeing candles as random movement. And start seeing them as crowd behavior compressed into visual form.
Success Criteria
After completing this lesson, you should be able to identify doji, hammer, engulfing, and pin bar patterns in a live chart, explain what each suggests about the balance of pressure in that period, and apply context ( location, trend, key levels) to evaluate their significance.
Common Misconception
The more candlestick patterns you know, the better your trading will be.
The Truth: The set of genuinely useful patterns is small, and knowing twenty patterns is less valuable than understanding how four patterns behave across different market contexts.
FAQ's
Q: How do you identify support and resistance levels?
Q: Do support and resistance levels always hold?
Q: What is support and resistance in trading?
Table of Contents
About Me

Krista Weber
After a career as a VP of UX and EdTech executive, I retired early—and quickly realized the traditional world of trading education is fundamentally broken.
As someone with a Master’s in HCI who specialized in the design of e-learning systems, I saw a massive gap: beginners aren't failing because trading is impossible; they’re failing due to massive cognitive overload and terrible instructional design.
This site bridges that gap. I’m applying the principles of learning science, systems thinking, and minimalist UX to strip away the market noise and teach trading the way it actually should be taught.
Stay in Touch
Some of the pages on my travel blog contain affiliate links. Whenever you buy something through one of these links, I get a small commission at no extra cost to you. As an affiliate, I only recommend products and services that I feel are high quality and helpful to my readers. Thanks for your support.
Read More

Breakout trading is the practice of entering a position the moment price moves beyond a defined level of support or resistance. It sounds simple, and it is, in structure. The challenge is that most breakouts are false.
Updated on Jun 12, 2026

Why matching a strategy to your cognitive style matters more than finding the 'best' one.
Updated on Apr 27, 2026

Before exploring individual strategies, it's worth asking a more fundamental question: what actually counts as a trading strategy? The answer shapes everything.
Updated on Apr 27, 2026