
What Buyers and Sellers Are Actually Doing at Support
Support isn’t a magical, invisible forcefield that price respects out of politeness. It’s a messy psychological battleground. Specifically, it’s a price area where, historically, enough buyers have shown up with their wallets open to halt a downward slide. Once you learn to identify who these buyers are and track their behavior, support stops being something you blindly hope holds and becomes something you can actually read

Learning Path Stage 2: Reading Charts
Learning Level 2: Understanding
Primary Learning Objective
By the end of this article, you should be able to deconstruct a support level from a structural supply-and-demand perspective (rather than viewing it as a static line on a chart(allowing them to objectively read candle behaviors to determine whether a support zone is likely to hold or fail.
Support isn’t a magical, invisible forcefield that price respects out of politeness. It’s a messy psychological battleground. Specifically, it’s a price area where, historically, enough buyers have shown up with their wallets open to halt a downward slide.
Once you learn to identify who these buyers are and track their behavior, support stops being something you blindly hope holds and becomes something you can actually read.
What Support Actually Is
Buyers don’t just manifest at a specific price level because a chartist drew a pretty line. They show up because they have a financial motive. Meet the five regulars at the support party:
The Bagholders & Winners (Prior Lows): Traders who bought the exact last time price was here. They are either desperately defending their break-even point or eagerly adding to a winning position.
The Automated Waitlist (Unfilled Limit Orders): Pre-placed buy orders sitting below the current price, patiently waiting to get filled the second price takes a dip.
The Panicking Shorts (Stop Losses): Short sellers who got in way higher have their emergency exit stops sitting below them. When price hits these stops, it triggers automatic market orders to buy and cover the short.
The Skeptics (Technical Traders): They saw the level days ago, but they aren’t touching it until they get concrete confirmation.
The Value Hunters (Fundamental Buyers): Longer-term players who couldn't care less about your squiggly chart lines. They just think the asset is fundamentally cheap at this price.
When price slams into a support level, all five groups wake up at the exact same time. Their combined buying power acts as a wall against the sellers.
Why Price Has Creepy Nostalgia
New traders always ask: Why does the market remember a random price level from three months ago?
It’s not magic; it's literal memory and a bit of FOMO.
The Mechanics of Market Memory: Some traders are still trapped in the same positions from last month, protecting their stops. Others missed out on the initial move and have been kicking themselves ever since, waiting for a second chance to enter. Meanwhile, algorithmic trading scripts—programmed to flag historically significant zones—automatically fire off buy orders the millisecond price checks back in.
Essentially, "memory" is just a mix of institutional algorithms doing exactly what they were programmed to do, and human beings looking at the exact same historical data and drawing the exact same line. The more a level gets tested, the more eyes look at it, and the more crowded that support party gets.
Reading Support Candle by Candle
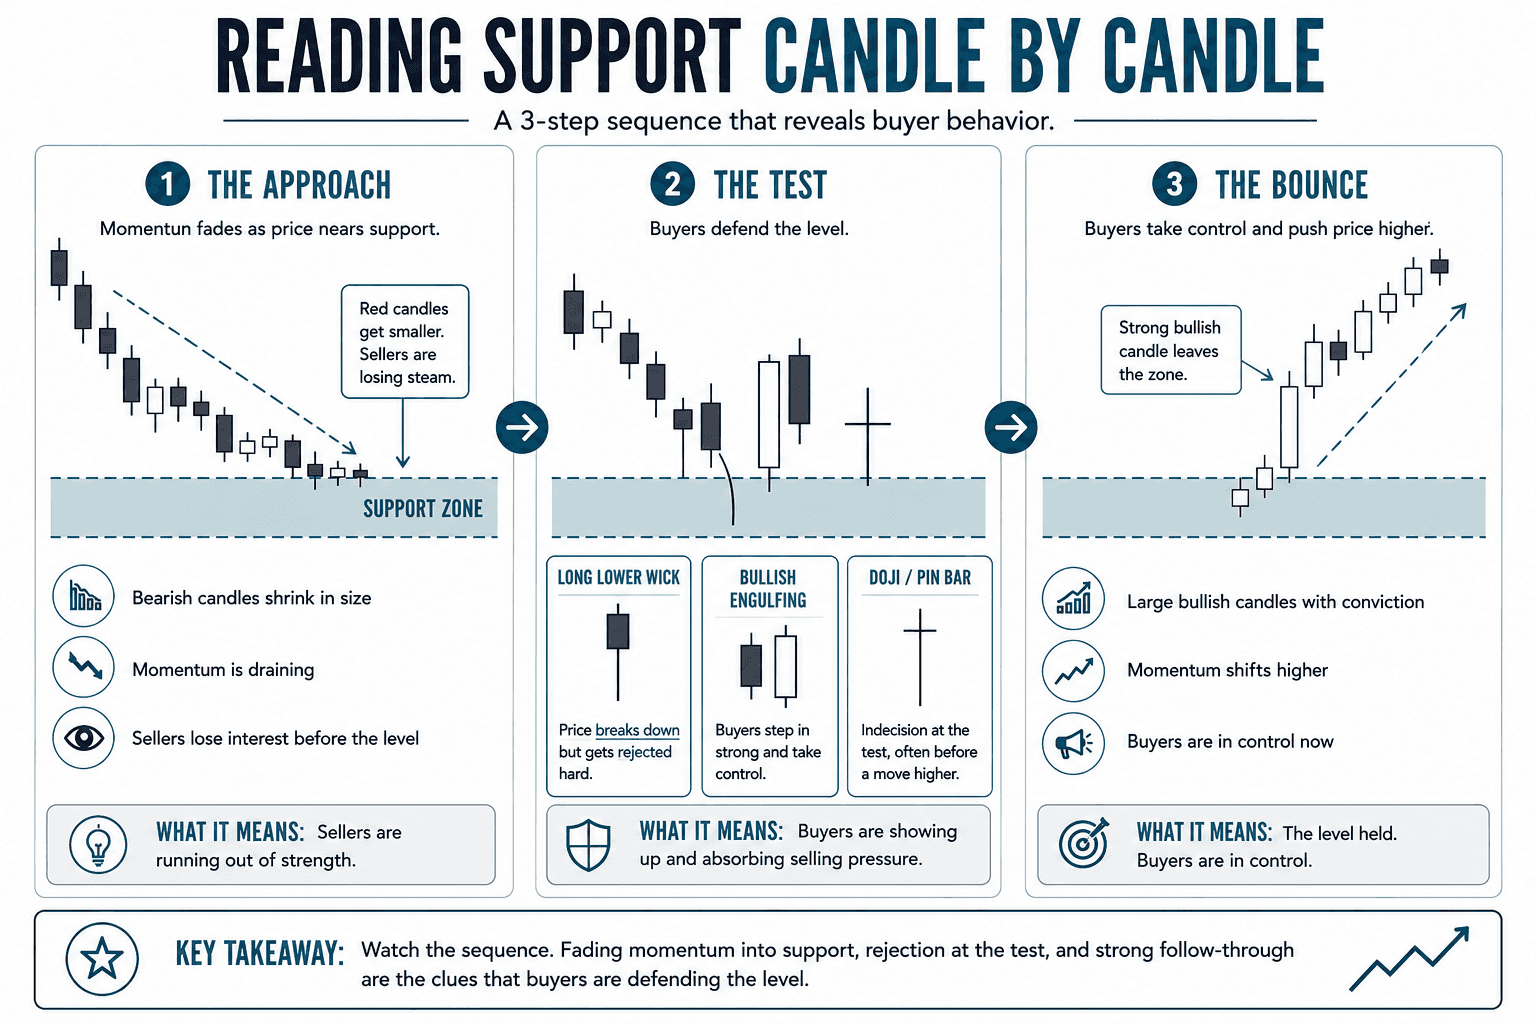
You don't need a crystal ball to read the market—you just need to watch how the candles behave as they approach the floor.
1. The Approach
Watch the size of the bodies. As price cascades down toward support, are the red candles shrinking? If so, momentum is draining. Sellers are losing interest in pushing prices progressively lower before they even hit the level.
2. The Test Candle
When price actually strikes the level, look for these distinct behavioral signatures:
The Long Lower Wick: Price tried to break the floor, got immediately punched in the mouth by buyers, and retreated. The wick is the crime scene photo of that rejection.
The Bullish Engulfing: A red candle gets completely swallowed by a massive green one. Total regime change in a single timeframe.
The Spinning Top / Doji: Pure corporate gridlock. Neither side won, and everyone is waiting for the next candle to break the tie.
3. The Bounce Candle
If support successfully holds, the confirming candle is usually large, loud, and aggressively green. It’s the visual definitive proof that buyers have seized control and are running away from the level.
The Real-Time Vibe Check
To trade this effectively, break the interaction into three phases:
Phase | What to Ask Yourself | What to Look For |
Pre-Touch | Is price sprinting into the level or drifting in? | High-volume, high-momentum sprints usually smash right through. Tired, low-volume drifts are ripe for a bounce. |
At the Touch | Did buyers react with force? | Look for a long lower wick closing well above the line. A tiny, flat candle body means buyer interest is utterly tepid. |
Follow-Through | Is the bounce actually sustainable? | If price bounces weakly and then immediately rolls over to test the floor again, that support level is under extreme duress. |
Support is a Zone, Not a Laser Beam
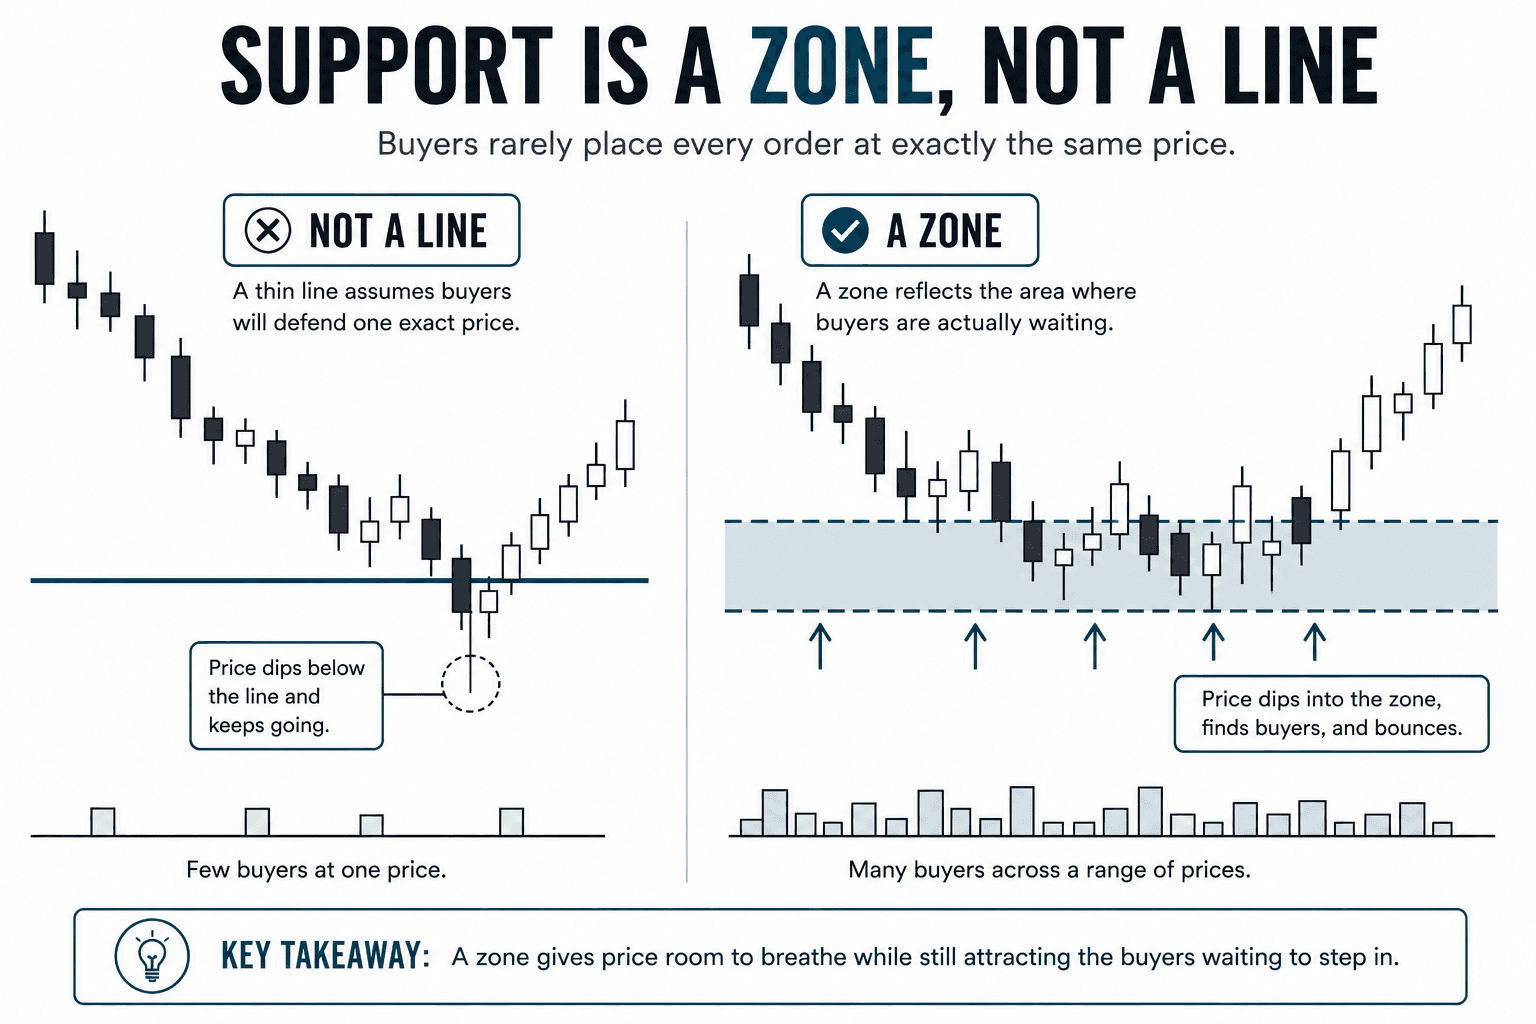
One of the fastest ways to lose money is treating support like a strict, single mathematical line.
Buyers don't all gather at $100.00 exactly. Some have orders at $100.15, some at $100.00, and others are waiting down at $99.85. Together, this cluster creates a support zone.
This explains why price frequently dips slightly below an obvious support line before sharply reversing. It wasn't a genuine breakout; the market was just reaching into the deeper pockets of the zone to fill the rest of the waiting orders before heading back up.
The Game Plan: Bounce vs. Role Reversal
You have two primary tactical options when trading a support zone, and both come with a trade-off:
Option A: Buying at Support. You buy right as price hits the zone, betting the floor will hold.
The Good: You get an amazing, discounted entry price and can place a very tight stop loss just beneath the zone.
The Bad: If the floor collapses right away, you get stopped out immediately.
Option B: Buying the Retest (Broken Resistance). You wait for price to break above a resistance level, wait for it to loop back around, and buy when that old ceiling proves it has flipped into a new floor.
The Good: A much higher-probability setup because the level has already proven its new identity.
The Bad: Your entry price is worse and your stop loss has to be much wider.
Why Support Eventually Snaps
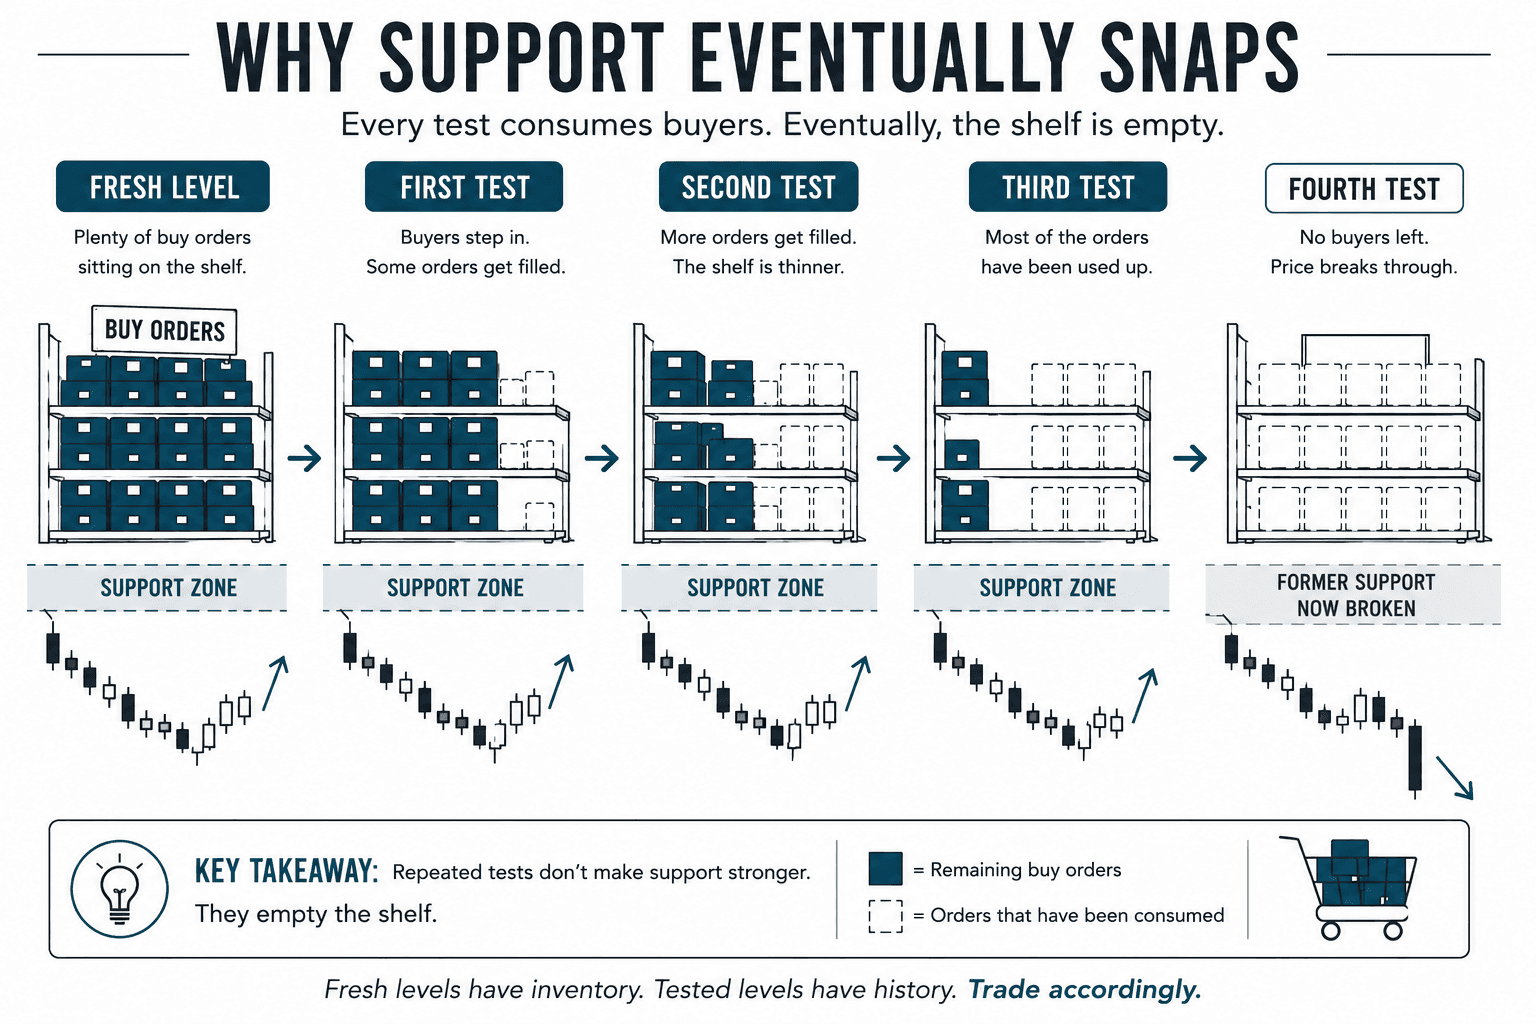
Support doesn't last forever. In fact, the more times a level is tested, the weaker it often becomes.
Think of a support level like a grocery store shelf stocked with buy orders. Every time price visits, it buys up a chunk of those orders. After the third or fourth test, the limit orders are completely filled and gone. The technical buyers have already taken their shots, and the short sellers have already finished covering.
When a fresh wave of selling hits a shelf that has been completely cleaned out of buyers, there is nothing left to absorb the impact. The floor vanishes, and price plummets.
The Ultimate Plot Twist: Support Flips to Resistance
When a support level finally breaks, every single buyer who entered the trade at that level instantly goes into the red.
Some panic and cut their losses immediately. The rest hold onto their losing trades, sweating, praying for just one small rally back to their entry point so they can escape at break-even without losing their shirts.
If price does bounce back up to that old support level, those trapped buyers flood the market with sell orders just to get out alive. This mechanical panic transforms a historical area of intense buying into a fresh ceiling of intense selling. Same traders, same price—entirely different psychological motivation.
Success Criteria
You will know you have mastered this concept when you can:
Identify the five distinct types of market participants whose order flows collectively generate demand at a support level.
Differentiate between a support "line" and a "support zone," explaining why price frequently dips below historical keys before reversing.
Analyze real-time candle metrics (approach momentum, touch wicks, and follow-through) to gauge whether buyers are actively defending or passively absorbing pressure.
Explain the mechanical shift that occurs when a support level breaks and subsequently flips into a resistance level.
Common Misconception
The more times a support level is tested and successfully holds, the stronger and more reliable it becomes.
The Truth: Every time price retests a support level, it executes and clears out a portion of the pre-existing buy orders sitting there. If a level is tested repeatedly without a strong, aggressive bounce, the available demand is quietly being absorbed (used up). A support level that has been tested five times is often far more fragile and likely to break than a fresh, untested level because the shelf of buyers has been completely emptied.
FAQ's
Q: What is the difference between support "holding" and support being "absorbed"?
Q: How do I predict if a level will hold or shatter?
Q: Does support only hold because everyone expects it to hold?
Table of Contents
About Me

Krista Weber
After a career as a VP of UX and EdTech executive, I retired early—and quickly realized the traditional world of trading education is fundamentally broken.
As someone with a Master’s in HCI who specialized in the design of e-learning systems, I saw a massive gap: beginners aren't failing because trading is impossible; they’re failing due to massive cognitive overload and terrible instructional design.
This site bridges that gap. I’m applying the principles of learning science, systems thinking, and minimalist UX to strip away the market noise and teach trading the way it actually should be taught.
Stay in Touch
Some of the pages on my travel blog contain affiliate links. Whenever you buy something through one of these links, I get a small commission at no extra cost to you. As an affiliate, I only recommend products and services that I feel are high quality and helpful to my readers. Thanks for your support.
Read More

Open almost any trading platform and you'll see EUR/USD sitting next to XAU/USD, NQ, ES, and a dozen CFDs on stocks you've heard of. They all show up as candlesticks moving left to right, which quietly implies they're all the same kind of thing. They aren't. Before going deeper into any one of them, it's worth drawing the map.
Updated on Sep 6, 2026

Futures are standardized contracts tied to defined specifications and a future settlement date. They can look complex at first, but the mechanics become much clearer once you know what the contract specification controls. Here's what you actually need to know.
Updated on Sep 6, 2026

CFDs appear everywhere in retail trading – but most new traders couldn't explain exactly what they are or why that matters. Here's a plain-language breakdown, including the parts that most introductions skip.
Updated on Sep 6, 2026