
The Market Map: What Are You Actually Trading?
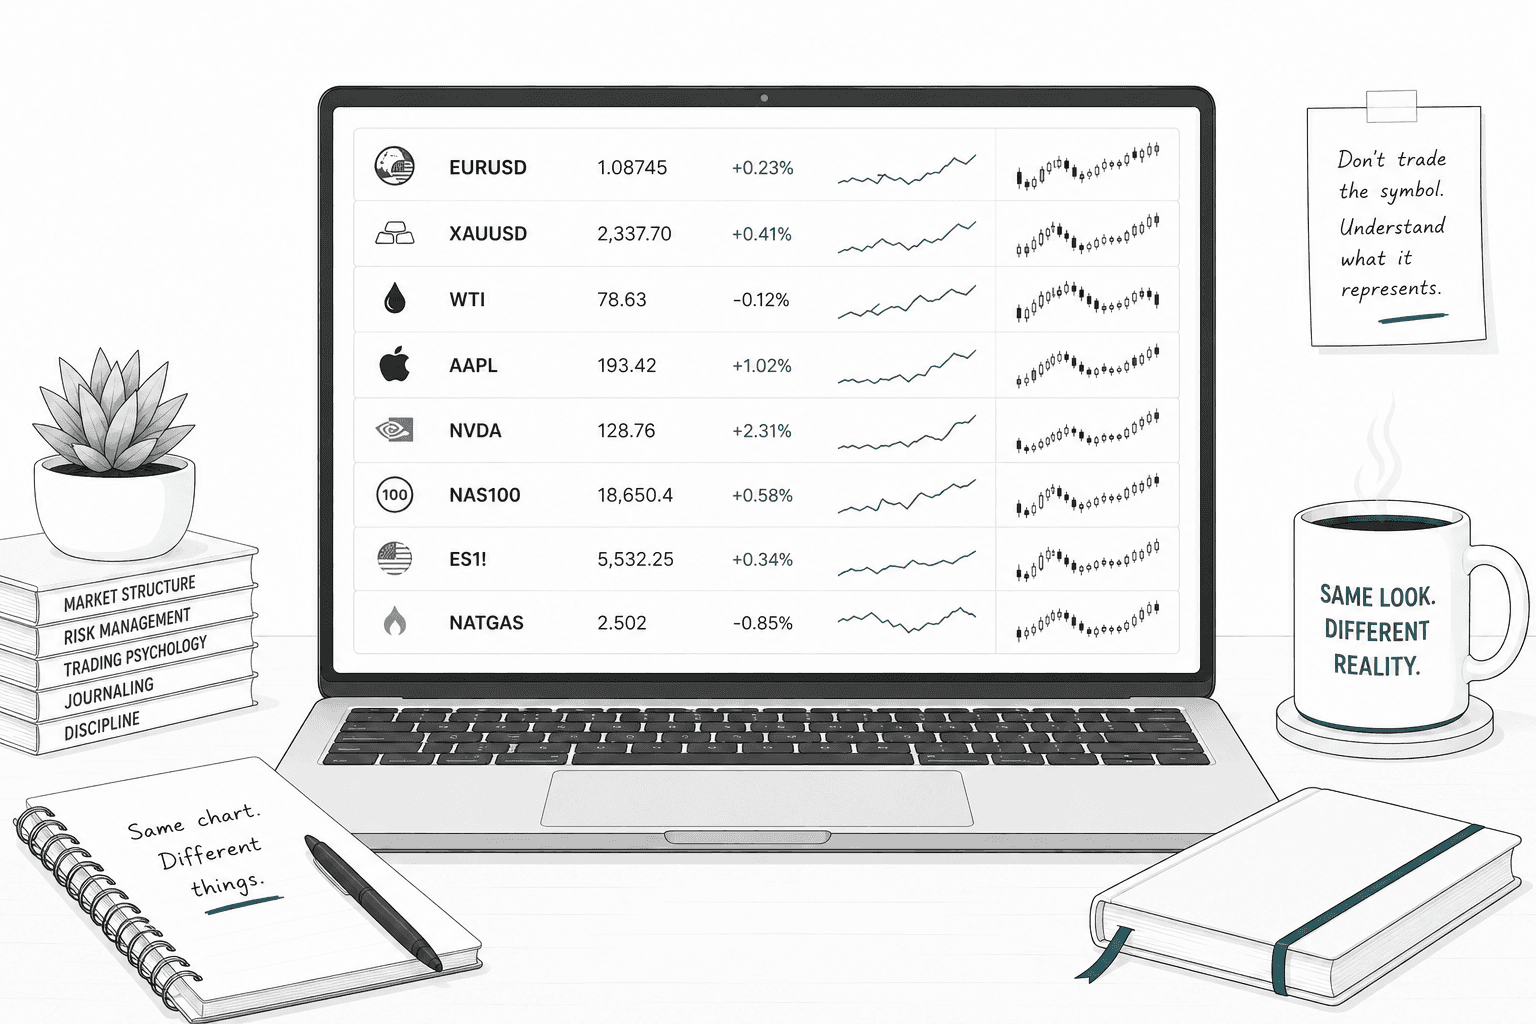
Open almost any trading platform and you'll see EUR/USD sitting next to XAU/USD, NQ, ES, and a dozen CFDs on stocks you've heard of. They all show up as candlesticks moving left to right, which quietly implies they're all the same kind of thing. They aren't. Before going deeper into any one of them, it's worth drawing the map.

Learning Path Stage 1: Foundations
Learning Level 3: Application
Primary Learning Objective
By the end of this lesson, you will be able to classify an unfamiliar tradable symbol by market, underlying instrument, and trading structure.
Why This Needs Its Own Lesson
Most trading education jumps straight into "here's how to read a chart" without pausing to explain what's actually being charted. That works fine until a learner opens a real platform and sees a watchlist that mixes currency pairs, commodities, stock index futures, and CFDs on individual companies, all rendered in the same candlestick format, all seemingly interchangeable.
They're not interchangeable, and the differences aren't cosmetic. Some of what you see on your platform is a relationship between two currencies. Some of it is a standardized contract that expires on a specific date. Some of it is a derivative product that only exists because your broker created it. Treating all of it as "just another chart" is how beginners end up holding a futures contract past expiration, or assuming a CFD gives them shareholder rights, or not understanding why their broker's gold price occasionally diverges from the number quoted on the news.
The fix isn't more charts. It's a map.
Because apparently the platform can give every product the same candlesticks and leave you to discover the legal differences later. Helpful.
Level One: The Market
At the top of the hierarchy sits the market itself, the broad category of what's being traded. The major ones you'll encounter:
Forex (foreign exchange). The market for trading one currency against another. This is where EUR/USD, GBP/JPY, and every other currency pair live. There's no single forex exchange; it's a decentralized network of banks, institutions, and brokers.
Commodities. Physical goods and raw materials: gold, silver, crude oil, natural gas, agricultural products. Some commodities trade through futures contracts, some through CFDs, some through both.
Equities. Ownership stakes in companies, traded as shares on stock exchanges. When you buy Apple stock, you own a small piece of Apple. When you trade a CFD on Apple, you don't, a distinction that matters more than it sounds like it should.
Indices. A basket of stocks tracked as a single number, the Nasdaq-100, the S&P 500, the Dow. You can't buy an index directly the way you'd buy a share; you access it through some kind of derivative built on top of it, most commonly a futures contract or a CFD.
Each of these markets has its own rhythm, regulation, and reason for existing. None of them is inherently "better." They're different rooms in the same building, and you'll eventually walk through more than one.
Notice that "futures" didn't make this list, and that's deliberate. A future isn't an asset class of its own; it's a way of trading one, which is exactly what Level Three is about. You can find futures contracts built on currencies, commodities, and indices alike. Keeping that distinction clean is the entire point of this lesson, so it's worth not muddying it here at the top.
Level Two: The Instrument
Inside each market, there are specific things you can actually trade, the instruments. This is the level most beginners start at without realizing there's a level above it.
EUR/USD represents the relative value of two currencies in the forex market. XAU/USD represents gold priced in US dollars, but the product used to trade that exposure depends on the venue and jurisdiction. NQ and ES are different: those ticker roots refer to E-mini equity-index futures contracts, while the Nasdaq-100 and S&P 500 are the underlying indices. This is why classification requires more than reading a symbol at face value.
Notice that an instrument doesn't tell you the whole story by itself. XAU/USD looks like a currency pair on your platform, uses the same pip-and-lot framework, and trades on the same interface as EUR/USD. But gold isn't a currency, it's a commodity being quoted in dollar terms for convenience. The instrument name tells you what's being measured. It doesn't tell you what kind of contract you're actually holding, which brings up the level that matters most for risk and mechanics.
Level Three: The Trading Structure
This is the layer most curricula skip, and it's the one the earlier version of this material buried across too many separate lessons. The trading structure is the actual legal and mechanical form your position takes, and it's independent of which instrument you're trading.
Spot / OTC. The transaction occurs over the counter rather than on one centralized exchange. In retail OTC forex, your dealer or broker is typically your counterparty. Wholesale spot FX has a broader dealer and institutional structure. Retail product structure also varies by jurisdiction, so the ticker alone does not tell you the legal form of the trade.
Futures contract. A standardized agreement to buy or sell at a set price on a set future date, traded on a regulated exchange like the CME. Fixed expiration, fixed contract size, centralized clearing. NQ, ES, and gold futures (GC) are all futures contracts.
CFD (Contract for Difference). An OTC derivative in which you and the provider exchange the change in value of an underlying reference between opening and closing the position. You do not own the underlying asset. CFD availability, protections, leverage rules, and the relationship between CFDs and retail forex vary by jurisdiction and provider.
Here's the part that trips people up: the same instrument can be accessed through different trading structures depending on your broker and your country. You might trade gold as a CFD through a forex broker, or as a futures contract (GC) through a futures broker, or as shares of a gold-backed ETF through a stock broker. Same underlying asset, three different structures, three different sets of rules about expiration, ownership, and counterparty risk. The chart may look identical. The paperwork absolutely does not.
Putting the Three Levels Together
A working example makes the hierarchy concrete. Say your platform shows "XAU/USD."
Market: Commodities (even though it's displayed like a currency pair).
Instrument: Gold, priced in US dollars.
Trading structure: This cannot be determined from XAU/USD alone. A broker may offer a CFD or another permitted product depending on jurisdiction and venue. Check the broker’s current contract specification before trading.
Now compare that to "GC" on a futures platform.
Market: Commodities.
Instrument: Gold, the same underlying asset.
Trading structure: A futures contract, exchange-traded, with a fixed expiration date and a completely different set of mechanics for margin and settlement.
Same market, same underlying instrument, different trading structure entirely. That's the piece of information a ticker symbol alone will never tell you, and it's exactly the piece worth checking before you risk money on anything unfamiliar.
This is not the glamorous part of trading. It is, however, much cheaper to be mildly bored now than genuinely surprised later.
Apply It: Classify the Listing, Not Just the Ticker
For each listing, identify four things: market, underlying exposure or instrument, trading structure, and what you still need to verify.
MNQ Dec 2026 on a CME futures platform.
XAU/USD on a retail broker watchlist with no product description shown.
US100 on a retail platform with no venue or contract details shown.
AAPL CFD on a broker platform.
Reasoning answer key
1. MNQ Dec 2026: The market is equity indices, the underlying exposure is the Nasdaq-100, and the trading structure is a futures contract. The platform and contract month make the structure explicit. You would still verify the current contract specification, fees, margin, and expiration details before trading.
2. XAU/USD: The market is commodities and the underlying exposure is gold priced in US dollars. The trading structure cannot be determined from the ticker alone. Verify the broker's product specification and the rules that apply in your jurisdiction.
3. US100: The ticker is provider-specific. It may reference the Nasdaq-100, but you should not assume the exact underlying or trading structure from the symbol alone. Verify both the reference market and the legal/product structure in the platform documentation.
4. AAPL CFD: The market is equities and the underlying exposure is Apple shares. The label identifies the trading structure as a CFD, so the position does not represent ownership of Apple stock. You would still verify the provider's contract terms, costs, and applicable protections.
Retrieval Check
Without looking back, answer these in your own words:
What is the difference between a market, an underlying exposure/instrument, and a trading structure?
Why is
XAU/USDby itself not enough to tell you exactly what legal product you would hold?What should you verify before trading any unfamiliar symbol or platform listing?
Why This Matters More Later Than It Does Right Now
None of this changes how you read a candlestick. A support level is a support level whether you're looking at EUR/USD, XAU/USD, or NQ. What changes is everything around the chart: how much capital you need, whether your position can expire without your involvement, what protections exist if the market gaps against you, and who exactly you're trading with.
You don't need to master every branch of this map today. Forex is still the right place to build your foundational skills: lower capital requirements, more educational material, and mechanics that are forgiving enough to learn on. But the next few lessons in this topic, on futures, on CFDs, and eventually on gold and index futures specifically, will make a lot more sense now that you know where each of them sits on the map, rather than encountering them as unconnected trivia.
A chart tells you where price has been. The map tells you what you're actually holding while you watch it.
Next article: What Are Futures? A Plain-Language Introduction
Success Criteria
After completing this lesson you should be able to take an unfamiliar symbol or platform listing, identify the market it belongs to, define what underlying exposure it represents, what trading structure is being offered, and which of those facts cannot be inferred from the ticker alone.
Common Misconception
If it moves on a chart, it's basically the same kind of trade.
The Truth: A candlestick chart of EUR/USD and a candlestick chart of NQ look identical in structure, so it's easy to assume the underlying mechanics are identical too. They're not. What you're trading, how it's regulated, whether it expires, and who's on the other side of your trade can all be completely different, even when the chart in front of you looks the same.
FAQ's
Q: Is this the same as learning to trade multiple markets?
Q: Can the ticker symbol tell me exactly what product I am trading?
Q: Do I need to understand this before I start trading forex?
Table of Contents
About Me

Krista Weber
After a career as a VP of UX and EdTech executive, I retired early—and quickly realized the traditional world of trading education is fundamentally broken.
As someone with a Master’s in HCI who specialized in the design of e-learning systems, I saw a massive gap: beginners aren't failing because trading is impossible; they’re failing due to massive cognitive overload and terrible instructional design.
This site bridges that gap. I’m applying the principles of learning science, systems thinking, and minimalist UX to strip away the market noise and teach trading the way it actually should be taught.
Stay in Touch
Some of the pages on my travel blog contain affiliate links. Whenever you buy something through one of these links, I get a small commission at no extra cost to you. As an affiliate, I only recommend products and services that I feel are high quality and helpful to my readers. Thanks for your support.
Read More

Futures are standardized contracts tied to defined specifications and a future settlement date. They can look complex at first, but the mechanics become much clearer once you know what the contract specification controls. Here's what you actually need to know.
Updated on Sep 6, 2026

CFDs appear everywhere in retail trading – but most new traders couldn't explain exactly what they are or why that matters. Here's a plain-language breakdown, including the parts that most introductions skip.
Updated on Sep 6, 2026

Gold is one of the most widely traded instruments in the world, but its behavior changes with market regime, liquidity, positioning, policy expectations, and event risk. Understanding what drives gold price movement changes how you interpret its charts.
Updated on Sep 6, 2026