
Trading Gold (XAU/USD): What Drives It and How Traders Approach It
Gold is one of the most widely traded instruments in the world, but its behavior changes with market regime, liquidity, positioning, policy expectations, and event risk. Understanding what drives gold price movement changes how you interpret its charts.

Learning Path Stage 6: Find Your Strategy
Learning Level 4: Analysis
Primary Learning Objective
By the end of this lesson, you will be able to analyze a gold trading context by combining current price behavior with relevant macro, policy, liquidity, and event drivers without treating any single relationship as permanent.
What Gold Actually Is (in a Trading Context)
In the trading context, gold (XAU/USD) is the price of one troy ounce of gold denominated in US dollars. When the price is $2,000, you'd need $2,000 to buy one troy ounce of gold.
Most retail traders never hold actual gold – they're trading CFDs or futures on gold, speculating on the price direction. The chart behaves like any other financial instrument: candlesticks, support and resistance, trend analysis all apply. What's different from forex is what drives the price.
What Drives Gold Price Movement
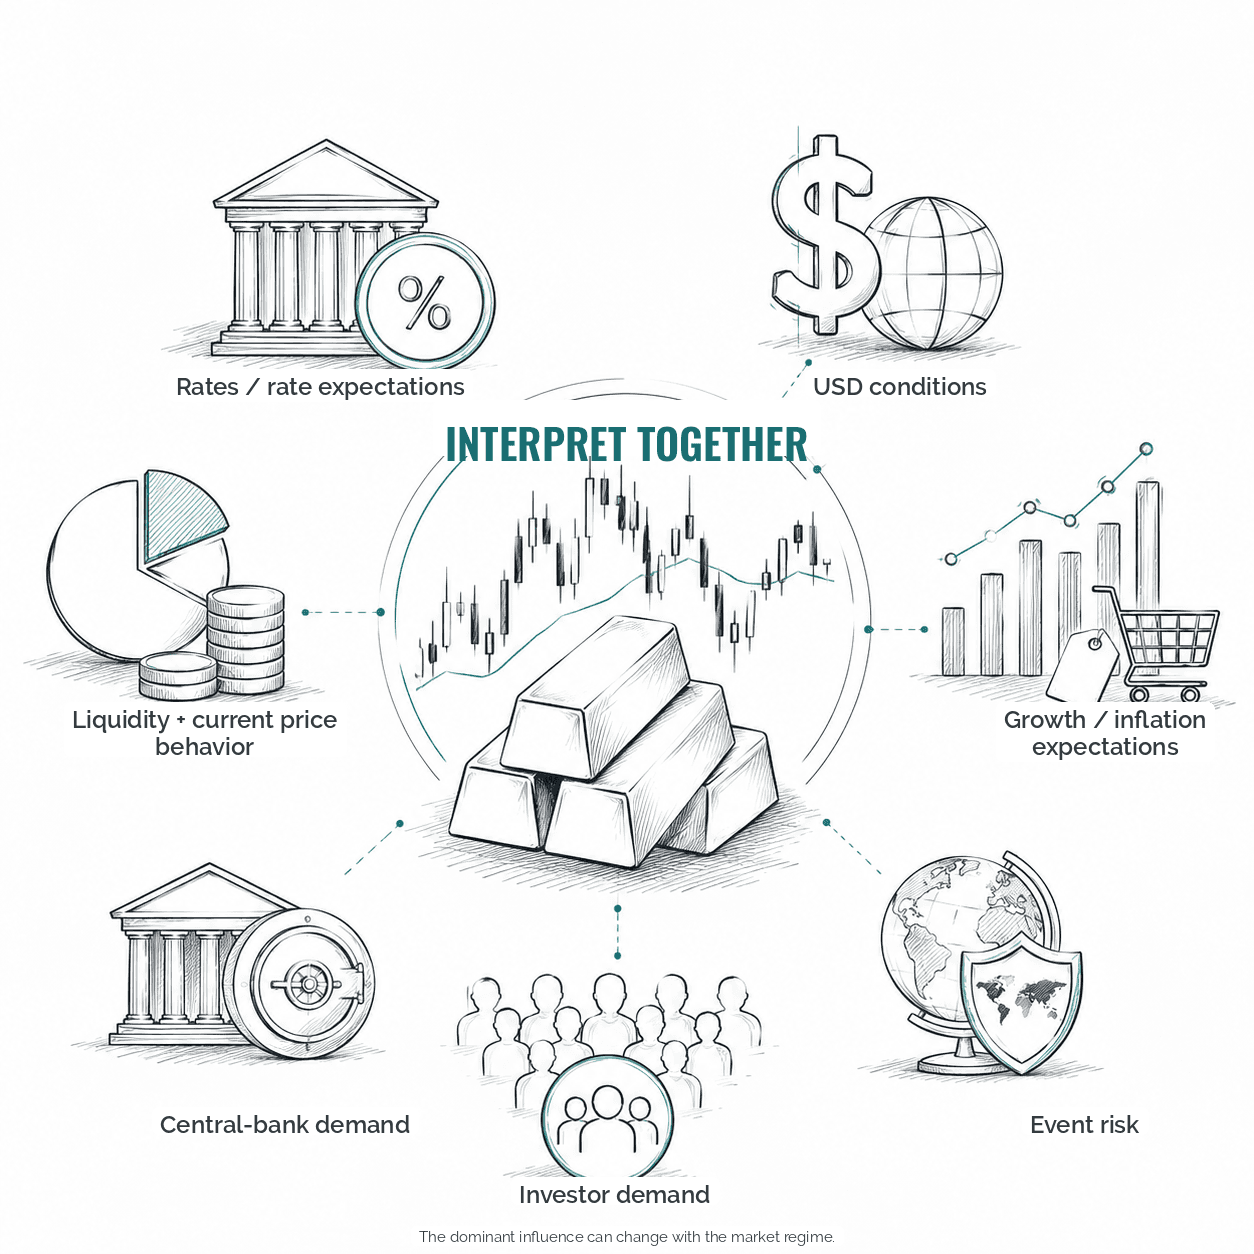
Gold has a more complex driver profile than most currency pairs. Understanding the main drivers helps interpret moves and context.
Gold is also very good at making a perfectly reasonable one-cause explanation look silly by lunchtime.
The main evidence streams to watch include:
1. US Real Interest Rates
Real rates are one important driver of gold, but they are not a permanent master variable. "Real rates" = nominal interest rates minus inflation expectations. When real-rate expectations change, the relative appeal of non-yielding gold versus interest-bearing assets can change as well. That relationship is historically important but not mechanically sufficient to predict price. Treat real rates as one evidence stream and check whether current gold price behavior confirms, weakens, or contradicts the hypothesis.
The practical implication: Fed policy announcements, CPI data releases, and PCE inflation data are high-impact events for gold because they affect real rate expectations.
2. US Dollar Strength
Gold and the US dollar often show an inverse relationship, but the strength and even direction of that relationship varies by regime. Use the dollar as one piece of current evidence rather than a one-variable signal.
3. Geopolitical and Economic Uncertainty
Gold is a traditional safe-haven asset. During periods of elevated geopolitical risk (wars, major political uncertainty) or financial system stress (banking crises, market crashes), investors historically move capital toward gold. These moves can be sharp and large – gold's 2020 move to record highs was partly driven by COVID-19 uncertainty.
4. Central Bank Buying
Global central banks hold significant gold reserves, and periods of elevated central bank purchasing (China, India, and other emerging market central banks have been significant buyers in recent years) provide structural support to gold prices. This is a longer-term driver, not an intraday one.
5. Speculative Positioning
Like any liquid market, gold's short-term price action reflects speculative positioning – particularly futures market positioning by large traders. The COT (Commitment of Traders) report provides a weekly snapshot of large speculator positioning, which some traders use as a contrarian signal at extremes.
Reading Gold Behavior Without Assigning a Personality
Instead of assuming gold always respects certain levels, trends cleanly, or behaves a certain way in a named session, inspect the conditions that exist now. Useful dimensions include current realized volatility, liquidity and spread for your product, scheduled-event risk, directional persistence, response to macro news, and whether recent price action is trending or overlapping.
Treat familiar ideas such as round numbers, support and resistance, pullbacks, opening ranges, or news reactions as hypotheses to test against recent data. Their usefulness depends on regime and on the rules of the strategy you are actually testing.
If you catch yourself saying, "Gold always does this," that is usually a good cue to replace always with a measurement window.
Analysis Scenario: One Move, Several Plausible Drivers
Gold rallies sharply during the U.S. session. At the same time, the dollar is slightly stronger, rate-cut expectations increase after a data release, a geopolitical headline raises uncertainty, and price breaks above a multi-day resistance area on expanding intraday range.
Analyze the move without forcing it into one explanation. The goal is not to build a detective corkboard with red string. It is to avoid confusing a plausible story with evidence:
Identify at least three plausible drivers or evidence streams.
Separate durable context from a possible one-off trigger.
Name the additional evidence you would check before deciding which interpretation deserves the most weight.
Explain how your interpretation would change the way you evaluate a technical setup. Do not turn the macro story into a trade signal by itself.
Evidence worksheet
Evidence observed | Possible interpretation | What would confirm or weaken it? | Trading implication |
|---|---|---|---|
Example: rate expectations shift | Lower expected real-rate pressure may support gold demand | Check Treasury yields, real-yield proxies, follow-through after the release | Treat as context; still require a valid setup and risk plan |
Retrieval Check
Why can a one-driver explanation of gold fail even when that driver matters historically?
What is the difference between context and a trigger?
What evidence could invalidate or weaken your current interpretation of a gold move?
Common Gold Trading Approaches
Macro-informed directional analysis: Build a hypothesis from several current inputs, such as real rates, dollar behavior, policy expectations, investor demand, central-bank demand, and event risk, then ask whether price action confirms or contradicts it.
Technical setup testing: If you use levels, pullbacks, opening ranges, or event-driven setups, test those rules on recent gold data rather than assuming the instrument naturally favors them. Record the conditions in which the setup succeeds or fails.
The XAU/USD Chart and Why Context Matters
Reading a gold chart without the macro context is like reading only half the information. A strong bullish candle on gold at $2,100 might be:
A trend continuation in an existing uptrend alongside macro evidence that may support the move
A counter-trend bounce while other evidence still points to unresolved pressure
A short-lived reaction to a one-time event that may or may not produce durable follow-through
The technical picture can look similar across all three cases. Macro context helps you form competing interpretations and decide what additional evidence to check, but it does not convert the chart into a higher- or lower-probability trade by itself.
For traders coming from a pure technical background, gold is an important instrument for developing the habit of contextualizing technical signals with fundamental drivers. The chart is not the whole story.
Gold has been a store of value for 5,000 years. It's spent the last few centuries also being one of the most actively traded instruments on earth. Approach it with appropriate respect.
Next article: Trading NQ: What Makes Nasdaq Futures Different
Success Criteria
You'll have successfully completed this lessen if when given a gold market scenario, you can identify multiple plausible drivers, distinguish durable context from a one-off event reaction, identify what current evidence you would check, and explain how that evidence would affect your interpretation of a technical setup.
Common Misconception
Gold always moves opposite the dollar, so you can trade it purely off DXY.
The Truth: The inverse relationship appears often enough to be worth monitoring, but it can weaken, disappear, or reverse depending on the regime. Treating the correlation as fixed will eventually put you on the wrong side of a move.
FAQ's
Q: What's the relationship between gold and the US dollar?
Q: Can I trade gold with a retail broker?
Q: Is gold more volatile than forex majors?
Table of Contents
About Me

Krista Weber
After a career as a VP of UX and EdTech executive, I retired early—and quickly realized the traditional world of trading education is fundamentally broken.
As someone with a Master’s in HCI who specialized in the design of e-learning systems, I saw a massive gap: beginners aren't failing because trading is impossible; they’re failing due to massive cognitive overload and terrible instructional design.
This site bridges that gap. I’m applying the principles of learning science, systems thinking, and minimalist UX to strip away the market noise and teach trading the way it actually should be taught.
Stay in Touch
Some of the pages on my travel blog contain affiliate links. Whenever you buy something through one of these links, I get a small commission at no extra cost to you. As an affiliate, I only recommend products and services that I feel are high quality and helpful to my readers. Thanks for your support.
Read More

Open almost any trading platform and you'll see EUR/USD sitting next to XAU/USD, NQ, ES, and a dozen CFDs on stocks you've heard of. They all show up as candlesticks moving left to right, which quietly implies they're all the same kind of thing. They aren't. Before going deeper into any one of them, it's worth drawing the map.
Updated on Sep 6, 2026

Futures are standardized contracts tied to defined specifications and a future settlement date. They can look complex at first, but the mechanics become much clearer once you know what the contract specification controls. Here's what you actually need to know.
Updated on Sep 6, 2026

CFDs appear everywhere in retail trading – but most new traders couldn't explain exactly what they are or why that matters. Here's a plain-language breakdown, including the parts that most introductions skip.
Updated on Sep 6, 2026