
Trading NQ: What Makes Nasdaq Futures Different
The Nasdaq-100 futures (NQ) are one of the most actively traded instruments in the world – and its standardized contract mechanics make it useful for learning how instrument structure affects execution and risk. Here is how to analyze NQ without assigning it a fixed personality.

Learning Path Stage 6: Find Your Strategy
Learning Level 4: Analysis
Primary Learning Objective
By the end of this lesson, you will be able to analyze an NQ trading context using contract mechanics, index composition, current volatility, session conditions, event risk, and strategy requirements.
What NQ Actually Is
NQ is the ticker for the E-mini Nasdaq-100 futures contract, traded on the CME Group's Globex platform. It tracks the Nasdaq-100 index – the 100 largest non-financial companies listed on the Nasdaq Stock Market, heavily weighted toward technology.
Nasdaq describes the Nasdaq-100 as 100 of the largest Nasdaq-listed non-financial companies. Its composition and sector weights change, so use Nasdaq's current index information when concentration matters to your analysis.
Contract specifications:
Multiplier: $20 per point
Minimum tick: 0.25 points ($5 per tick)
Realized range: measure from a defined recent window rather than relying on a permanent typical range
Margin requirement: variable; verify current CME and broker requirements
Micro (MNQ): 1/10th the above figures
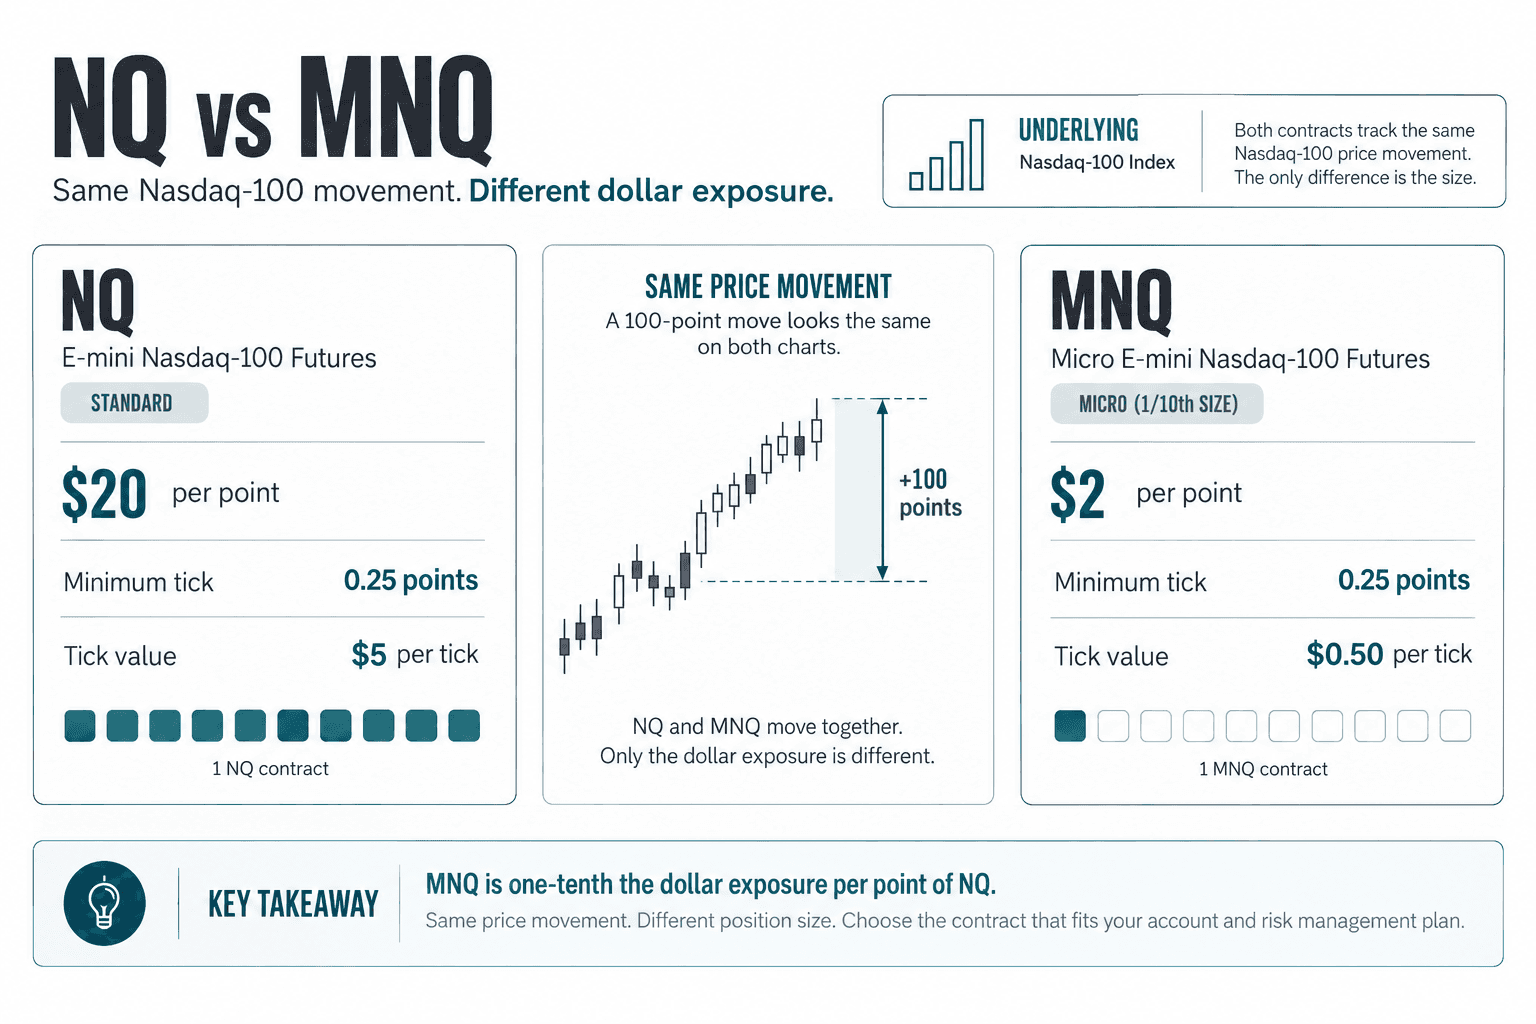
Analyze NQ Conditions, Not a Fixed Personality
NQ's contract mechanics are stable; its day-to-day behavior is not. Separate the two. The $20 multiplier and 0.25-point tick are contract facts. Speed, range, trend persistence, gap size, and reaction to levels are observations that must be measured in a defined period.
This sounds obvious until one fast morning convinces you the contract has developed a personal vendetta.
Useful current dimensions include realized volatility, volume and liquidity, session conditions, scheduled macro releases, earnings or sector news, overnight movement, and the strategy's required stop distance and execution speed.
Current-Conditions Analysis Framework
Use this table as an observation checklist. The entries are not permanent NQ traits.
Dimension | What to observe now | Why it matters |
|---|---|---|
Current volatility / noise | Recent realized range, candle expansion, stop distances | Changes the dollar risk created by the same contract multiplier |
Session / time context | Volume, liquidity, spread, and behavior in the period you actually trade | Your strategy may perform differently across time windows |
Scheduled event risk | Macro releases, major policy events, relevant earnings or sector news | A valid chart setup can become unsuitable when event risk changes execution conditions |
Liquidity / execution | Spread, depth, slippage, speed of movement | Determines whether the setup can be executed within your tested assumptions |
Strategy requirements | Entry style, invalidation distance, holding period, tested rules | Instrument conditions must fit the strategy, not the other way around |
NQ vs MNQ sizing | Dollar exposure implied by the same point movement | Contract choice can change whether the setup fits your risk limit |
Scenario Practice: Valid Setup, Difficult Conditions
You identify a technically valid NQ setup. Current volatility is elevated, the required stop is wider than normal for your strategy, and a high-impact scheduled event is due within 20 minutes.
Choose the most defensible response from the options below, then justify it from the evidence rather than from a permanent rule about NQ:
normal NQ size,
reduced NQ size,
use MNQ to reduce dollar exposure,
no trade,
reconsider the setup after the event.
More than one answer may be defensible depending on the strategy's tested rules. Your explanation should address current volatility, event risk, stop distance, and contract sizing.
Retrieval Check
What is the mechanical difference between NQ and MNQ that directly changes dollar exposure?
Why does current volatility matter even when the chart setup itself is valid?
What evidence could make a technically valid NQ setup unsuitable to trade?
Popular NQ Trading Approaches
Opening-range, VWAP, key-level, and gap frameworks: These are common ways traders organize NQ observations, but none should be treated as an inherent property of the instrument. Define the rule, test it on recent data, segment the results by regime and session, and compare the required stop distance and execution demands with your risk plan.
The Capital and Risk Consideration
Start with the contract multiplier, current volatility, invalidation distance, and your maximum dollar risk. If one NQ contract makes the required risk too large, MNQ provides one-tenth the multiplier. Current exchange and broker margin requirements are constraints, not recommendations for how much capital is 'enough.'
Use neutral risk questions: What would one contract lose at the setup's invalidation point? Does current volatility make that stop unusually wide? Would MNQ make the same setup compatible with the risk plan? Is scheduled event risk high enough that avoiding the setup is the better decision?
Is NQ Right for You?
Treat this as a fit question, not a personality test. NQ may be worth further simulation if its contract size, current volatility, trading hours, data structure, and execution demands fit the rules you are actually testing. If they do not, that is useful information, not a challenge to become tougher.
If one NQ contract turns a technically valid stop into an amount of money that makes you stare at the screen differently, the contract is too large for that setup. That is a sizing problem, not a courage problem. MNQ can reduce the dollar exposure while preserving the same underlying index movement.
A sensible path is to study the mechanics, test the strategy in replay or simulation, compare NQ and MNQ against the same risk rules, and only then decide whether the instrument deserves a place in your process. The answer is allowed to be no.
NQ does not need a personality. Its contract mechanics are fixed; whether it fits your strategy and risk plan depends on the conditions you can actually observe and test.
Next article: Trading Gold vs Forex vs Futures
Success Criteria
You'll have successfully completed this lesson when you can look at an NQ scenario, and you can identify the conditions that materially affect execution and risk, explain why those conditions matter for a chosen strategy, and identify evidence that would make you reduce size, switch to MNQ, avoid the setup, or reconsider the approach.
Common Misconception
NQ has a fixed personality: always fast, always trending, always best around the same time of day.
The Truth: The contract mechanics are stable. The market behavior you experience is not. Volatility, liquidity, event risk, and execution conditions change, so they have to be observed rather than assumed.
FAQ's
Q: What is MNQ and how is it different from NQ?
Q: When should I evaluate NQ activity?
Q: Is NQ harder to trade than forex?
Table of Contents
About Me

Krista Weber
After a career as a VP of UX and EdTech executive, I retired early—and quickly realized the traditional world of trading education is fundamentally broken.
As someone with a Master’s in HCI who specialized in the design of e-learning systems, I saw a massive gap: beginners aren't failing because trading is impossible; they’re failing due to massive cognitive overload and terrible instructional design.
This site bridges that gap. I’m applying the principles of learning science, systems thinking, and minimalist UX to strip away the market noise and teach trading the way it actually should be taught.
Stay in Touch
Some of the pages on my travel blog contain affiliate links. Whenever you buy something through one of these links, I get a small commission at no extra cost to you. As an affiliate, I only recommend products and services that I feel are high quality and helpful to my readers. Thanks for your support.
Read More

Open almost any trading platform and you'll see EUR/USD sitting next to XAU/USD, NQ, ES, and a dozen CFDs on stocks you've heard of. They all show up as candlesticks moving left to right, which quietly implies they're all the same kind of thing. They aren't. Before going deeper into any one of them, it's worth drawing the map.
Updated on Sep 6, 2026

Futures are standardized contracts tied to defined specifications and a future settlement date. They can look complex at first, but the mechanics become much clearer once you know what the contract specification controls. Here's what you actually need to know.
Updated on Sep 6, 2026

CFDs appear everywhere in retail trading – but most new traders couldn't explain exactly what they are or why that matters. Here's a plain-language breakdown, including the parts that most introductions skip.
Updated on Sep 6, 2026