
What Buyers and Sellers Are Actually Doing at Resistance
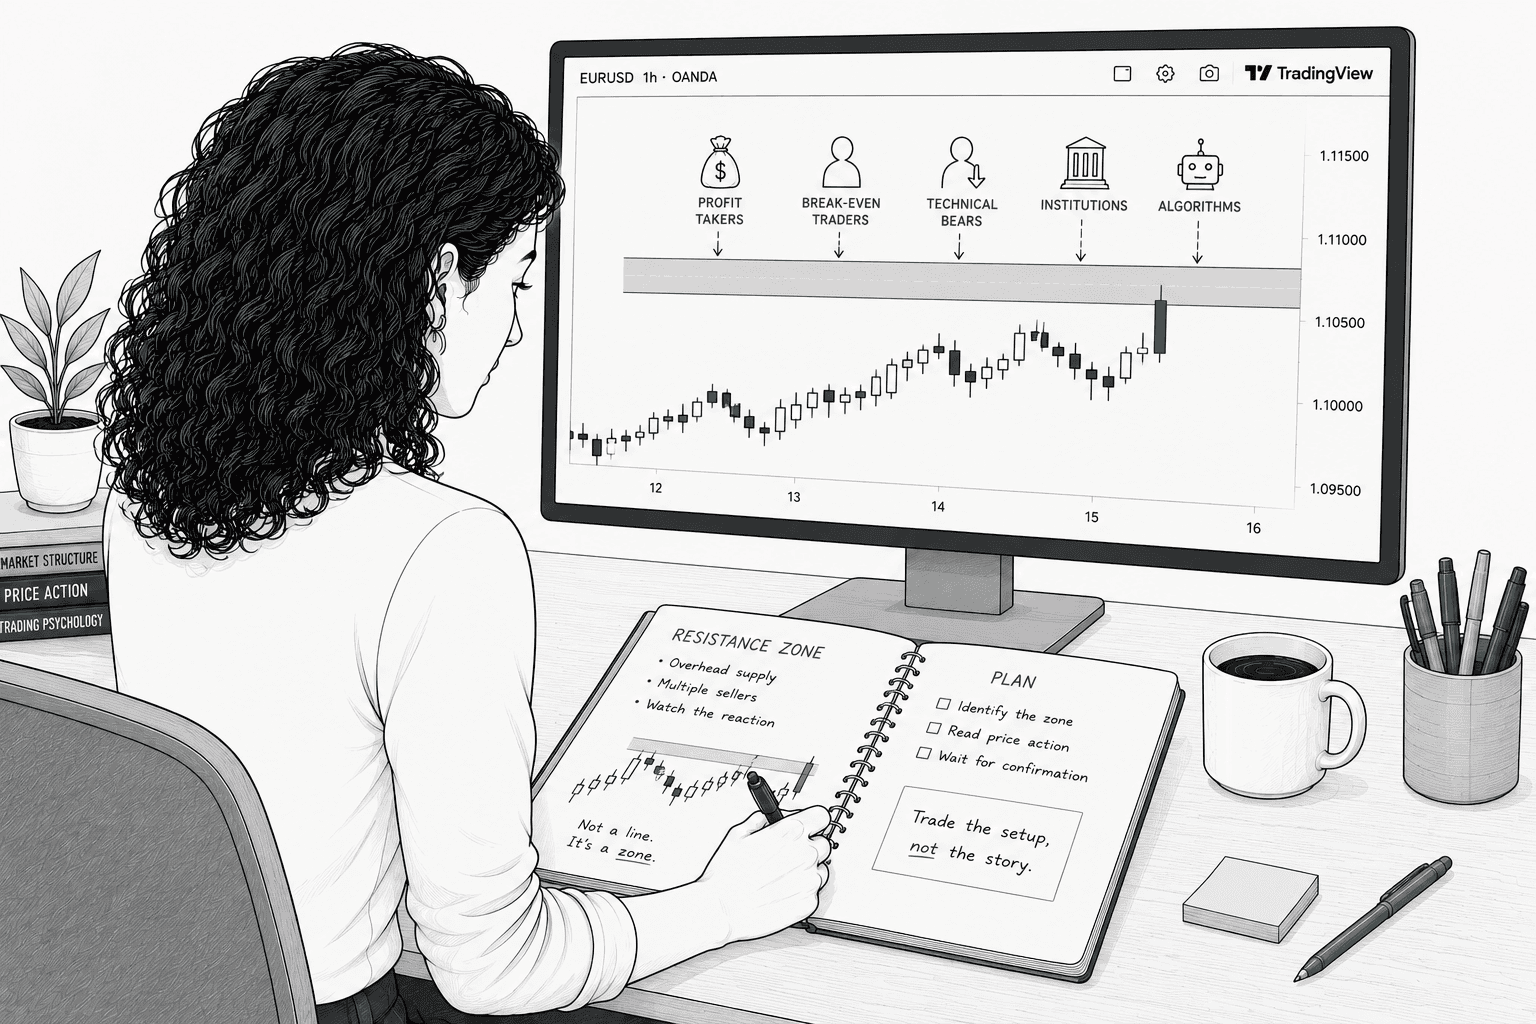
"Stops going up" isn't market magic or a spooky supernatural event. It’s the direct result of specific selling decisions made by specific human beings (and their robotic overlords) at a specific price for highly predictable reasons. Once you can name those reasons, resistance stops being a random line you're crossing your fingers and hoping holds. Instead, it becomes a map you can actually read.
Learning Path Stage 2: Reading Charts
Learning Level 2: Understanding
Primary Learning Objective
By the end of this lesson you should be able to shift a your perspective from viewing resistance as an arbitrary, static line on a chart to recognizing it as a dynamic, psychological zone driven by the order flow and motivations of specific market participants (profit-takers, trapped bagholders, technical shorts, institutional hedgers, and algorithms).
Learn who sells at resistance, and you’ll know exactly when it’s about to break.
"Stops going up" isn't market magic or a spooky supernatural event. It’s the direct result of specific selling decisions made by specific human beings (and their robotic overlords) at a specific price for highly predictable reasons. Once you can name those reasons, resistance stops being a random line you're crossing your fingers and hoping holds. Instead, it becomes a map you can actually read.
Who Is Selling at Resistance?
Resistance is just a price zone where selling supply historically overpowers buying demand. This doesn’t happen by accident. The crowd standing at the offer usually breaks down into five distinct characters:
The Profit-Takers: These are the traders who actually bought low, timed it right, and are sitting on a green position. As price approaches their target, they sell to turn fake screen money into real money. They cluster at obvious levels because everyone uses the same basic chart software.
The Break-Even Bagholders (Overhead Supply): The most emotional group of the bunch. These traders FOMO’d into the absolute top of the last spike, got immediately trapped underwater, and spent weeks praying to the market gods for a second chance. The absolute millisecond price claws back to their entry, they sell to exit flat, vowing never to trade again (until next week).
The Technical Bears: The contrarians who spot a ceiling and actively bet that the party is over. Their fresh short orders stack directly on top of the profit-takers and bagholders.
The Corporate Hedgers: Large institutions managing massive long portfolios. They aren’t necessarily shorting because they think the level will hold; they’re just selling a chunk to scale back risk. It’s standard institutional housekeeping, but it adds massive sell-side volume nonetheless.
The Algorithms: Cold, unfeeling server racks programmed to execute mechanical sell orders the exact microsecond price touches a round number or major moving average. They don't have emotions, but they do have massive size.
The takeaway: None of this is arbitrary. Specific prices carry heavy psychological memory, and their orders cluster right where those memories live.
Reading Resistance Candle by Candle
You don't need a crystal ball to see this battle play out; it maps itself perfectly onto your screen.
The Approach: Watch the sizes of the green candles as price rallies toward the level. If they are shrinking, buyers are losing their nerve and running out of breath before they even reach the ceiling.
The Test: When price hits the level, the chart leaves fingerprints:
A long upper wick: Price poked its head into the room, got hit with a frying pan by sellers, and closed back down. The wick is the visual history of a failed invasion.
A bearish engulfing candle: A complete regime change in a single candle. Buyers had full control, but sellers stepped in with so much size they swallowed the entire previous range.
A doji or spinning top: Total deadlock. Neither side can move the other, meaning the very next candle is going to decide who wins.
The Rejection: If the ceiling holds, the confirming candle is usually large, loud, and clearly red. The buyers have officially left the building, and price moves away from the level with clear conviction.
Watching the Standoff in Real Time
A single candle shape tells you what already happened. Watching the sequence tells you what’s about to happen.
The Approach: Is price sprinting toward resistance with explosive volume, or is it drifting upward like a tired balloon? High-velocity momentum has a real shot at obliterating a level. A slow drift is just begging to be rejected.
The Touch: Does the reaction candle show an immediate, violent rejection, or a stubborn, decisive close right above the line? The behavior at the exact point of contact reveals everything about how much sell-side liquidity is actually sitting there.
The Aftermath (If Rejected): Does price drop fast and hard away from the level, or does it hang around, stall, and immediately try to poke the ceiling again? Fast, repeated retests with shallow bounces mean the sellers are getting chipped away and running out of ammo.
The Aftermath (If Broken): Does the breakout candle find continuation, or does it instantly snap back below the line? An immediate U-turn back through a fresh breakout is a textbook "liquidity hunt"—otherwise known as a fakeout designed to trap retail traders.
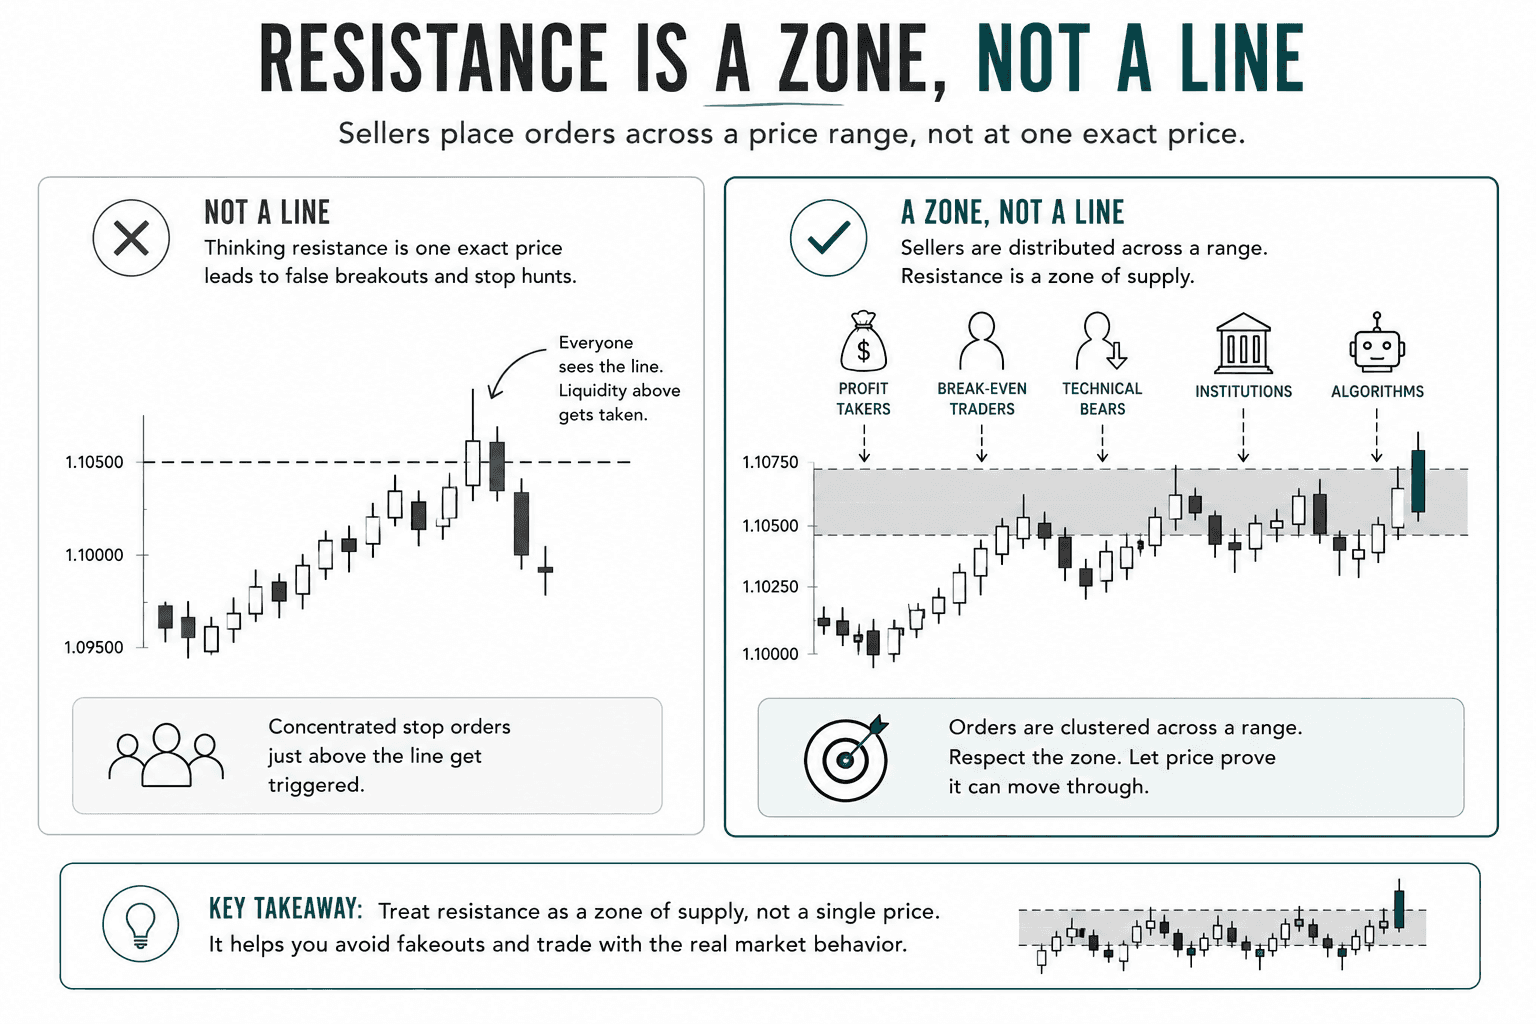
Resistance is a Zone, Not a Laser Line
Sellers don't all coordinate on Zoom to place their orders at the exact same decimal point. Orders are scattered across a small price range. This is why price so frequently pushes slightly above a strict resistance line before violently reversing.
The breakout traders pop champagne over the line break, only to get brutally slammed when price wanders into the heavy pool of institutional supply hidden just a few pips higher up in the zone. Draw your charts with shaded zones, not razor-thin lines, and you'll stop getting tricked by these micro-fakeouts.
Why Resistance Actually Breaks
Levels break because buying demand outlasts the supply sitting on the offer. This usually boils down to three scenarios:
The Sellers Run Out: After testing a level four or five times, the profit-takers have sold out, the trapped bagholders have happily broken even, and the aggressive short sellers have been stopped out. Because a short's stop-loss is technically a buy order, their exits fuel the fire. By the next test, the wall of sellers is gone, and price glides right through.
A Catalyst Steps In: High-impact news, a surprise central bank decision, or a massive macro sentiment shift creates a tidal wave of fresh buying volume that completely runs over whatever normal supply was resting at the level.
Trend Momentum Takes the Wheel: In a roaring bull market, buying pressure is simply too relentless to care about arbitrary lines. Price will slash through multiple historical resistance zones like a hot knife through butter.

The Role Reversal Mechanic
When a resistance zone breaks convincingly, the psychology flips entirely. The technical short sellers who fought the breakout are now bleeding money, and they are desperate for price to drop back to their entry point so they can escape alive at break-even.
When price finally pulls back to that old resistance level:
Trapped short sellers buy to cover and close their positions at net zero.
Flipped breakout traders who missed the first train treat the pullback as their second-chance entry.
Systematic traders who love the retest pattern buy on purpose, anticipating a bounce.
All three market behaviors create a massive concentration of buy orders at the exact price where sell orders used to rule. This isn't a magical self-fulfilling prophecy or chart-voodoo; it’s just the exact same participants showing up at the exact same price with completely inverted motivations.
Success Criteria
You will know you have mastered this concept when you can:
Identify the five main types of sellers contributing to overhead supply at a resistance level.
Read price action candle by candle to evaluate the momentum, test quality, and real-time validity of a rejection or breakout.
Map resistance as a shaded zone rather than a single price point to avoid falling victim to retail liquidity hunts and micro-fakeouts.
Explain the mechanical reason behind the "role reversal" phenomenon where broken resistance structurally flips into a new support level.
Common Misconception
Resistance levels are hard, definitive lines in the sand where price automatically "has" to stop because everyone sees it.
The Truth: Lines don't stop price; sellers stop price. Because different participants place orders across a distributed price range, resistance functions as a zone rather than a precise laser line. Furthermore, highly obvious levels are not guaranteed to hold; because they concentrate a massive cluster of short stop-losses just above them, they frequently fail spectacularly in explosive short squeezes rather than offering a quiet reversal.
FAQ's
Q: Why do sellers stack up at one specific price point anyway?
Q: What happens to the bears once price destroys their resistance level?
Q: If a resistance level is totally obvious to everyone, doesn't that make it more likely to fail?
Table of Contents
About Me

Krista Weber
After a career as a VP of UX and EdTech executive, I retired early—and quickly realized the traditional world of trading education is fundamentally broken.
As someone with a Master’s in HCI who specialized in the design of e-learning systems, I saw a massive gap: beginners aren't failing because trading is impossible; they’re failing due to massive cognitive overload and terrible instructional design.
This site bridges that gap. I’m applying the principles of learning science, systems thinking, and minimalist UX to strip away the market noise and teach trading the way it actually should be taught.
Stay in Touch
Some of the pages on my travel blog contain affiliate links. Whenever you buy something through one of these links, I get a small commission at no extra cost to you. As an affiliate, I only recommend products and services that I feel are high quality and helpful to my readers. Thanks for your support.
Read More

Open almost any trading platform and you'll see EUR/USD sitting next to XAU/USD, NQ, ES, and a dozen CFDs on stocks you've heard of. They all show up as candlesticks moving left to right, which quietly implies they're all the same kind of thing. They aren't. Before going deeper into any one of them, it's worth drawing the map.
Updated on Sep 6, 2026

Futures are standardized contracts tied to defined specifications and a future settlement date. They can look complex at first, but the mechanics become much clearer once you know what the contract specification controls. Here's what you actually need to know.
Updated on Sep 6, 2026

CFDs appear everywhere in retail trading – but most new traders couldn't explain exactly what they are or why that matters. Here's a plain-language breakdown, including the parts that most introductions skip.
Updated on Sep 6, 2026