
The Inside Bar Pattern (How to Read the Market Taking a Deep Breath)
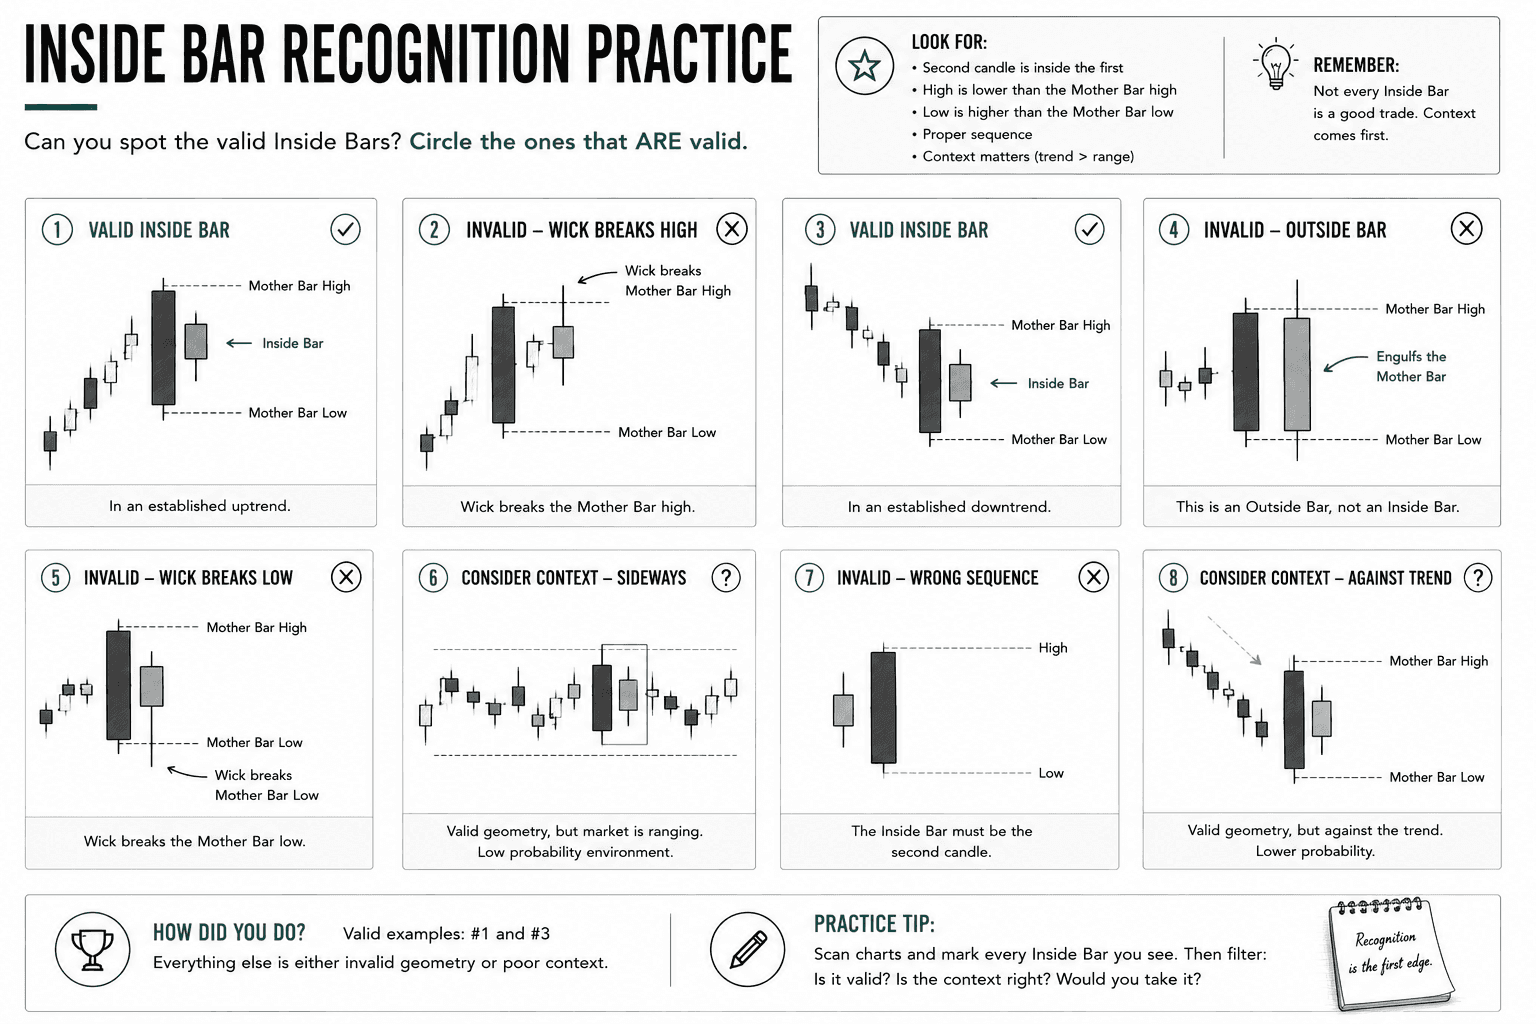
An inside bar is a two-candle pattern where the second candle's high and low are both contained within the range of the first candle. The first candle (the "mother bar") engulfs the second. This containment signals a pause, indicating he market has compressed into a tighter range after a directional move. Inside bars are used as entry triggers and as precursors to breakout moves.

Learning Path Stage 3: Chart Patterns
Learning Level 1: Recognition
Primary Learning Objective
After completing this lesson, you'll be able to recognize a valid Inside Bar, distinguish it from similar-looking candles, and identify the market conditions where the pattern is most likely to succeed.
If you spent more than eleven seconds looking at trading forums last night, you’ve probably seen someone hyping the Inside Bar. It’s a retail favorite because the geometry is so simple an uncalibrated chatbot could find it, and the setup logic sounds incredibly tidy.
But let’s debug the actual user experience of this pattern before you start treating it like a money printer.
An inside bar is not a magical invitation from the market gods to get rich; it is simply a visual user interface notification that the market has temporarily run out of glucose and is taking a nap. Here is how to audit the pattern, filter out the noise, and trade it without destroying your capital.
Color Context: Irrelevant Data
The color of the inside bar does not matter. It can be green, red, teal, black, white, or neon pink. The color doesn't determine the pattern's structural bias, so you don't have to keep trying to read deep psychological meaning into whether the inside bar closed positive or negative. It’s a consolidation pattern, meaning the market is actively refusing to make a decision.
1. The Anatomy of the Pause
The geometry here is strict. The pattern requires two specific components: the Mother Bar and the Inside Bar.
The Mother Bar: This candle sets the entire playground. It establishes the absolute high and absolute low coordinates for the session.
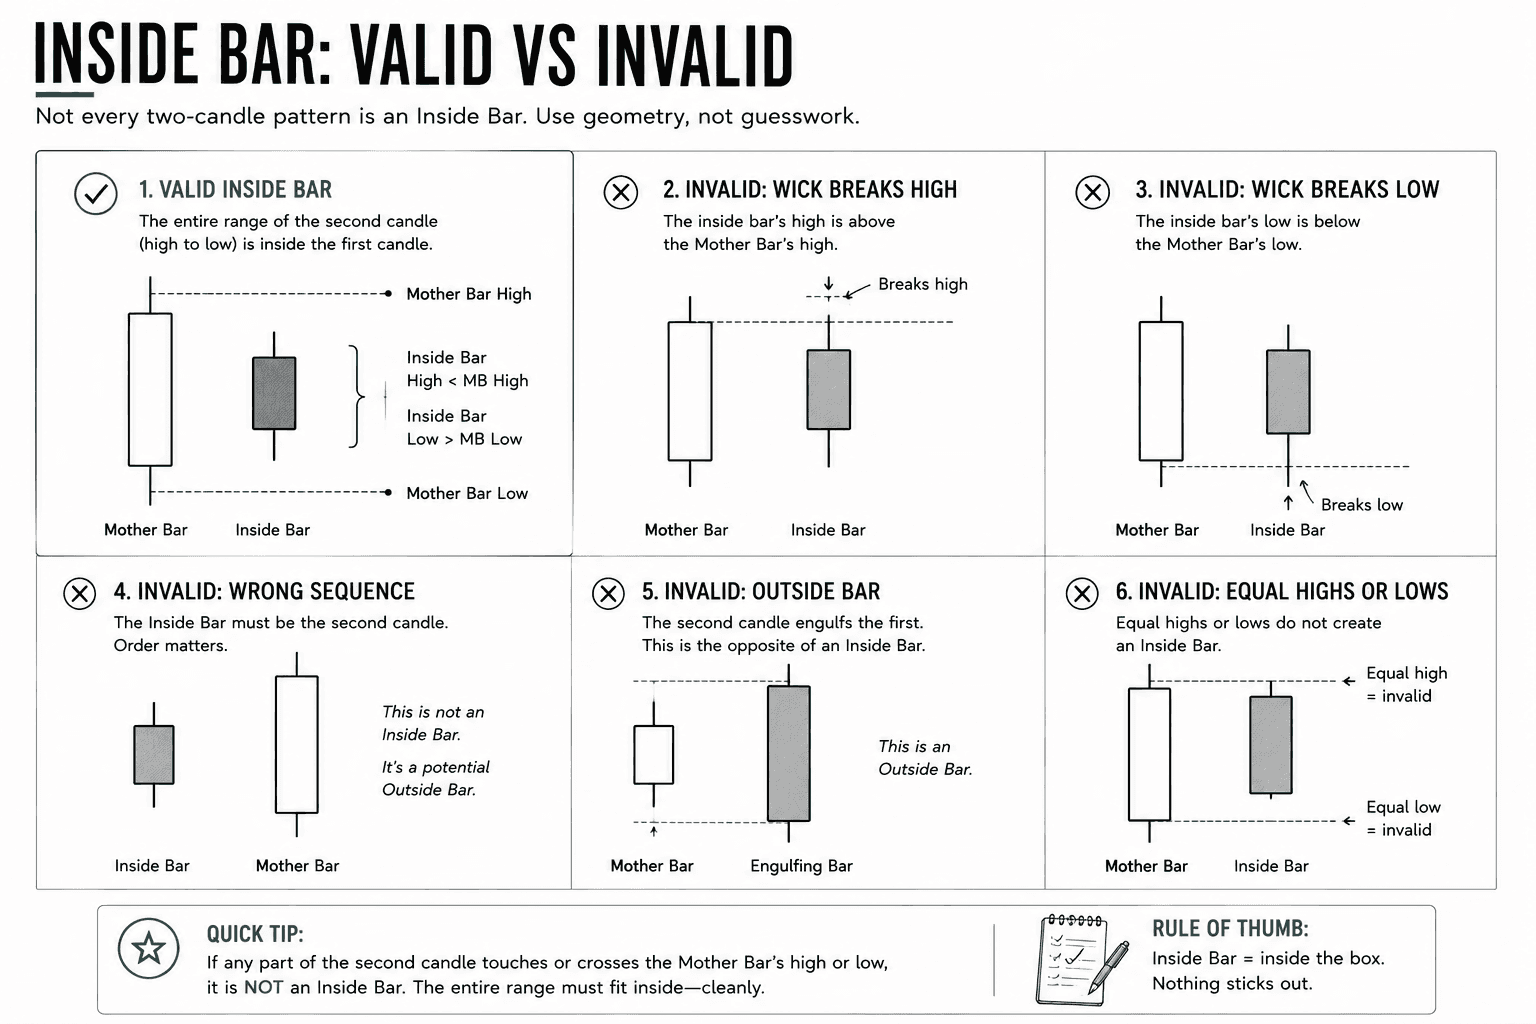
The Inside Bar: This is the immediate next candle. To qualify for system validation, both its high and its low must sit completely inside the Mother Bar's range.
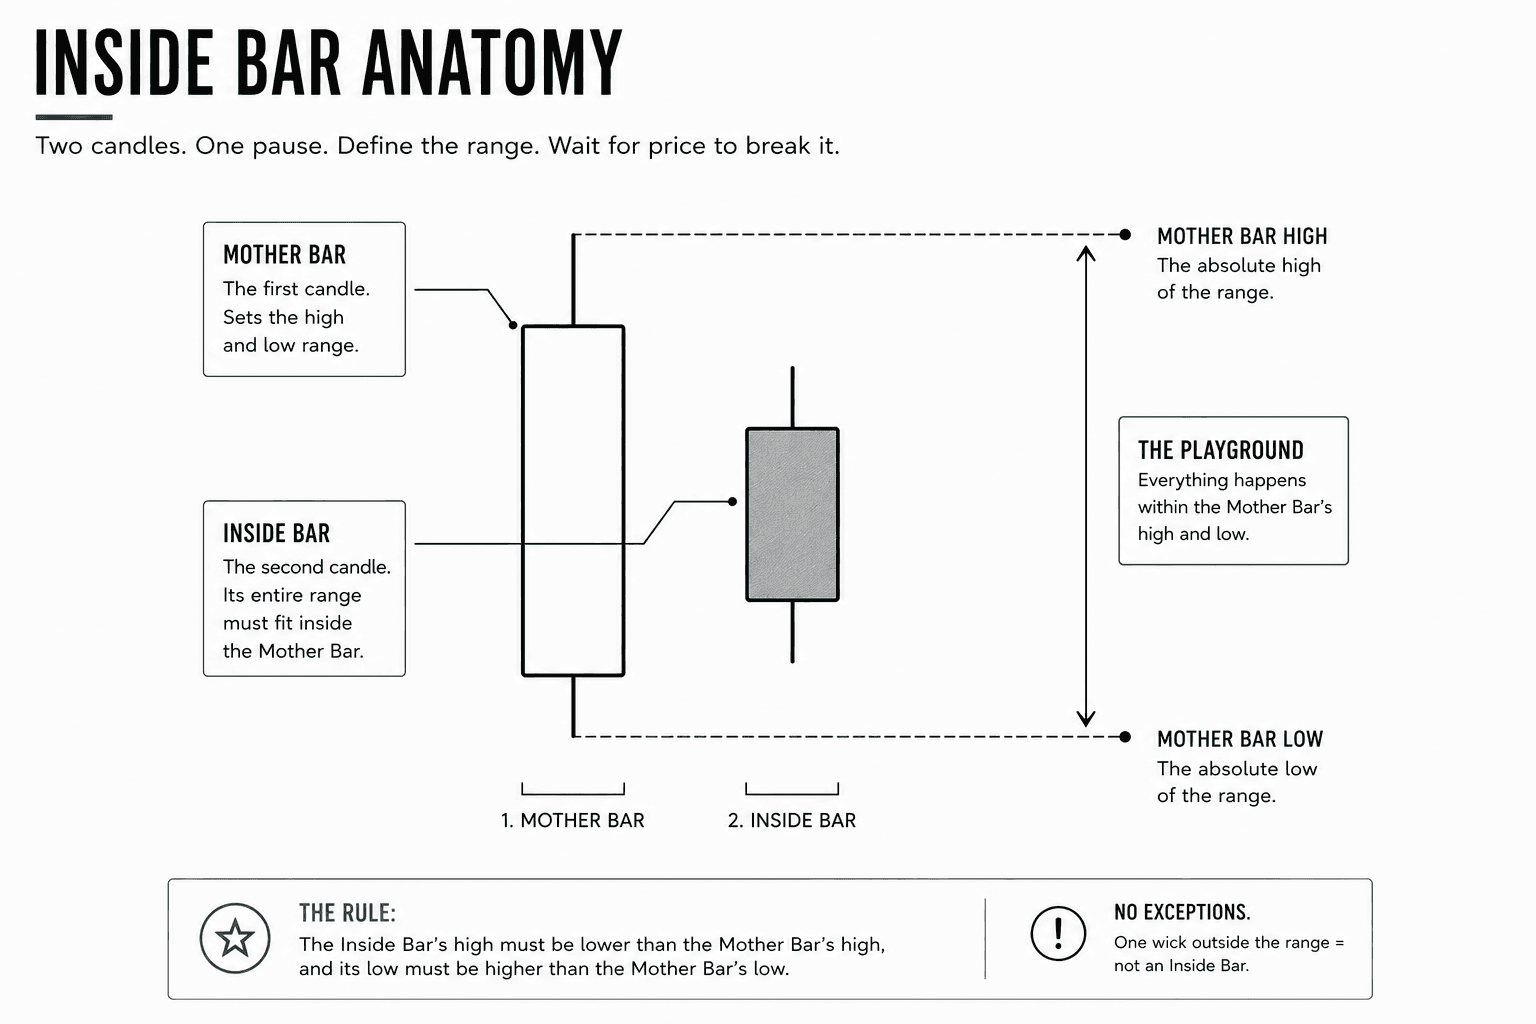
If the Mother Bar runs from 1.2400 to 1.2500, the inside bar’s high must be below 1.2500 and its low must be above 1.2400. If a single wick pokes even one micro-pip outside that boundary during the session, the pattern is instantly corrupted. It is no longer an inside bar; it’s just chaotic market noise.
2. What It Actually Represents (The Behavioral Script)
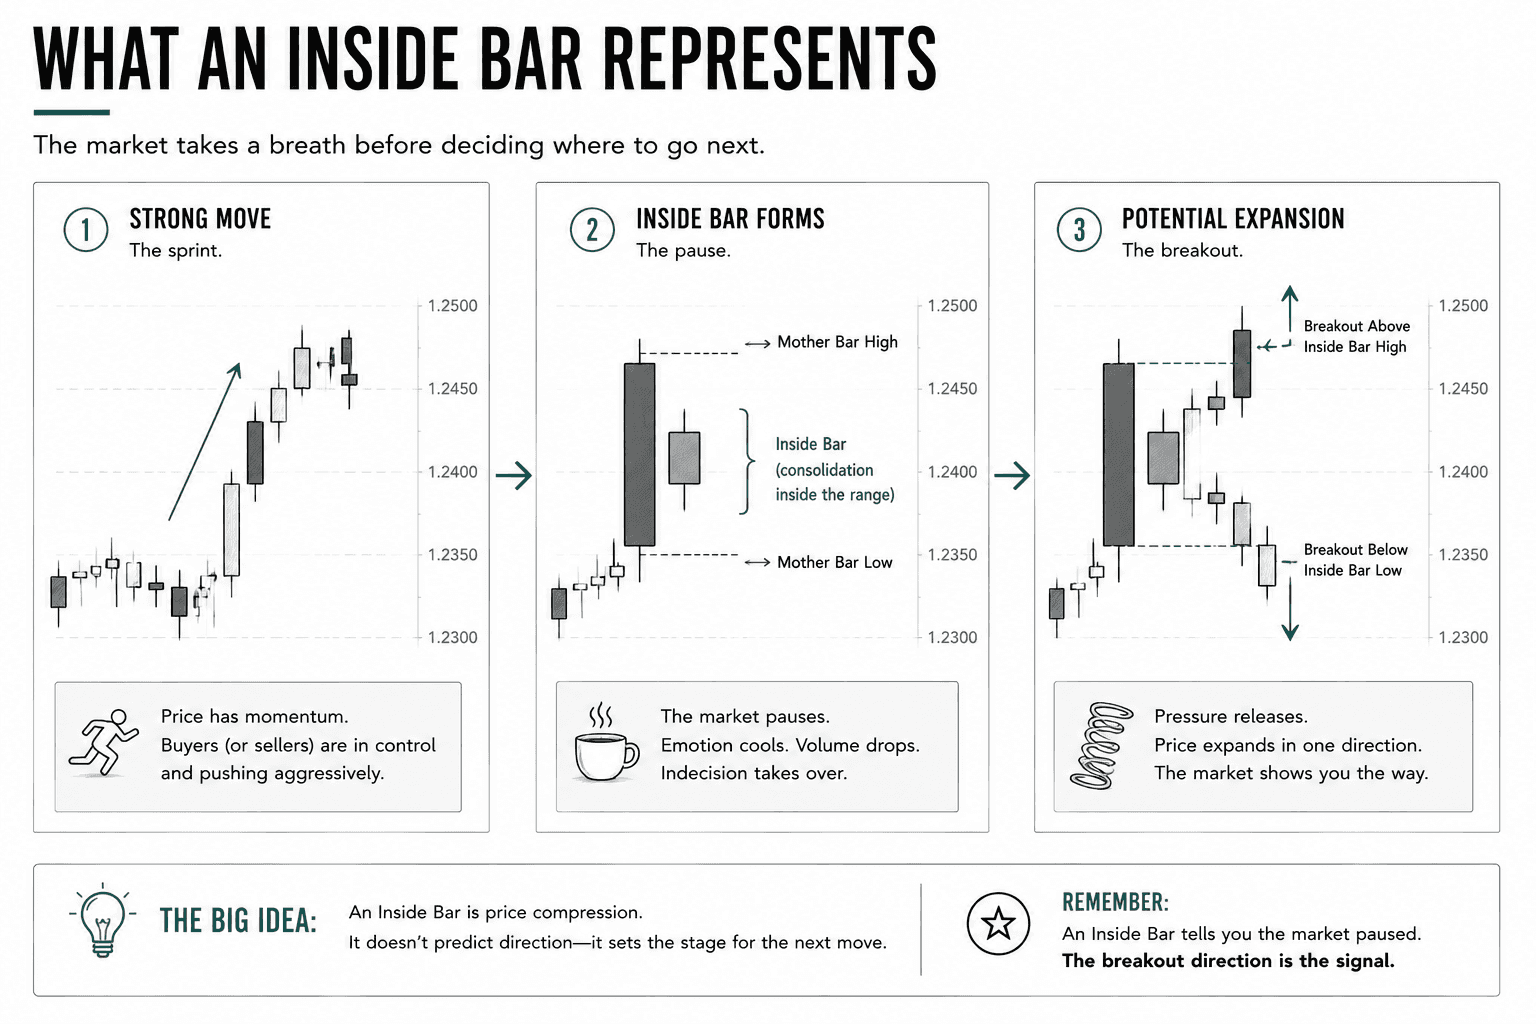
An inside bar reflects a temporary equilibrium between buyers and sellers—a moment of complete indecision following a big move. The market sprinted (the Mother Bar), got exhausted, and contracted into a tight huddle (the Inside Bar) to wait for a new fundamental catalyst.
Think of it as extreme price compression. The market is winding up a spring. The next significant candle will typically burst out of this range, and the direction of that breakout is your execution signal.
3. How to Execute the Setup (Without Getting Faded)
In an established, healthy trend, an inside bar is a beautiful sight. It represents a brief pause where institutional players are taking profit and reloading their clips before resuming the dominant path.
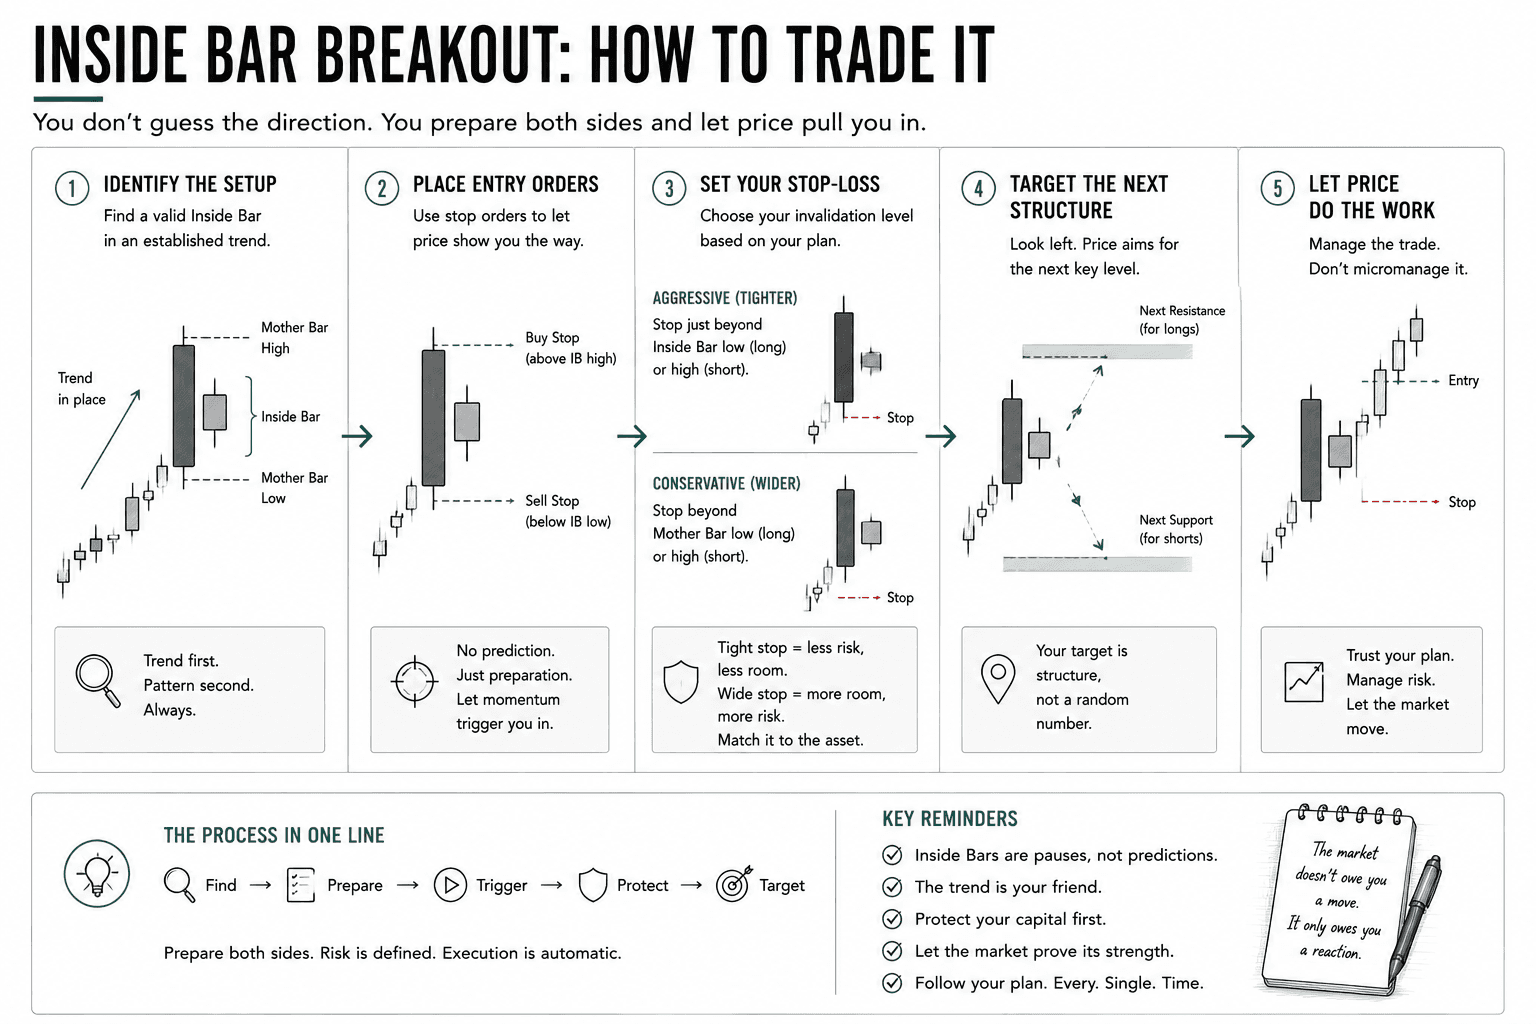
The Order of Operations:
The Trigger: For a bullish trend setup, you place a Buy Stop order just above the inside bar's high. For a bearish setup, you place a Sell Stop below its low. You are letting the market's momentum drag you into the trade.
The Invalidation Point (The Stop Loss): The standard protocol places the stop loss just below the inside bar’s low (for a long) or above its high (for a short). If you want to give the asset extra "breathing room" because you are trading a high-volatility commodity like Gold or Crude Oil, you anchor your invalidation point to the extreme edge of the Mother Bar.
The Interface Target: Look left on your chart. Your target is simply the next major structural level—the next high-timeframe daily resistance zone for longs, or support zone for shorts.
4. Things to Watch for: What Reduces the Pattern's Value
This is where retail traders lose their minds (and their account balances). They scan the charts, find an inside bar, and buy it immediately, completely ignoring the environmental regime. If you trade this pattern blindly, you are running a broken script.
The Choppy Market Trap
If the broader market is ranging in a directionless, horizontal swamp, inside bars will print constantly. They mean absolutely nothing here. In a range-bound regime, an inside bar breakout will almost always result in an immediate fakeout that tags your stop loss before reversing. The pattern requires a macro trend vector to be valid.
The Micro-Inside Bar
If the inside bar is laughably tiny—say, less than 10% of the Mother Bar’s total mass—it means the market has completely flatlined. While this indicates extreme compression, it often leads to a messy, high-variance environment with multiple false starts before the real move happens. Treat micro-candles with extreme suspicion.
Inside Bar Inception (The Stacking Chain)
Sometimes you will see a series of 3 or 4 inside bars nesting inside each other like Russian dolls.
While the eventual breakout from this level of compression can be explosive, the waiting period introduces massive execution uncertainty. Your platform will look like a chaotic ping-pong match of micro-wiggles that will tempt your ego to step in and manually sabotage the trade.
Success Criteria
After completing this lesson, you should be able to:
Confirm a valid Inside Bar by checking that the second candle's entire range (high to low) fits inside the first candle (the Mother Bar). No overlap, no exceptions.
Set passive entry orders (Buy Stop above, Sell Stop below) that let price pull you into the trade. You never guess the direction. The market shows you.
Place your stop-loss at the right level using either the Inside Bar edge (tighter, more aggressive) or the Mother Bar edge (wider, more breathing room) based on how the asset typically moves.
Read the environment first. If the chart shows sideways chop, low volume, or multiple Inside Bars stacked inside each other, you skip the setup entirely. No exceptions.
Common Misconception
Every Inside Bar is a breakout trade, and a green candle means price goes up.
The Truth: An Inside Bar tells you one thing: the market paused. That's it. The candle color means nothing here. Trade this pattern without checking the bigger trend first, and you're gambling. In choppy, sideways markets, an Inside Bar isn't building pressure for a big move. It's sitting in traffic. Price breaks one way, clips your stop, then reverses and runs the other direction.
FAQ's
Q: Can I trade inside bars on a 1-minute chart?
Q: What is the difference between an inside bar and a Harami candlestick pattern?
Q: Does the inside bar just have to close inside the Mother Bar, or do the wicks have to stay inside too?
Table of Contents
About Me

Krista Weber
After a career as a VP of UX and EdTech executive, I retired early—and quickly realized the traditional world of trading education is fundamentally broken.
As someone with a Master’s in HCI who specialized in the design of e-learning systems, I saw a massive gap: beginners aren't failing because trading is impossible; they’re failing due to massive cognitive overload and terrible instructional design.
This site bridges that gap. I’m applying the principles of learning science, systems thinking, and minimalist UX to strip away the market noise and teach trading the way it actually should be taught.
Stay in Touch
Some of the pages on my travel blog contain affiliate links. Whenever you buy something through one of these links, I get a small commission at no extra cost to you. As an affiliate, I only recommend products and services that I feel are high quality and helpful to my readers. Thanks for your support.
Read More

Open almost any trading platform and you'll see EUR/USD sitting next to XAU/USD, NQ, ES, and a dozen CFDs on stocks you've heard of. They all show up as candlesticks moving left to right, which quietly implies they're all the same kind of thing. They aren't. Before going deeper into any one of them, it's worth drawing the map.
Updated on Sep 6, 2026

Futures are standardized contracts tied to defined specifications and a future settlement date. They can look complex at first, but the mechanics become much clearer once you know what the contract specification controls. Here's what you actually need to know.
Updated on Sep 6, 2026

CFDs appear everywhere in retail trading – but most new traders couldn't explain exactly what they are or why that matters. Here's a plain-language breakdown, including the parts that most introductions skip.
Updated on Sep 6, 2026