
Your First Week Paper Trading (What to Expect)
Your first week in a trading platform is genuinely disorienting. Prices move in ways that don't match what you read. Decisions that seem obvious in hindsight aren't obvious in real time. This is completely normal . Here's what to actually expect, so you can make the most of the learning curve rather than fighting it.

Learning Path Stage 1: Foundations
Learning Level 1: Recognition
Primary Learning Objective
By the end of this lesson, you will be able to finish your first onboarding phase inside a simulated market. This includes getting fully comfortable with your order tools and recording how you feel during live trades - all without putting real money at risk.
If you've made it this far, you've probably read a stack of articles, memorized a handful of candlestick patterns, and maybe worked through BabyPips. At this point it's easy to feel like you're finally ready to trade.
You're not.
Then, Monday morning arrives. You boot up your platform, and the real-time user interface smacks you dead in the face.
Most retail traders treat their first week like an audition for a hedge fund. In reality, your first week is just a software onboarding phase. Here is the unvarnished day-by-day breakdown of the genuine psychological and mechanical friction you are about to encounter, optimized for cognitive survival.
1. The Day-by-Day Sandbox Roadmap
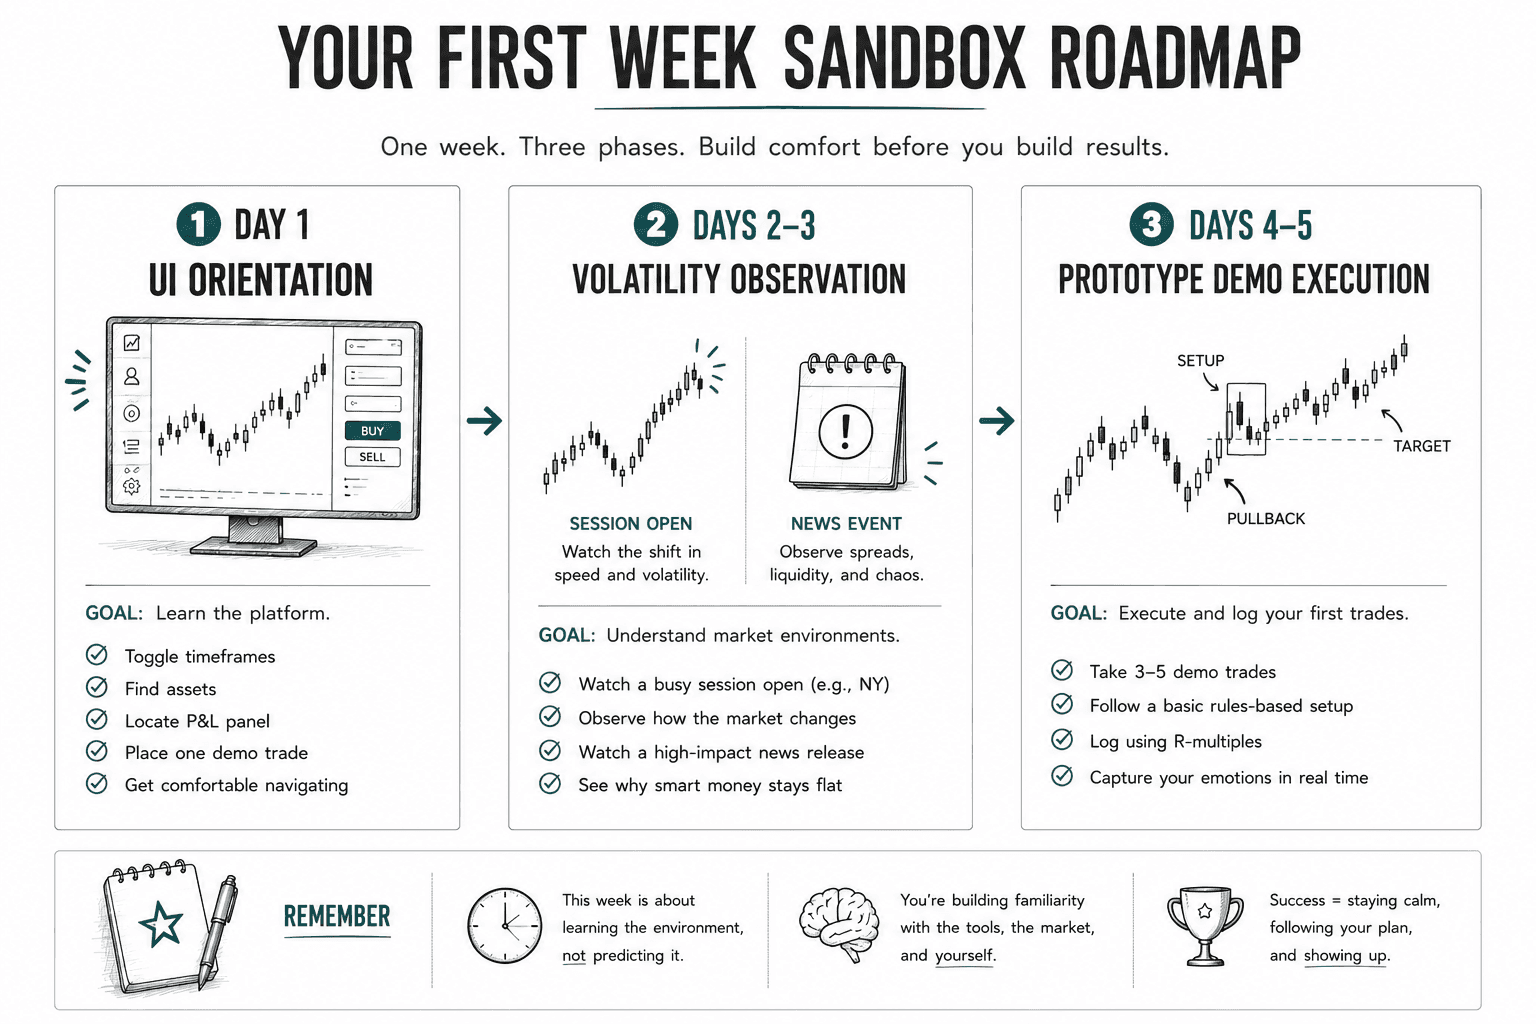
Day 1: The Platform Shock (System Orientation)
Your first day has absolutely nothing to do with reading market structure, spotting double tops, or predicting the future. Day one is entirely about preventing a total cognitive load collapse while navigating your trading terminal. It feels less like opening a piece of financial software and more like someone dropped you into the cockpit of a 747 five minutes before takeoff.
The textbooks showed you beautiful, static, historic charts. The live interface, however, looks like a chaotic arcade game. The latest candle is rapidly morphing shapes like a digital shapeshifter. The bid-ask spread is pulsing. Fifty flashing buttons are aggressively competing for your dopamine.
The Day 1 Protocol: Do not look for a setup. Your sole mission is basic software navigation. Learn how to toggle timeframes without freezing, locate your asset classes, find the open P&L panel, and successfully execute a single, zero-stake demo trade just to see where the buttons route.
Days 2 & 3: Environmental Observation (The Clock Check)
Now that you know how to operate the machinery without accidentally shorting the entire Nasdaq, spend the next 48 hours simply observing the market's different operating systems. Set an alarm for the major session opens:
The London Open (3:00 AM ET) or NY Open (9:30 AM ET): Watch the first 30 minutes. The chart will suddenly transform from a slow horizontal grind into a high-speed lane. You will witness massive algorithmic displacement and instantly understand why trying to trade the open with a rigid, tight stop is a mathematical error.
The High-Impact Data Release (FOMC/CPI): Check Forex Factory, clear your hands, and stand 2 minutes away from the screen before a major news print. Watch the order book completely hollow out, the spread widen into a canyon, and the price spike violently in both directions. This is your firsthand lesson in why smart money stays flat during macro news events.
Days 4 & 5: Launching the Demo Prototype (First Execution)
By Thursday, it’s time to take your first simulated trades using a basic, rules-based setup. This experience is designed to be profoundly humbling. You will immediately experience three fatal execution bugs:
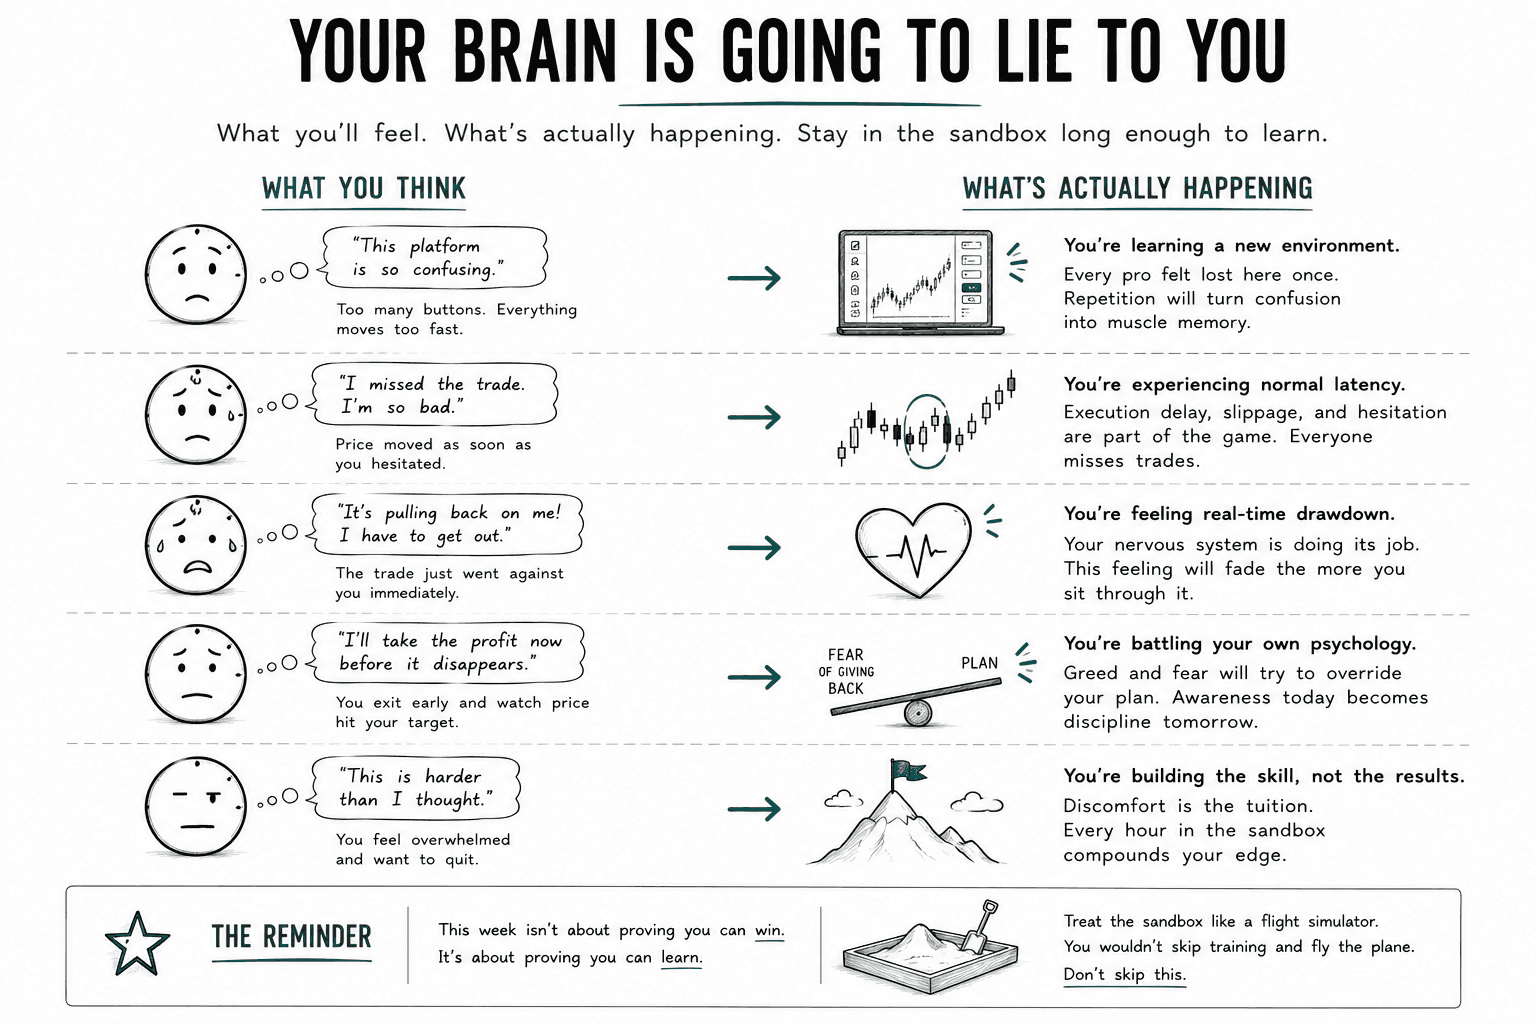
Chasing the Bus: The setup looks picture-perfect right up until you move your mouse to click entry, at which point the Nasdaq sweeps 15 points without you. You either panic-buy the top out of FOMO or hesitate waiting for "just a bit more confirmation" until the trade is in the next zip code.
The Immediate Pullback Panic: The absolute second you click "Buy," the market ticks down. It hasn’t broken your structural invalidation point yet, but watching your open P&L flash red in real-time triggers a visceral, sweating-palm emotional response that no weekend chart study could ever prepare you for.
The Early Exit Negotiation Loop: If the trade actually goes green and approaches your target, your brain will enter a toxic negotiation cycle: "Take the $20 profit right now before it reverses and makes you look stupid!" You manually override your framework out of pure greed, only to watch the asset cleanly expand right into your original target.
2. What Success Actually Looks Like in Week One
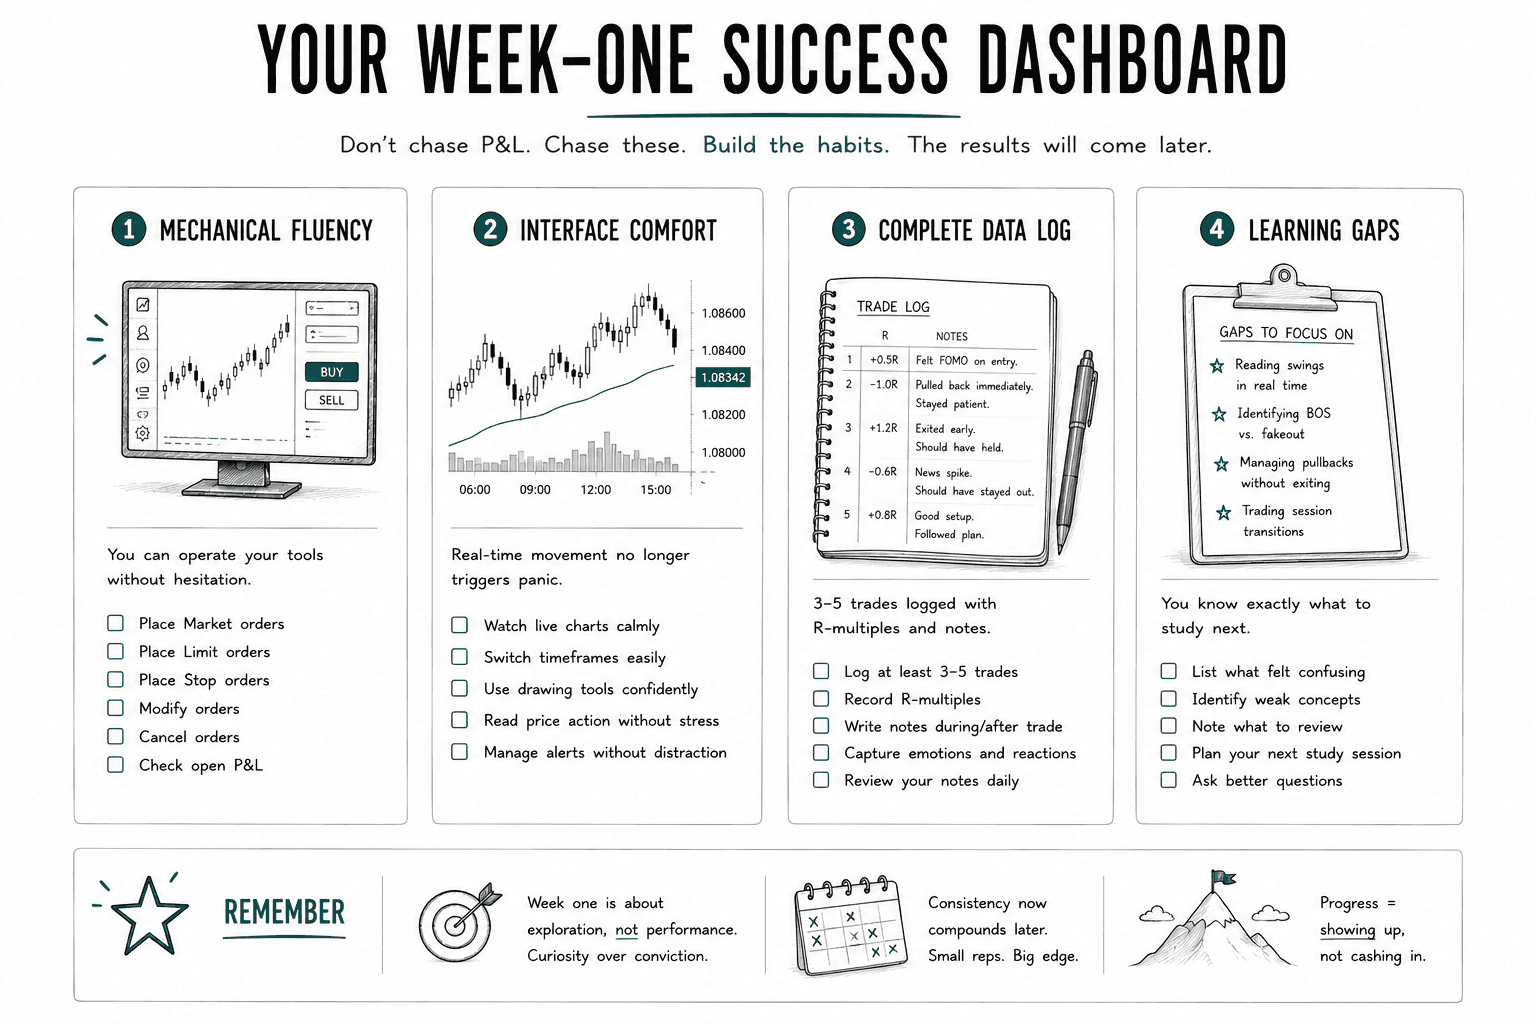
Stop measuring your first week by the balance in your simulated account. If your equity curve went straight up on your first five trades, congratulations: you got hit by a rogue wave of beginner’s luck. Mistaking that random variance for genuine technical skill is the number one cause of catastrophic real-money blowouts on week two.
Instead, score your performance against this strict QA Success Dashboard:
[ ] Mechanical Fluency: You can place Market, Limit, and Stop orders without freezing.
[ ] Interface Comfort: A moving real-time candle no longer triggers a fight-or-flight response.
[ ] Complete Data Log: 3 to 5 demo trades fully recorded in R-multiples, including emotional notes.
[ ] Gaps Documented: You have a written list of exactly which structural concepts felt completely blind.
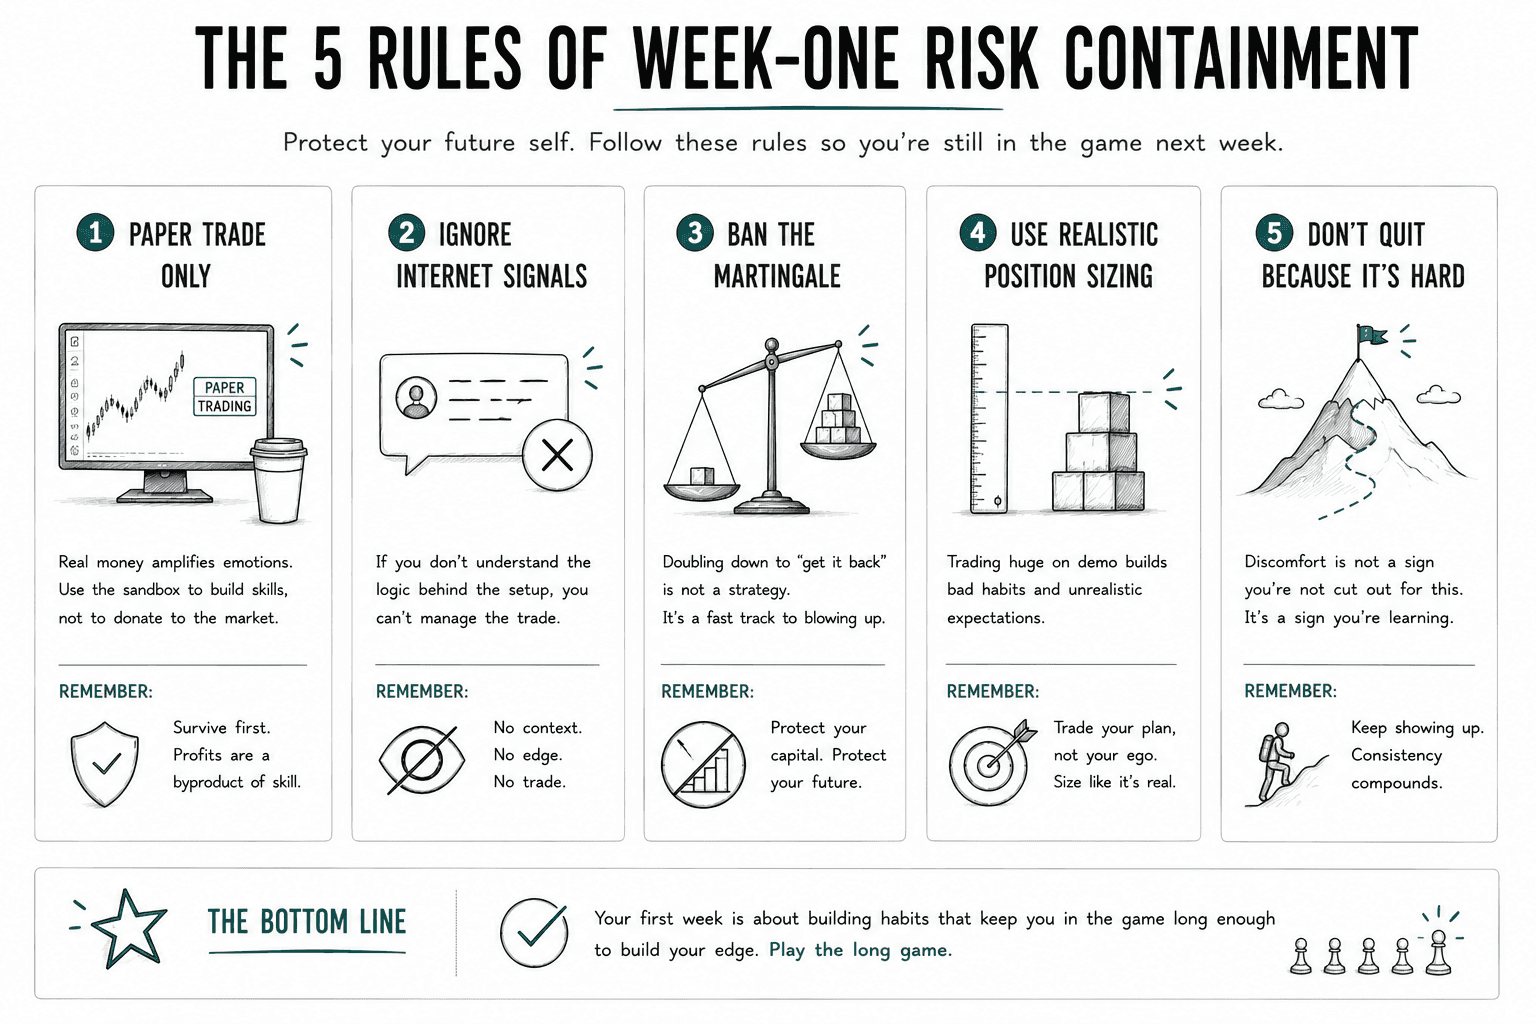
3. The 5 Rules of Week-One Risk Containment
To ensure you survive long enough to actually build a proprietary framework, hardcode these five constraints into your browser:
Do Not Trade Real Capital: If you open a live account and fund it with real money in week one, the market will treat you like an uninvited guest at an elite card table. Consider that deposit a donation to an institutional hedge fund. Demo first.
Ignore Internet Signals: Taking a live trade because some anonymous user on X or Discord posted a screenshot of a chart with a green arrow is complete intellectual bankruptcy. If you don't understand the underlying behavioral logic of the setup, you have zero structural capacity to manage the trade when it goes sideways.
Ban the Martingale Habit: If you lose a demo trade, do not double your contract size on the next position to "get it back." That is not risk management; it’s an emotional coping mechanism that will instantly get you liquidated in a live futures account.
Normalize Your Simulated Sizing: Do not trade 100 Lots on demo just because "it's fake money." Sizing like a cartoon character builds toxic psychological habits. Configure your demo account balance and contract sizes to match the exact financial reality of the live account you eventually intend to trade.
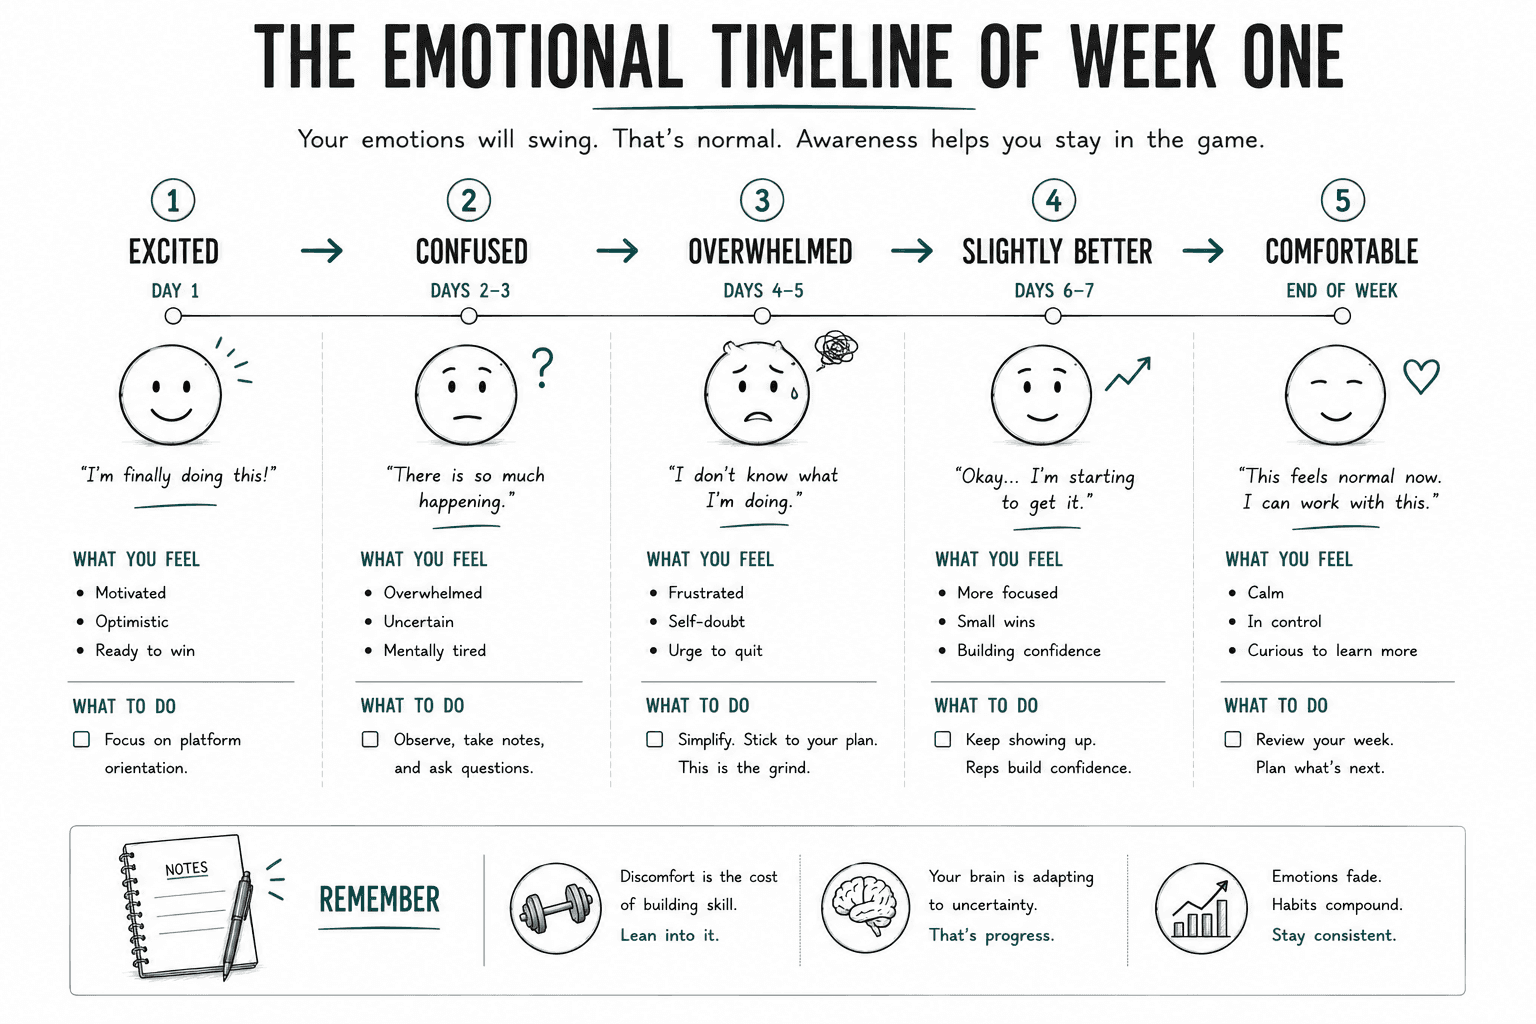
Don't Quit Because It's Hard: The market is supposed to be frustratingly complex at first. It is an environment of absolute uncertainty. The fact that you feel overwhelmed doesn't mean you lack aptitude; it just means your brain is building the cognitive infrastructure required to process raw data. Continue the script.
Success Criteria
After completing this lesson, you should be able to:
Place Market, Limit, and Stop orders cleanly during busy session hours. No freezing. No fumbling.
Spot the structural shifts in volatility when a major session opens and when a high-impact news event drops.
Size your positions the same way you will with real capital. No inflating trades because "it's fake money."
Log 5 trades. Write down exactly what went through your head emotionally.
Common Misconception
If I can spot winning setups on replay charts, I'll get the same results live on Monday morning.
The Truth: Replay charts strip out the hardest part of trading: sitting through uncertainty in real time. Charts teach you the shapes. Real-time simulation trains your body to handle the stress of not knowing what comes next.
FAQ's
Q: Should I be hitting a specific profit target by Friday?
Q: How much should I risk in my first week?
Q: Why does the market look so simple on a replay chart, but look like pure, unreadable chaos in real time?
Table of Contents
About Me

Krista Weber
After a career as a VP of UX and EdTech executive, I retired early—and quickly realized the traditional world of trading education is fundamentally broken.
As someone with a Master’s in HCI who specialized in the design of e-learning systems, I saw a massive gap: beginners aren't failing because trading is impossible; they’re failing due to massive cognitive overload and terrible instructional design.
This site bridges that gap. I’m applying the principles of learning science, systems thinking, and minimalist UX to strip away the market noise and teach trading the way it actually should be taught.
Stay in Touch
Some of the pages on my travel blog contain affiliate links. Whenever you buy something through one of these links, I get a small commission at no extra cost to you. As an affiliate, I only recommend products and services that I feel are high quality and helpful to my readers. Thanks for your support.
Read More

Open almost any trading platform and you'll see EUR/USD sitting next to XAU/USD, NQ, ES, and a dozen CFDs on stocks you've heard of. They all show up as candlesticks moving left to right, which quietly implies they're all the same kind of thing. They aren't. Before going deeper into any one of them, it's worth drawing the map.
Updated on Sep 6, 2026

Futures are standardized contracts tied to defined specifications and a future settlement date. They can look complex at first, but the mechanics become much clearer once you know what the contract specification controls. Here's what you actually need to know.
Updated on Sep 6, 2026

CFDs appear everywhere in retail trading – but most new traders couldn't explain exactly what they are or why that matters. Here's a plain-language breakdown, including the parts that most introductions skip.
Updated on Sep 6, 2026