Ascending vs Descending Triangles
One boundary holds, the other moves, and the side that is moving is the side showing increasing urgency. That moving side is where the lean comes from.

Learning Path Stage 3: Chart Patterns
Learning Level 2: Understanding
Primary Learning Objective
By the end of this lesson, you will be able to identify ascending and descending triangle formations and explain what the converging structure reveals about the balance between buyers and sellers.
The previous article introduced the triangle as a market compressing toward a decision, and mentioned that it comes in three forms. The symmetrical version is the neutral one. The two that carry an actual behavioral lean are the ascending and descending triangles. They are worth a closer look, because they are the clearest case of a shape telling you a small, readable story about who is winning.
The two shapes
Both are triangles, so both are markets where the swing range is narrowing. The difference is which boundary stays still and which one moves.
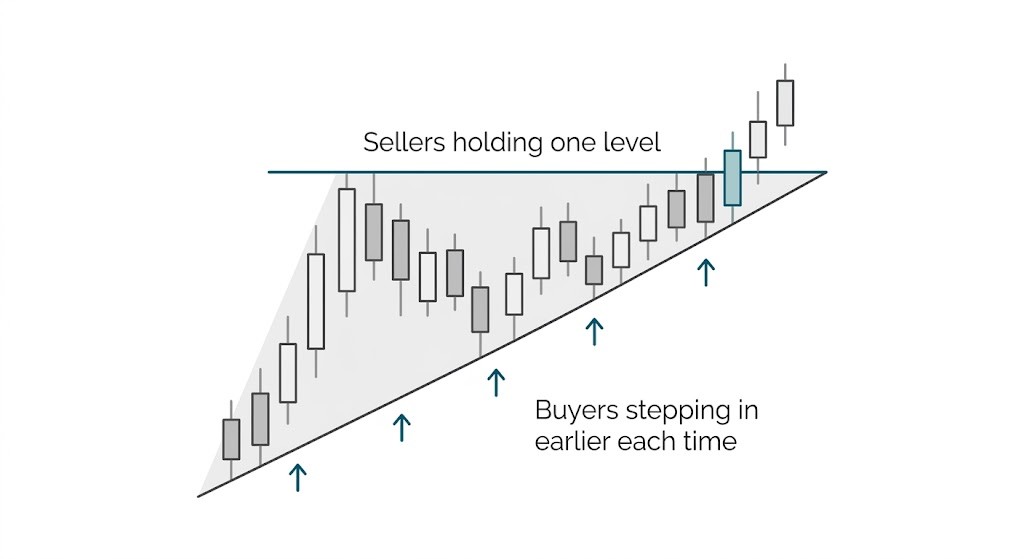
An ascending triangle has a flat top and a rising bottom. Price keeps bumping into the same ceiling, failing, and falling back, but each fall stops a little higher than the last. The lows climb. The highs do not.
A descending triangle is the mirror image. It has a flat bottom and a falling top. Price keeps dropping to the same floor, holding, and bouncing, but each bounce gives up a little sooner than the last. The highs fall. The lows do not.
The behavior in an ascending triangle
The flat top and rising bottom describe a specific situation. There is a price level where sellers reliably show up. Every time price reaches that ceiling, enough selling appears to stop it and push it back down.
But the rising lows tell the more interesting half of the story. Buyers are no longer waiting for the old, lower prices. They are stepping in earlier and earlier, accepting higher and higher entry points rather than waiting for a discount. Their willingness to pay is increasing with each swing.
So an ascending triangle is a picture of buyers growing more eager while sellers hold a fixed line. The space between the two is being squeezed from below. The common reading is that this leans bullish, because the side that is changing its behavior, the side showing increasing urgency, is the buyers. If that ceiling finally gives way, the expected move is an upward breakout.
The behavior in a descending triangle
The descending triangle is the same logic in reverse. There is a floor where buyers reliably appear and hold price up. But the falling highs say sellers are no longer waiting for higher prices to sell into. They are accepting lower and lower exit points, showing increasing urgency to get out.
So a descending triangle is a picture of sellers growing more eager while buyers hold a fixed line. The squeeze comes from above. The common reading is that this leans bearish, and if the floor breaks, the expected move is a downward breakout.

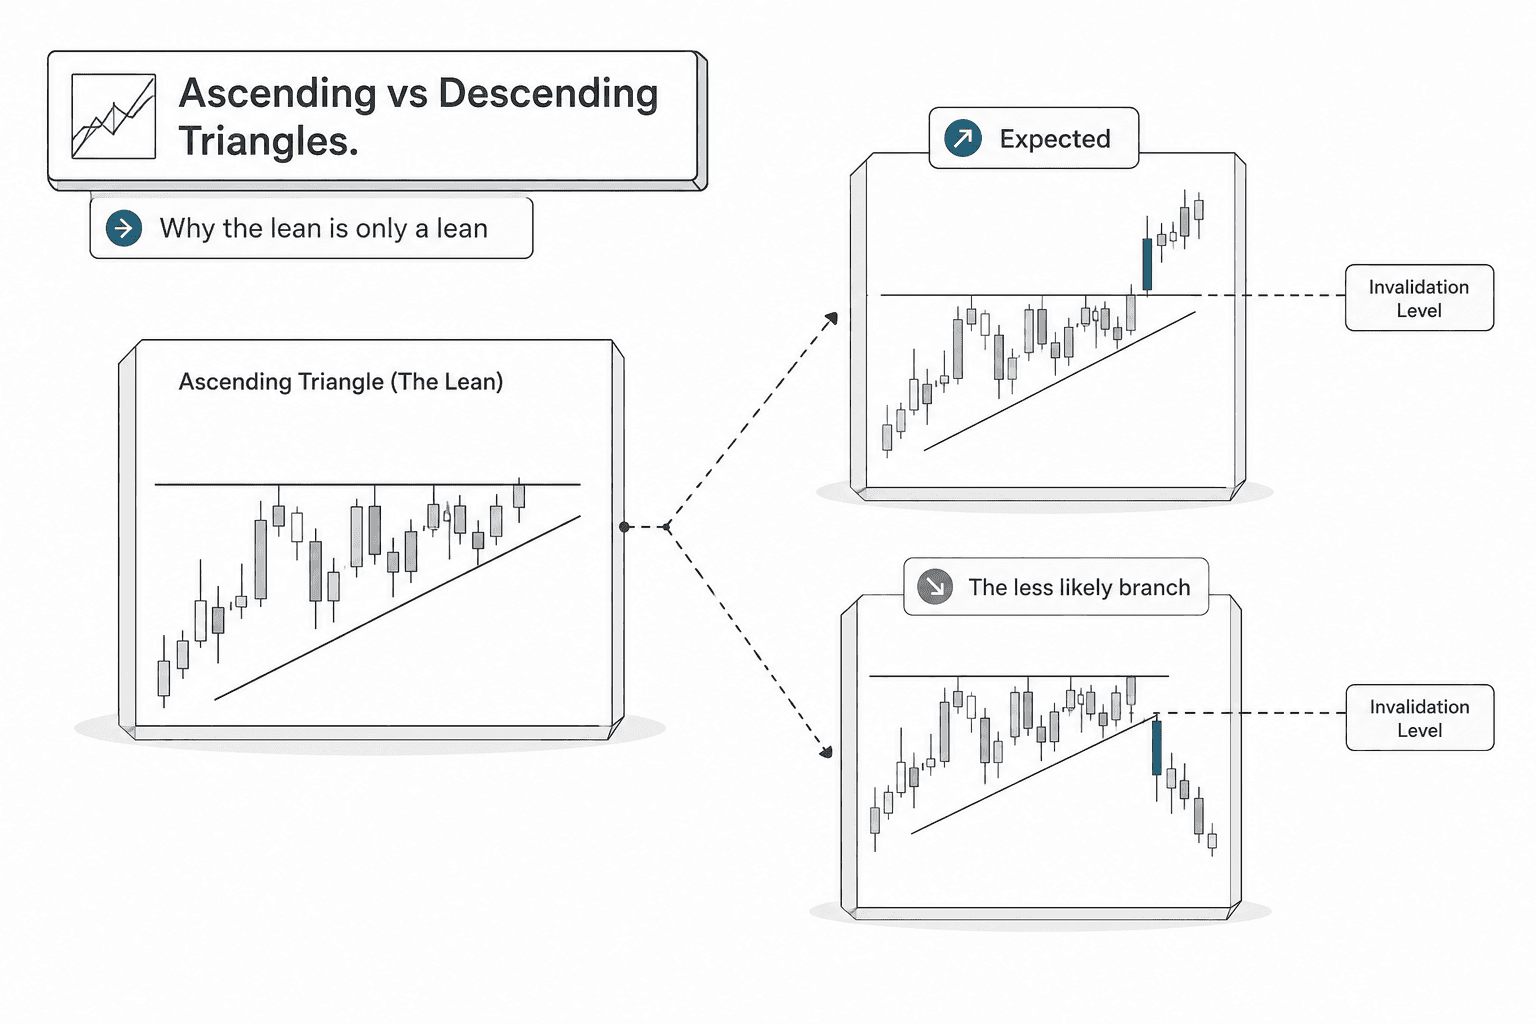
Why the lean is only a lean
Here is where this needs an honest qualifier, the same one that runs through this whole stage.
The bullish and bearish leans of these triangles are tendencies, not promises. An ascending triangle can break downward. A descending triangle can break upward. It happens often enough that you have to expect it rather than be wounded by it.
The reason is that the flat line, the level being defended, is itself information. The flat top of an ascending triangle is a wall of sellers. Usually that wall eventually cracks under the pressure of increasingly eager buyers. But sometimes the wall holds, the buyers run out of conviction first, and price drops through the rising support instead. The pattern's failure is not the pattern misbehaving. It is just the less likely branch happening.
A useful way to hold this: an ascending triangle is a hypothesis that says buyers will probably win this particular standoff. A hypothesis has a built-in chance of being wrong, and that is exactly why you decide your invalidation point in advance, while you are calm, before anything is at stake.
A quick caution about the flat line
One concrete detail beginners miss. The flat line is rarely perfectly flat. The ceiling of an ascending triangle might be a narrow band rather than an exact price. Price could push slightly above it and come back, or stall just short of it. Treat the flat boundary as a small zone, not a laser line. If you demand perfection, you will either never find these patterns or you will reject good ones for cosmetic reasons.
The same goes for the sloping line. The rising lows of an ascending triangle will not sit on a flawless straight line. They just need to be clearly, visibly climbing.
What to take from this
Ascending and descending triangles are the friendliest patterns for practicing behavioral reading, because the story is so legible. One boundary holds, the other moves, and the side that is moving is the side showing increasing urgency. That moving side is where the lean comes from.
Read them that way. An ascending triangle is buyers getting impatient against a fixed ceiling. A descending triangle is sellers getting impatient against a fixed floor. The lean follows the impatience. Then remember it is only a lean, decide ahead of time where you would be proven wrong, and you are reading the pattern the way it deserves to be read.
Success Criteria
After completing this lesson, you should be able to draw valid trendlines for each triangle type, explain the behavioral difference between ascending and descending triangles, and identify the standard entry and invalidation levels for each.
Common Misconception
The direction of a triangle reliably predicts the breakout direction.
The Truth: Ascending triangles break upward more often than not, but not always, and trading confirmation rather than anticipating direction produces better results.
FAQ's
Q: What is a descending triangle and what does it signal?
Q: Can ascending triangles break to the downside?
Q: What is an ascending triangle and what does it signal?
Table of Contents
About Me

Krista Weber
After a career as a VP of UX and EdTech executive, I retired early—and quickly realized the traditional world of trading education is fundamentally broken.
As someone with a Master’s in HCI who specialized in the design of e-learning systems, I saw a massive gap: beginners aren't failing because trading is impossible; they’re failing due to massive cognitive overload and terrible instructional design.
This site bridges that gap. I’m applying the principles of learning science, systems thinking, and minimalist UX to strip away the market noise and teach trading the way it actually should be taught.
Stay in Touch
Some of the pages on my travel blog contain affiliate links. Whenever you buy something through one of these links, I get a small commission at no extra cost to you. As an affiliate, I only recommend products and services that I feel are high quality and helpful to my readers. Thanks for your support.
Read More

Breakout trading is the practice of entering a position the moment price moves beyond a defined level of support or resistance. It sounds simple, and it is, in structure. The challenge is that most breakouts are false.
Updated on Jun 12, 2026

Why matching a strategy to your cognitive style matters more than finding the 'best' one.
Updated on Apr 27, 2026

Before exploring individual strategies, it's worth asking a more fundamental question: what actually counts as a trading strategy? The answer shapes everything.
Updated on Apr 27, 2026