Double Top & Double Bottom: The Market’s “One More Try” Pattern

Learning Path Stage 3: Chart Patterns
Learning Level 2: Understanding
Primary Learning Objective
By the end of this lesson, you will be able to identify ascending and descending triangle formations and explain what the converging structure reveals about the balance between buyers and sellers.
If Head & Shoulders is the dramatic theater kid of chart patterns, Double Tops and Double Bottoms are its quieter, more practical cousins.
No complicated mountain range.
No oddly specific anatomy references (with the exception of a neckline).
Just:
“The market tried twice and failed.”
Even though I still sometimes think these naming choices are weird, they make sense.
Because underneath the pattern itself is a very human behavior. Testing a level again to see if it still holds
Sometimes it does.
Sometimes it absolutely does not.
Very relatable, honestly. Kind of like my dogs begging for a treat after they just had one. Sometimes I give in, sometimes I do not. Never mind. I usually give in.
What Is a Double Top?
A Double Top is a bearish reversal pattern that forms after an uptrend.
Price pushes upward, pulls back, then returns to roughly the same high again before failing.
Visually, it looks like:
peak
pullback
second peak
rejection
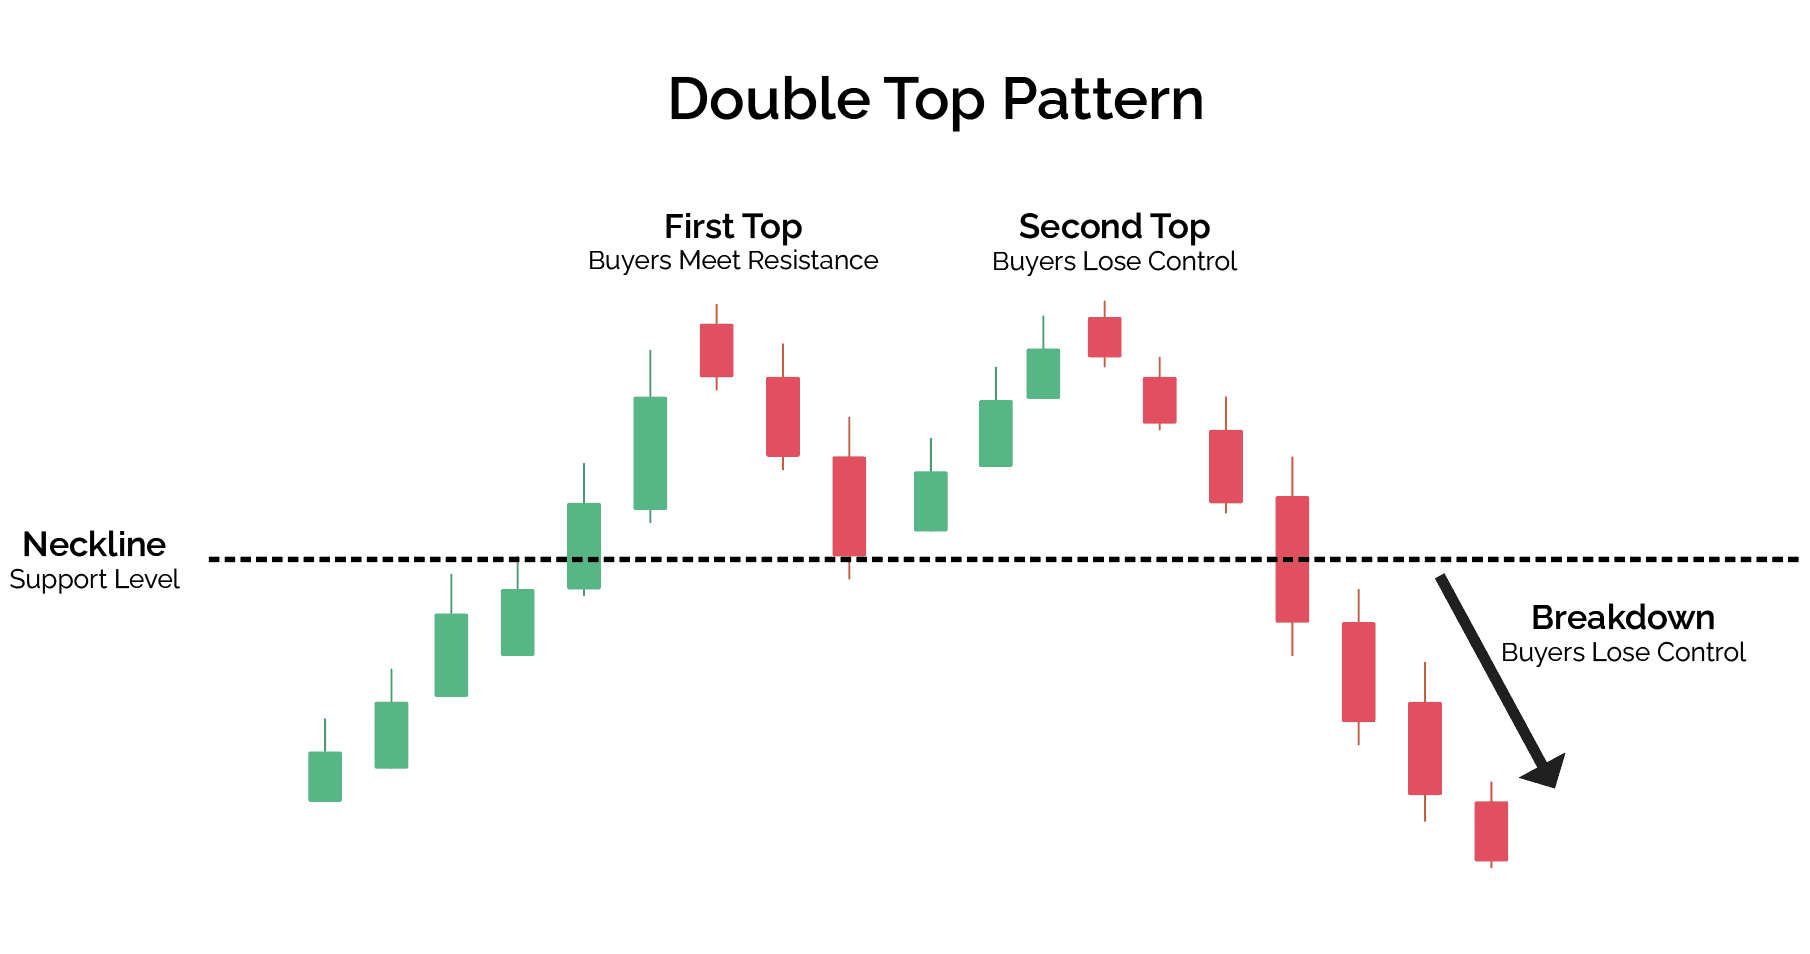
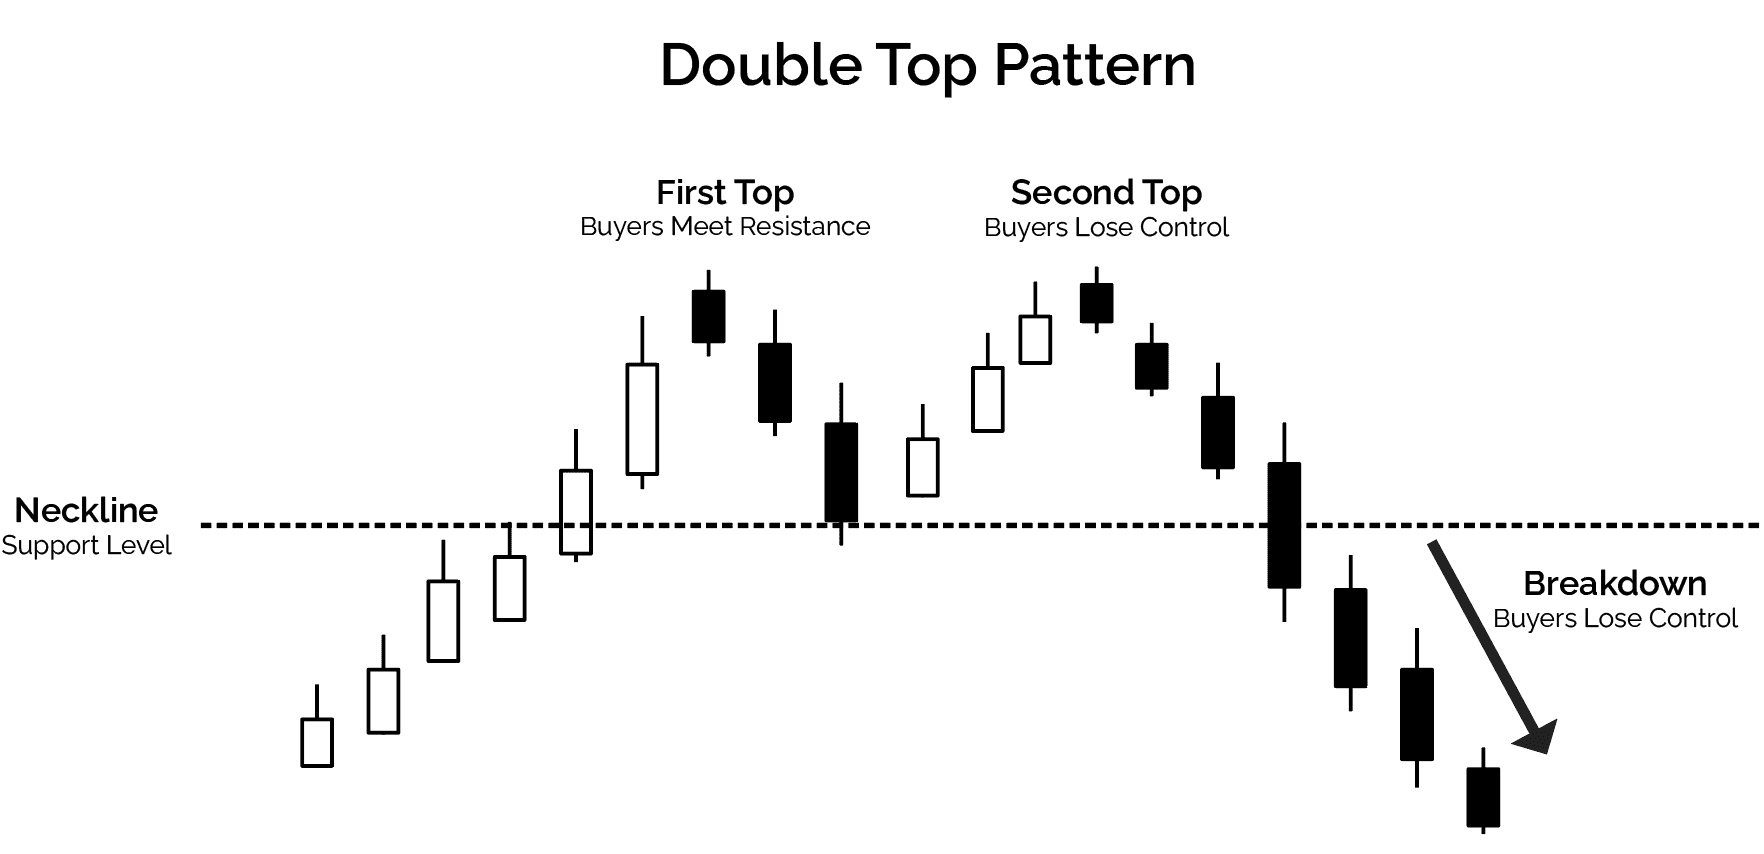
The key idea is: Buyers attempted to continue the trend but could not break through resistance
Failure in this case is not a bad thing. It's something to pay attention to. Because markets pay attention to failed attempts.
What Is a Double Bottom?
A Double Bottom is simply the bullish version.
Price:
falls
bounces
revisits the low
then holds and reverses upward
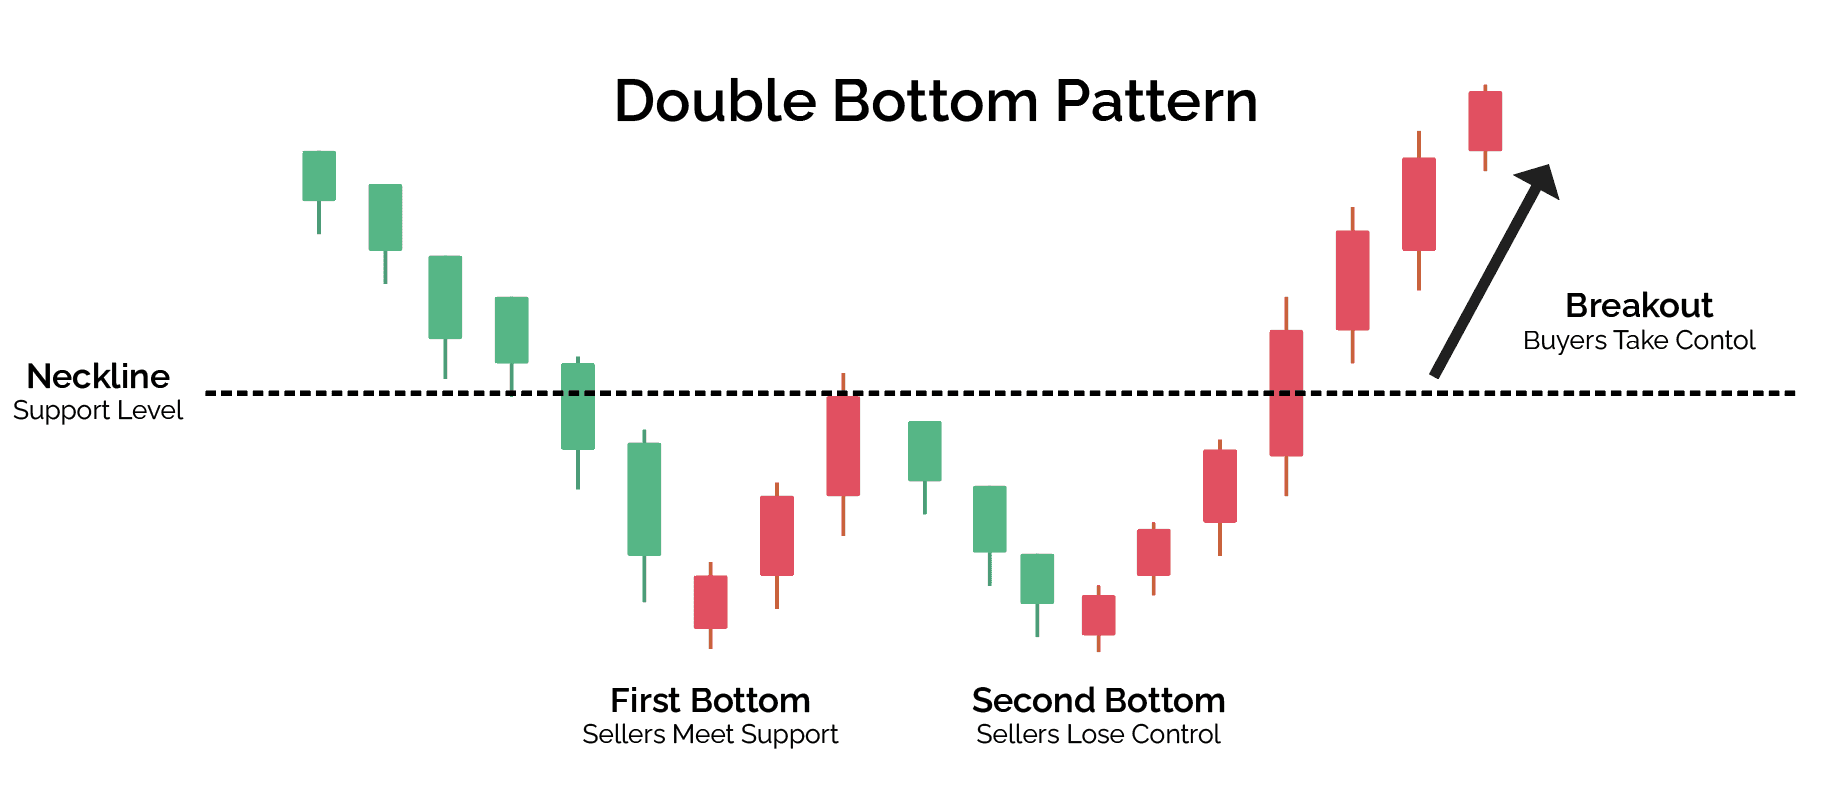
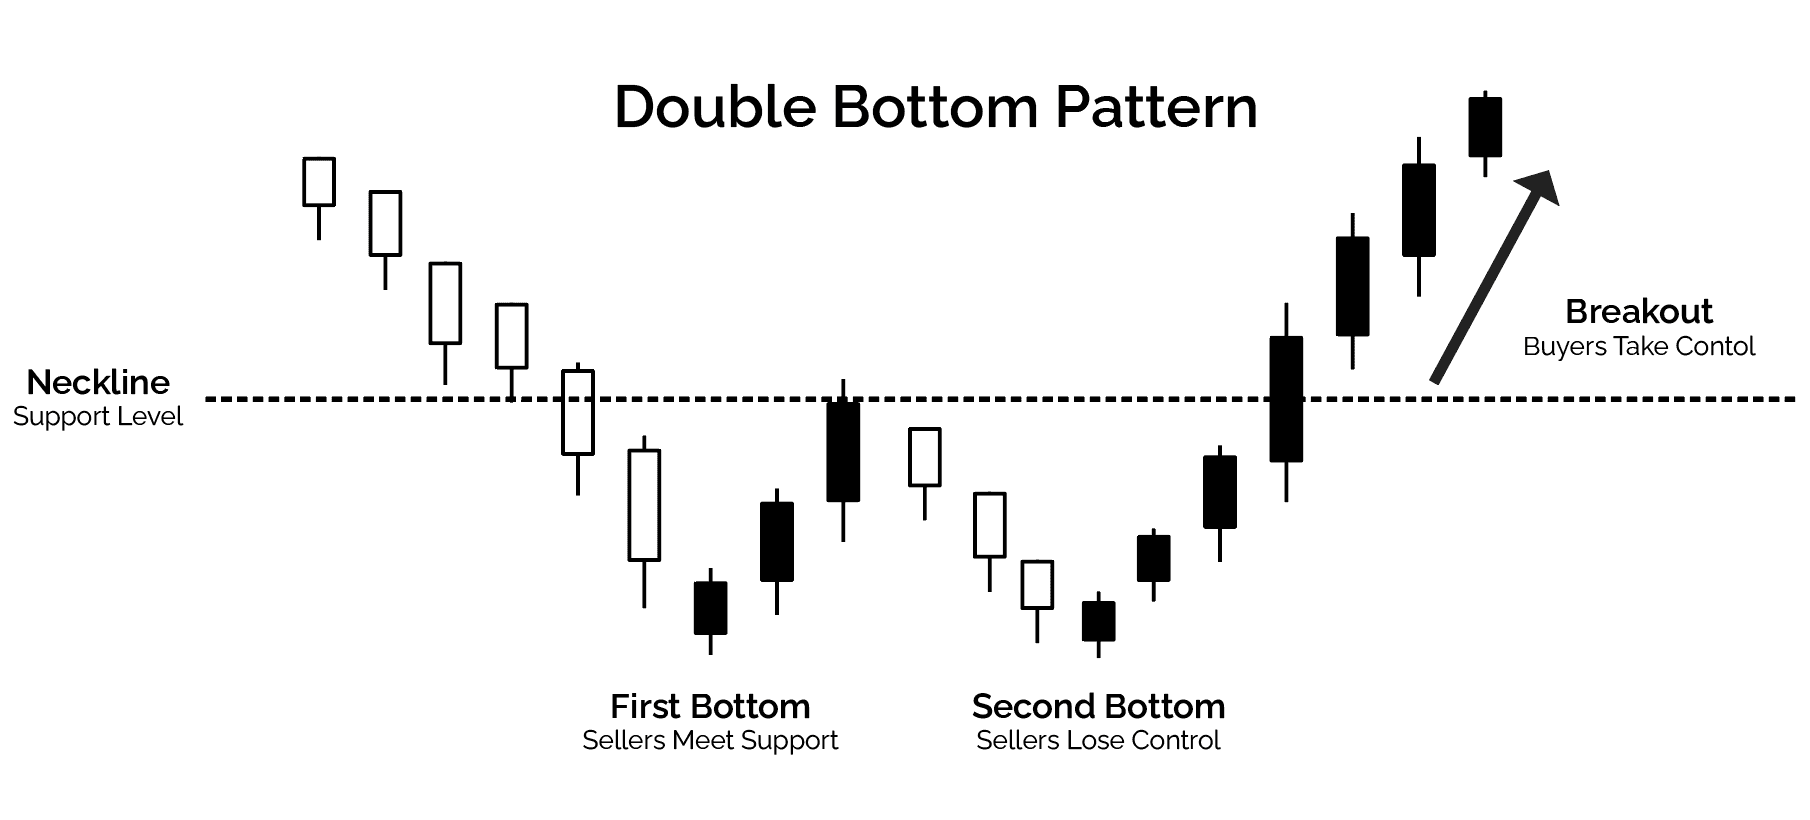
Here the story becomes: Sellers tried to push lower again but lost momentum
Same psychology as double top, just a different direction.
Why These Patterns Matter
Double Tops and Bottoms are basically tests of conviction.
The market revisits an important level and asks, “Do traders still agree this level matters?”
If price fails to break through that often signals weakening momentum.
This is why these patterns are closely connected to:
support
resistance
and psychology
It's not magic, just repeated behavioral reactions around key levels.
Resistance and Support Are the Real Story
The pattern itself is not the point. The level is the point.
A Double Top works because:
price previously struggled there
traders remember that level
sellers become active again
buyers hesitate
Likewise, a Double Bottom works because:
buyers previously defended the area
sellers fail to continue downward
confidence shifts
This is one reason experienced traders care deeply about context.
A random “M shape” floating in the middle of nowhere means very little.
But a Double Top forming at:
major resistance
previous highs
key psychological levels
or after extended momentum?
Now traders start paying attention.
The UX Version of This Pattern
Here’s the simplest mental model:
Double Tops and Bottoms are failed continuation attempts
The market tries again, and the second attempt tells you:
whether momentum still exists
or whether exhaustion is creeping in
That’s the real signal.
Why Beginners Love These Patterns
Because they’re easy to see.
Very easy.
Possibly too easy.
Once you learn Double Tops and Bottoms, your brain suddenly starts spotting them:
constantly
everywhere
on every timeframe
in cloud formations
Pattern recognition is both a superpower and a threat.
Humans are extremely good at finding meaning in visual information.
Sometimes a little too good.
What Makes a Double Top “Stronger”?
Not all Double Tops are equally meaningful.
Traders often look for:
strong prior trend
clean rejection
clear resistance level
volume shifts
momentum slowing on the second push
Really important nugget of double top information: The second top often looks weaker.
Examples:
smaller candles
more hesitation
rejection wicks
lower momentum
That weakening behavior matters more than perfect symmetry.
Confirmation Matters
This is where many beginners get trapped.
A Double Top is not confirmed simply because price touched the level twice.
The market can absolutely:
pause
consolidate
then blast higher anyway while thumbing its nose at your double top.
That's why seasoned traders often wait for breakdown confirmation
Meaning they wait until price breaks below the pullback low between the two peaks.
That level acts similarly to the neckline in Head & Shoulders.
Without confirmation occurring, sometimes you’re just watching normal consolidation.
Double Bottom Psychology
Double Bottoms are interesting because they often form after emotional selling.
The first low creates:
fear
panic
aggressive bearish momentum
Then price bounces.
When price revisits the low, traders watch closely and ask, “Will sellers regain control?”
If they fail, the emotional balance starts shifting.
That failure to continue downward can become very powerful psychologically. Especially if trapped sellers begin exiting positions.
One Thing That Surprised Me
When I first started learning chart patterns, I assumed the shape itself was the signal.
Now I think the shape is mostly a visual shortcut for understanding market behavior.
Double Tops and Bottoms work best when they reveal:
hesitation
exhaustion
trapped traders
weakening momentum
or repeated defense of a key level
The geometry alone is not enough.
Common Beginner Mistakes
Treating Every Retest as a Pattern
Sometimes price simply revisits a level. That alone does not make it meaningful.
Context matters.
Ignoring Trend Strength
Trying to short every Double Top during an extremely strong trend can become… educational. Very educational.
Sometimes the market pauses before continuing aggressively upward.
Reversal patterns are probabilities, not guarantees.
Obsessing Over Perfect Symmetry
Real markets are messy. The tops and bottoms will not always align perfectly.
The important thing is:
the behavior
the rejection
and the reaction around the level
Not whether your chart resembles a textbook illustration.
Why These Patterns Have Lasted So Long
Double Tops and Bottoms survive because they represent recurring human behavior.
People:
hesitate at important levels
remember prior reactions
become trapped emotionally
and react collectively to visible structure
That has been true for decades. Probably centuries.
Technology changes.
Human psychology mostly doesn’t.
Architect’s Tip
The best way to think about these patterns is not scanning your charts looking for M's or W's.
You can start there, but you need to then ask what changed emotionally between the first test and the second?
That question leads you much closer to understanding:
momentum
participation
and behavioral shifts
Which is where the real value of chart patterns lives.
Closing Thought
Double Tops and Double Bottoms are some of the first patterns traders learn because they’re visually simple and psychologically intuitive.
The market tries once.
Then tries again.
And the second attempt reveals whether:
momentum still exists
orexhaustion is starting to take over
That’s the real story underneath the pattern. Not the shape itself. The behavior behind it.
Success Criteria
After completing this lesson, you should be able to draw valid trendlines for each triangle type, explain the behavioral difference between ascending and descending triangles, and identify the standard entry and invalidation levels for each.
Common Misconception
The direction of a triangle reliably predicts the breakout direction.
The Truth: Ascending triangles break upward more often than not, but not always, and trading confirmation rather than anticipating direction produces better results.
FAQ's
Q: What is a double bottom pattern?
Q: How reliable are double top and double bottom patterns?
Q: What is a double top pattern?
Table of Contents
About Me

Krista Weber
After a career as a VP of UX and EdTech executive, I retired early—and quickly realized the traditional world of trading education is fundamentally broken.
As someone with a Master’s in HCI who specialized in the design of e-learning systems, I saw a massive gap: beginners aren't failing because trading is impossible; they’re failing due to massive cognitive overload and terrible instructional design.
This site bridges that gap. I’m applying the principles of learning science, systems thinking, and minimalist UX to strip away the market noise and teach trading the way it actually should be taught.
Stay in Touch
Some of the pages on my travel blog contain affiliate links. Whenever you buy something through one of these links, I get a small commission at no extra cost to you. As an affiliate, I only recommend products and services that I feel are high quality and helpful to my readers. Thanks for your support.
Read More

Breakout trading is the practice of entering a position the moment price moves beyond a defined level of support or resistance. It sounds simple, and it is, in structure. The challenge is that most breakouts are false.
Updated on Jun 12, 2026

Why matching a strategy to your cognitive style matters more than finding the 'best' one.
Updated on Apr 27, 2026

Before exploring individual strategies, it's worth asking a more fundamental question: what actually counts as a trading strategy? The answer shapes everything.
Updated on Apr 27, 2026