Head & Shoulders: The Chart Pattern Everyone Learns First
Most traders learn the Head & Shoulders pattern as a shape to memorize. But underneath the strange name and mountain-like structure is something much more important: momentum exhaustion. This article breaks down the psychology behind the pattern, why traders watch it, and how to stop seeing chart patterns as magic drawings and start seeing them as behavior stories.

Learning Path Stage 3: Chart Patterns
Learning Level 2: Understanding
Primary Learning Objective
By the end of this lesson, you will be able to identify a head and shoulders pattern, understand the behavioral logic behind it, and apply realistic expectations about its reliability.
Learning to Read Momentum Exhaustion (Without the Drama)
If you spend five minutes looking at technical analysis tutorials, you’ll realize the entire discipline sounds like it was invented by someone rummaging through a medieval garage sale. We are tracking price action using:
Candles and wicks
Hammers and flags
Cups, handles, and wedges
At some point, you just have to accept the terminology. But the absolute peak of this strange naming convention happens when someone points to a multi-billion-dollar financial index and says, "Look, it made a giant head and two little shoulders."
Your natural human reaction should be: "Are we seriously naming institutional macro-structures after body parts now?"
Yes, we are. But underneath the goofy anatomy lesson is a piece of brilliant visual architecture. Once you stop treating chart patterns like magical drawings and start treating them as user research data on crowd behavior, the market gets a lot more interesting.
Let's look at the psychological wireframe of the Head & Shoulders pattern, and why it's actually just a story about momentum running out of gas.
1. What a Head & Shoulders Pattern Actually Is
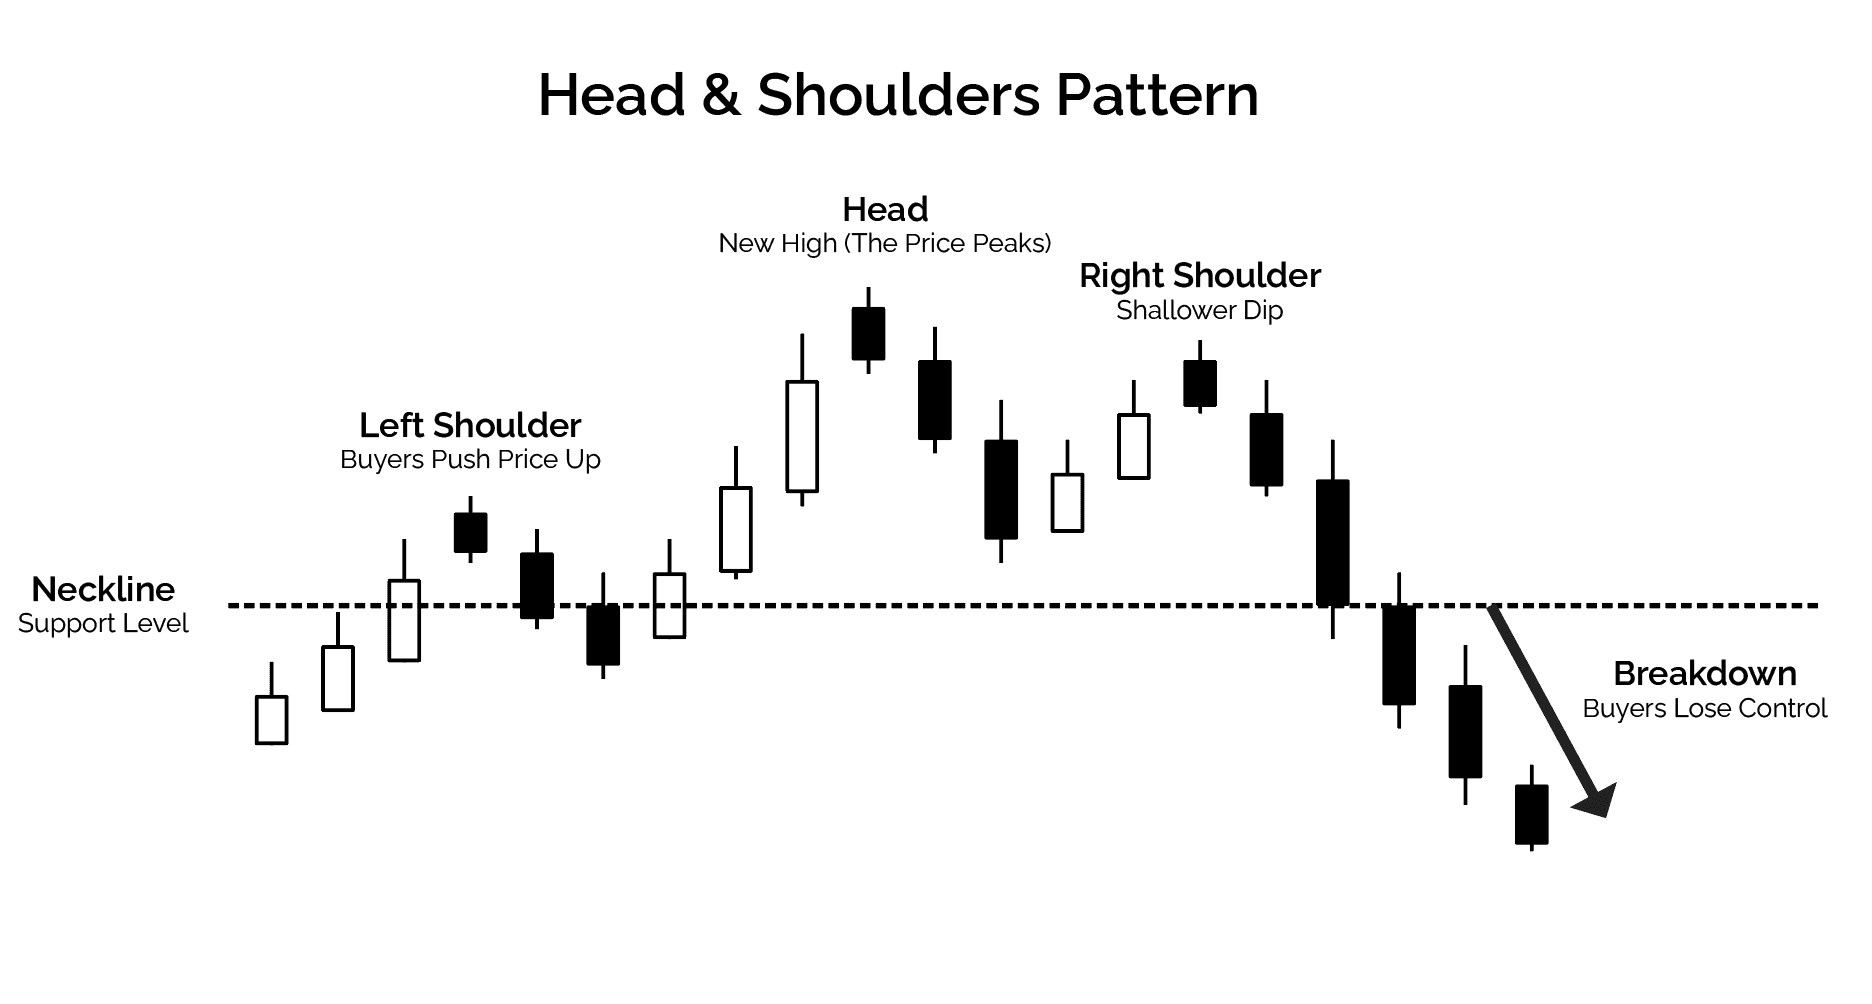
In textbook theory, a Head & Shoulders pattern is a reversal structure that shows up at the end of an uptrend, signaling that the bulls are losing their grip.
Visually, it consists of three distinct peaks:
The Left Shoulder: A standard rally and brief pullback.
The Head: A massive, aggressive rally that breaks to a new high, followed by another pullback.
The Right Shoulder: A weak, sad attempt to rally again that fails to reach the previous high.
Don’t obsess over the geometry. Look at the behavior story happening underneath the code:
The market pushes up: Buyers are confident.
A brief pullback occurs: Normal profit-taking.
The market rallies hard to a new high: Buyers throw massive liquidity at the move (forming the head).
Another pullback occurs: Sellers start stepping in.
The market attempts one final rally: But it completely stalls out out before matching the previous peak.
That final step is your critical data point. The market attempted continuation and failed. The buyers ran entirely out of energy.
Inverse Head & Shoulders
Because markets apparently enjoy symmetry, there is also an inverse Head & Shoulders pattern.
This is simply the bullish version.
Instead of forming near the top of an uptrend, it forms near the bottom of a downtrend.
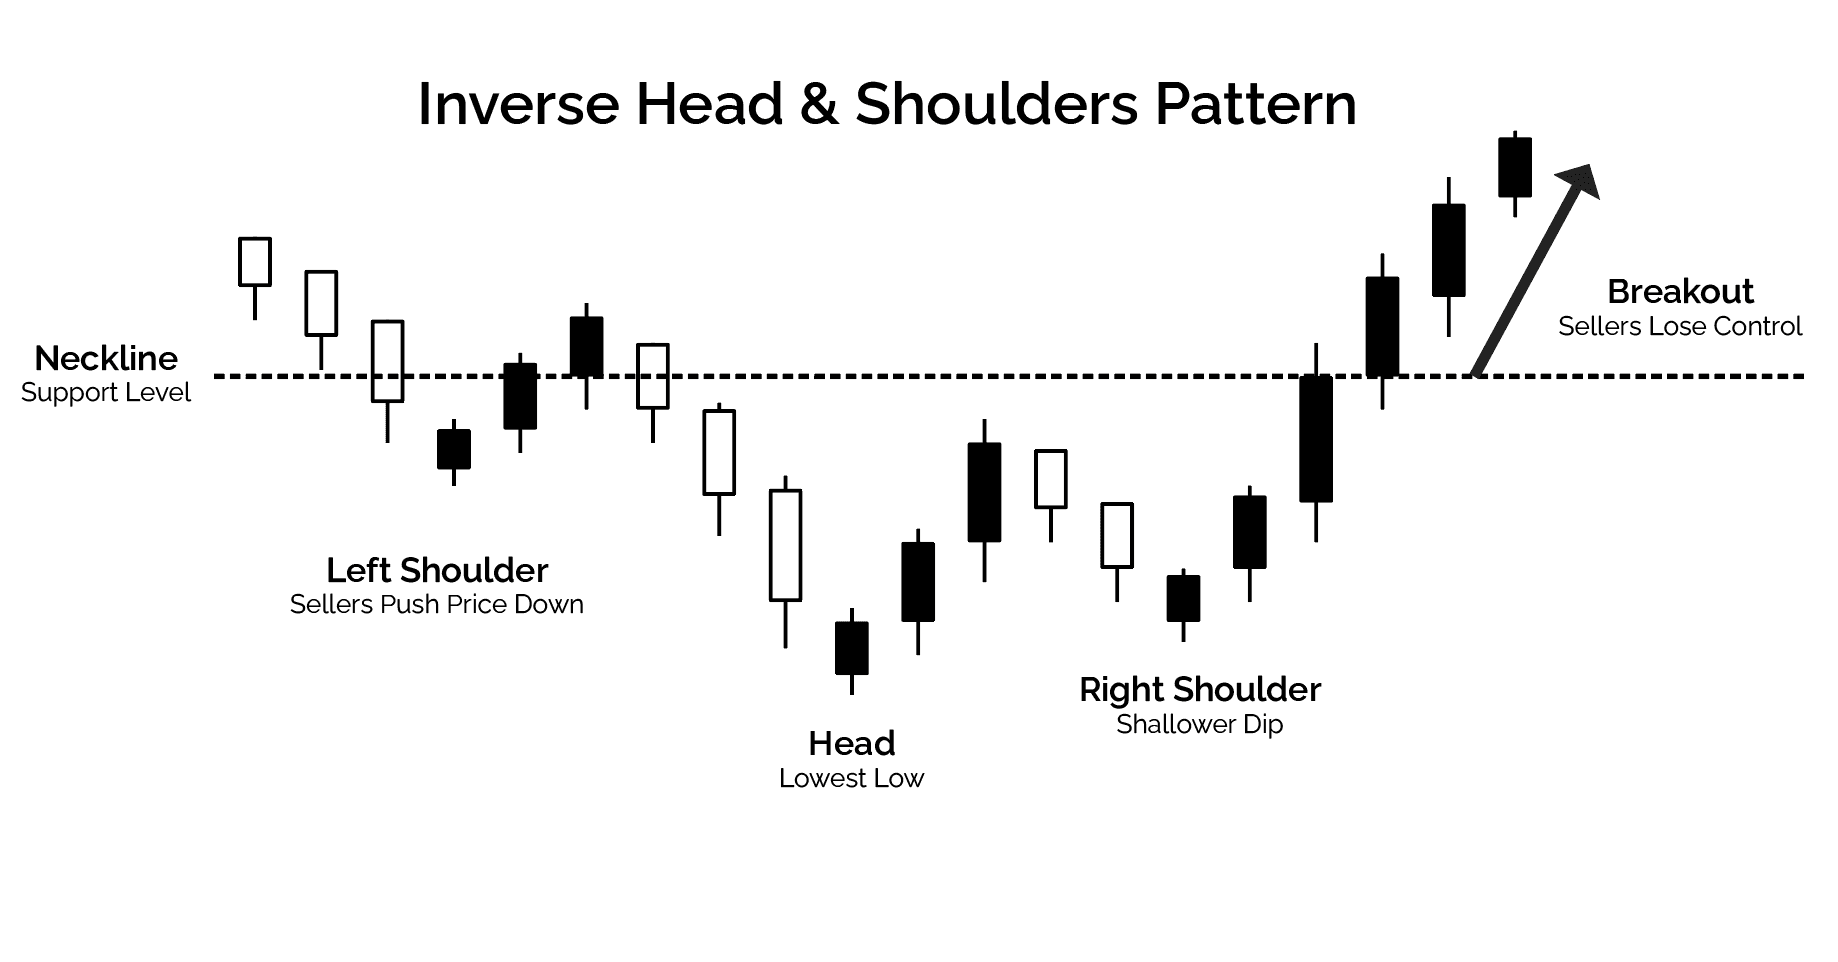
The psychology is identical:
momentum weakens
sellers begin losing control
reversal becomes possible
Same behavior story.Your little chart person is just upside down now.
2. The Psychology: Visualizing Weakness
The only reason this pattern has survived for over a century is because it visualizes a core flaw in human psychology: herd behavior under stress.
At the left shoulder and the head, buyers are aggressive, chasing momentum with high emotional conviction. But when the right shoulder forms, the user behavior shifts dramatically.
Price struggles to move upward.
The velocity slows down.
Buyers start hesitating.
Sellers realize the buyers are exhausted and begin pressing the short side.
Keep it in perspective: The pattern isn't a magical crystal ball predicting the future. It is simply a real-time record of a crowd transitioning from aggressive confidence to absolute exhaustion.
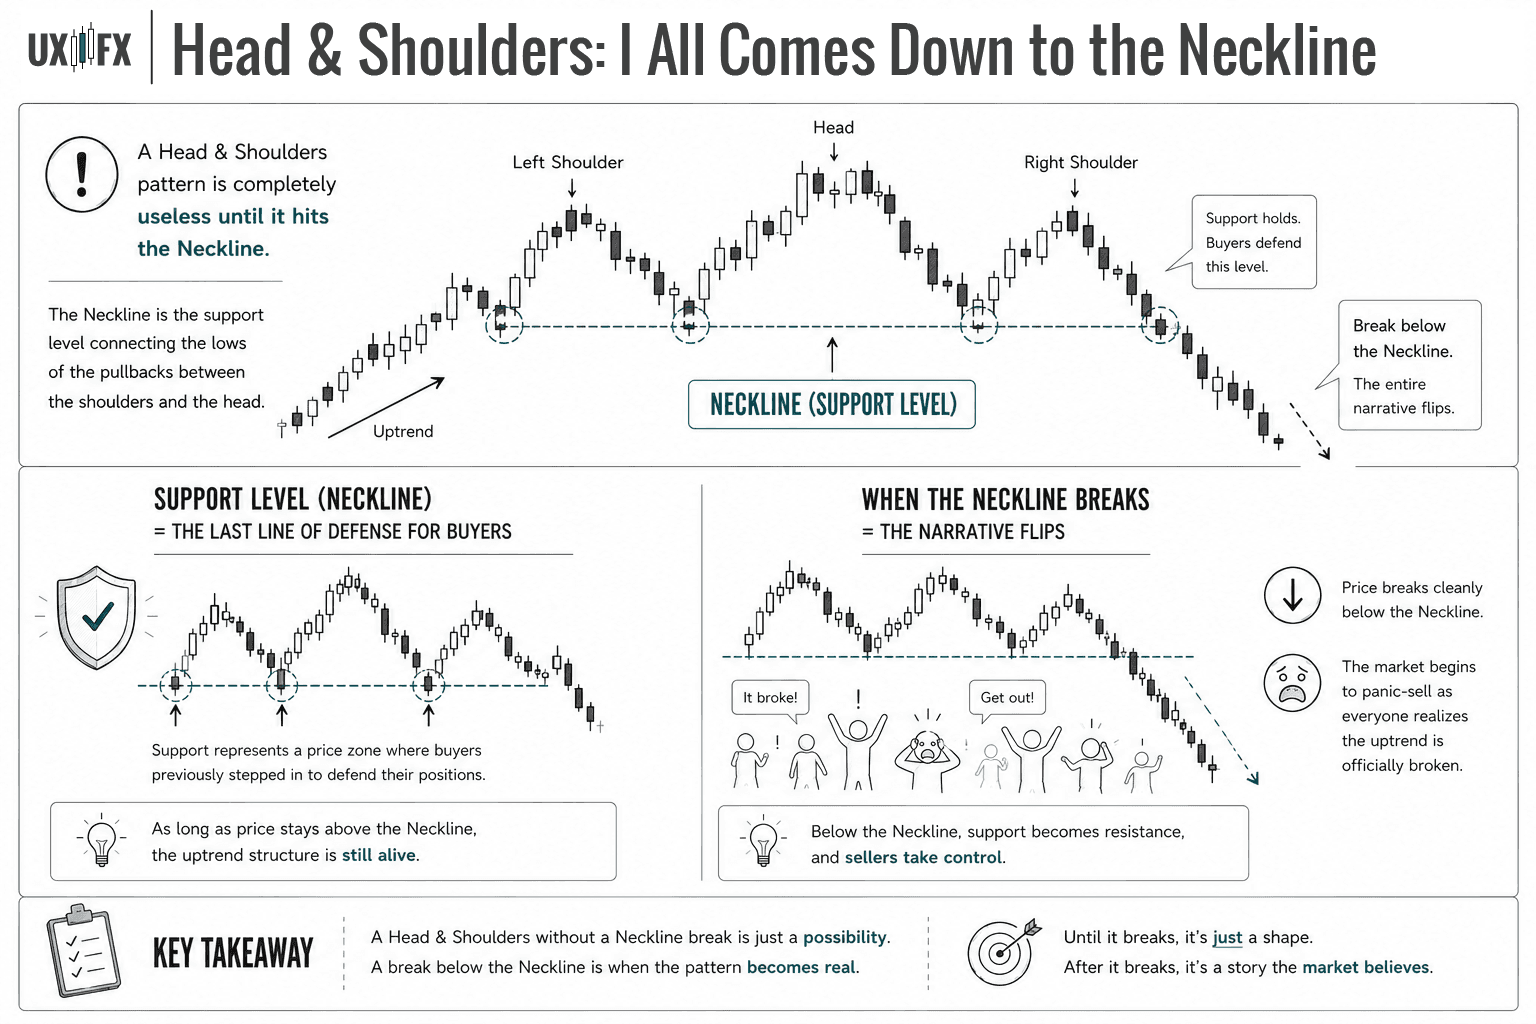
3. The Neckline (Where the Traps Form)
A Head & Shoulders pattern is completely useless until it hits the Neckline. This is the support level connecting the lows of the pullbacks between the shoulders and the head.
Support represents a price zone where buyers previously stepped in to defend their positions. If price breaks cleanly below that neckline, the entire narrative flips. The market begins to panic-sell as everyone realizes the uptrend is officially broken.
The Beginner Trap
Most amateur traders spot the rough outline of a right shoulder and immediately click "Sell" because they are impatient. They enter early, only to watch the market reverse and stop them out like it took their $50 micro contract completely personally.
A pattern is just a theory until the neckline breaks. Confirmation is your guardrail.
4. Why Beginners See This Pattern in Their Cereal
Once you learn what a Head & Shoulders pattern is, your brain will instantly begin spotting it everywhere. You’ll see it on the 1-minute chart, the 4-hour chart, in random market noise, and possibly in the condensation on your kitchen window.
Don't panic; this is a completely normal cognitive stage of learning.
Humans are evolutionary pattern-recognition machines. We hate randomness. This actually mirrors UX design principles perfectly:
Cognitive Load Management: Staring at thousands of flickering data points and raw ticking candles burns an immense amount of glucose. To save energy, your brain frantically tries to bake that chaotic information into a familiar, structured shape.
One of the hardest skills to develop as a trader is learning to separate meaningful market structure from random chart noise that your brain is enthusiastically trying to organize.
5. The Framework Summary
If you want to cut the clutter out of technical analysis, write this definition down on a post-it note:
The Shortcut: A Head & Shoulders pattern is simply a three-step failed attempt to continue a trend.
The market tried once, tried a second time with maximum effort, and then completely choked on the third attempt. If you stop looking for perfect geometry and start reading the underlying exhaustion story, you’ll stop getting trapped by the noise.
Success Criteria
After completing this lesson, you should be able to mark the peaks, neckline, and breakdown level of a valid setup, describe what market dynamics create the pattern, and explain why it fails more often than educational content suggests.
Common Misconception
A head and shoulders pattern is a reliable reversal signal when properly identified.
The Truth: Proper identification is genuinely difficult in real time (vs. hindsight), and the pattern fails predictably in ranging markets where the "head" is not a meaningful structural high.
FAQ's
Q: What is an inverse head and shoulders?
Q: How do you trade a head and shoulders pattern?
Q: What is a head and shoulders pattern?
Table of Contents
About Me

Krista Weber
After a career as a VP of UX and EdTech executive, I retired early—and quickly realized the traditional world of trading education is fundamentally broken.
As someone with a Master’s in HCI who specialized in the design of e-learning systems, I saw a massive gap: beginners aren't failing because trading is impossible; they’re failing due to massive cognitive overload and terrible instructional design.
This site bridges that gap. I’m applying the principles of learning science, systems thinking, and minimalist UX to strip away the market noise and teach trading the way it actually should be taught.
Stay in Touch
Some of the pages on my travel blog contain affiliate links. Whenever you buy something through one of these links, I get a small commission at no extra cost to you. As an affiliate, I only recommend products and services that I feel are high quality and helpful to my readers. Thanks for your support.
Read More

Breakout trading is the practice of entering a position the moment price moves beyond a defined level of support or resistance. It sounds simple, and it is, in structure. The challenge is that most breakouts are false.
Updated on Jun 12, 2026

Why matching a strategy to your cognitive style matters more than finding the 'best' one.
Updated on Apr 27, 2026

Before exploring individual strategies, it's worth asking a more fundamental question: what actually counts as a trading strategy? The answer shapes everything.
Updated on Apr 27, 2026