Triangles Explained Simply
A triangle is a market compressing toward a decision. Understand the triangle properly and a lot of the other patterns become easier, because they are variations on the same idea.

Learning Path Stage 1: Foundations
Learning Level 1: Recognition
Primary Learning Objective
By the end of this lesson, you will be able to identify symmetrical, ascending, and descending triangle formations and explain what converging price structure represents.
Of all the chart patterns a beginner meets, the triangle is the friendliest place to start. It is simple to see, it shows up constantly, and the behavior underneath it is easy to describe in plain language. If you understand the triangle properly, a lot of the other patterns become easier, because they are variations on the same idea.
So it is worth slowing down on this one.
What a Triangle Actually Is
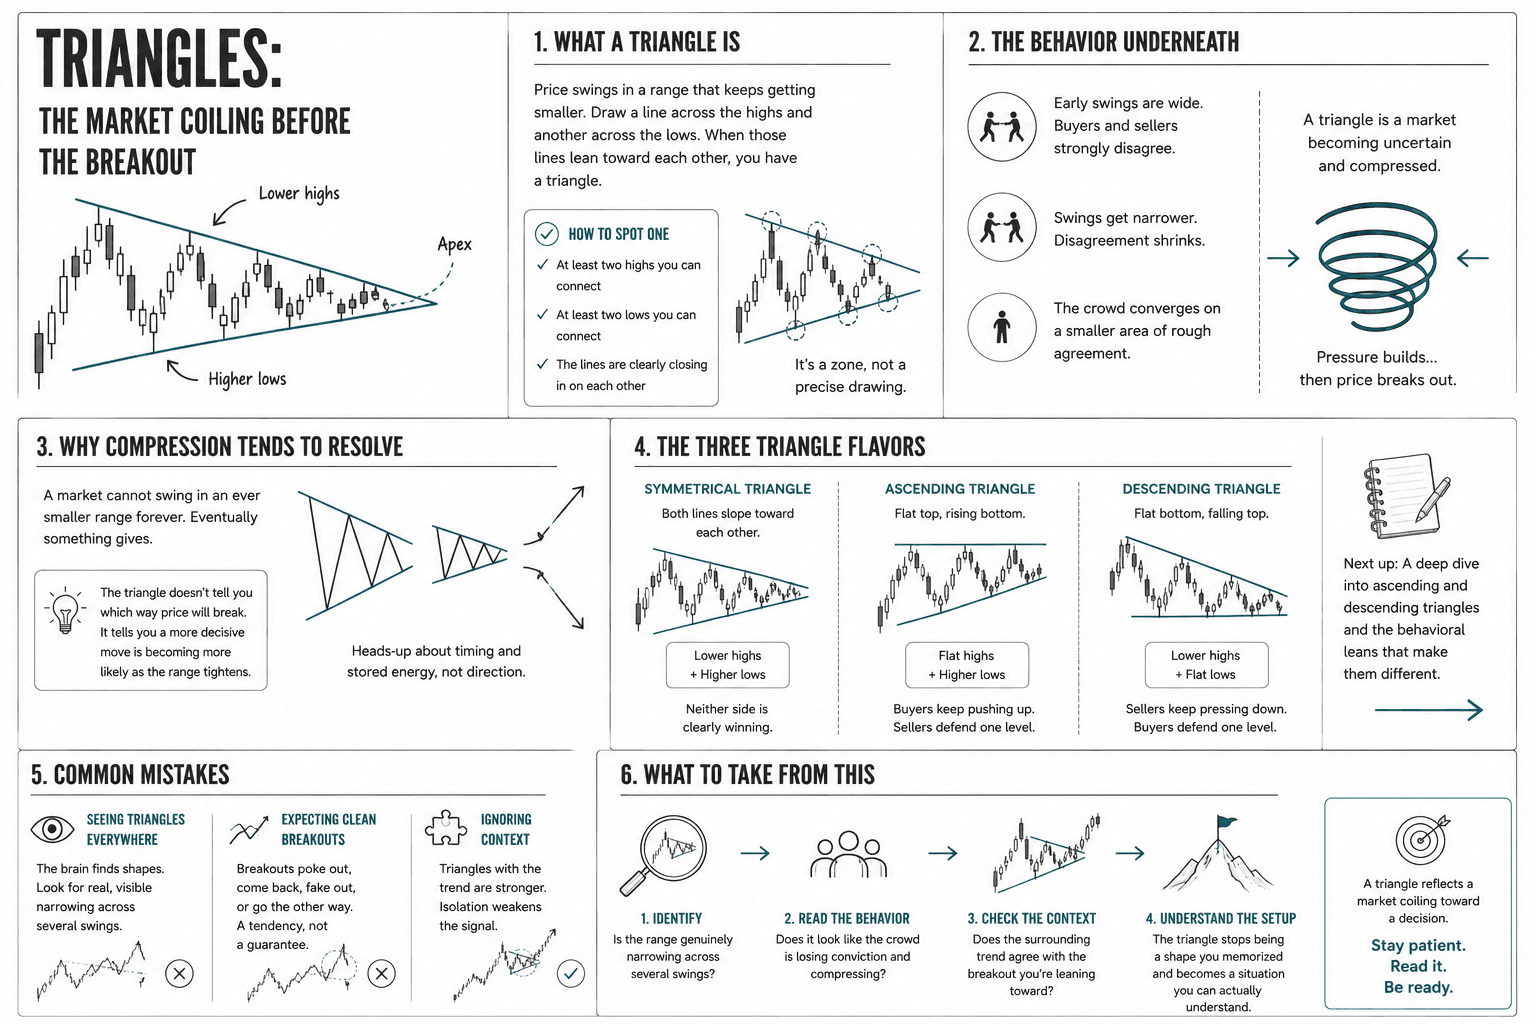
A triangle is what you get when price swings up and down in a range that keeps getting smaller. The early swings are wide. The later swings are narrower. If you draw a line along the highs and another along the lows, the two lines lean toward each other and seem to point at a meeting spot somewhere ahead. That converging shape is the triangle.
To find one on a chart, look for at least two highs you can connect with one line and two lows you can connect with another, where those two lines are clearly closing in on each other. You do not need perfect touches. Price might poke slightly past a line or fall slightly short of it. A triangle is a zone, not a precise drawing, and demanding perfection will only make you reject good ones.
The Behavior Underneath
The shape is the easy part. The reason it matters is what it says about the people doing the trading.
A wide swing means buyers and sellers strongly disagree about price. Buyers push it well up, sellers push it well down. As the swings narrow, that disagreement is shrinking. Buyers are no longer willing to chase price as high as before. Sellers are no longer willing to drive it as low. The crowd is converging on a smaller and smaller area of rough agreement.
A triangle, then, is a picture of a market becoming uncertain and compressed. It is coiling. Pressure is building inside a tighter and tighter space, and at some point price leaves the triangle in one direction or the other. That exit is called the breakout.
Why Compression Tends to Resolve
The reason traders pay attention to triangles is that compression does not last forever. A market cannot swing in an ever smaller range indefinitely. Eventually something gives. New information arrives, or one side simply runs out of patience, and price breaks out of the narrowing range.
The triangle does not tell you which direction the breakout will go. That is the honest and slightly disappointing truth. What it tells you is that the market is winding up, and that a more decisive move is becoming more likely as the range tightens. It is a heads-up about timing and stored energy, not a prediction of direction.
The Three Triangle Flavors, Briefly
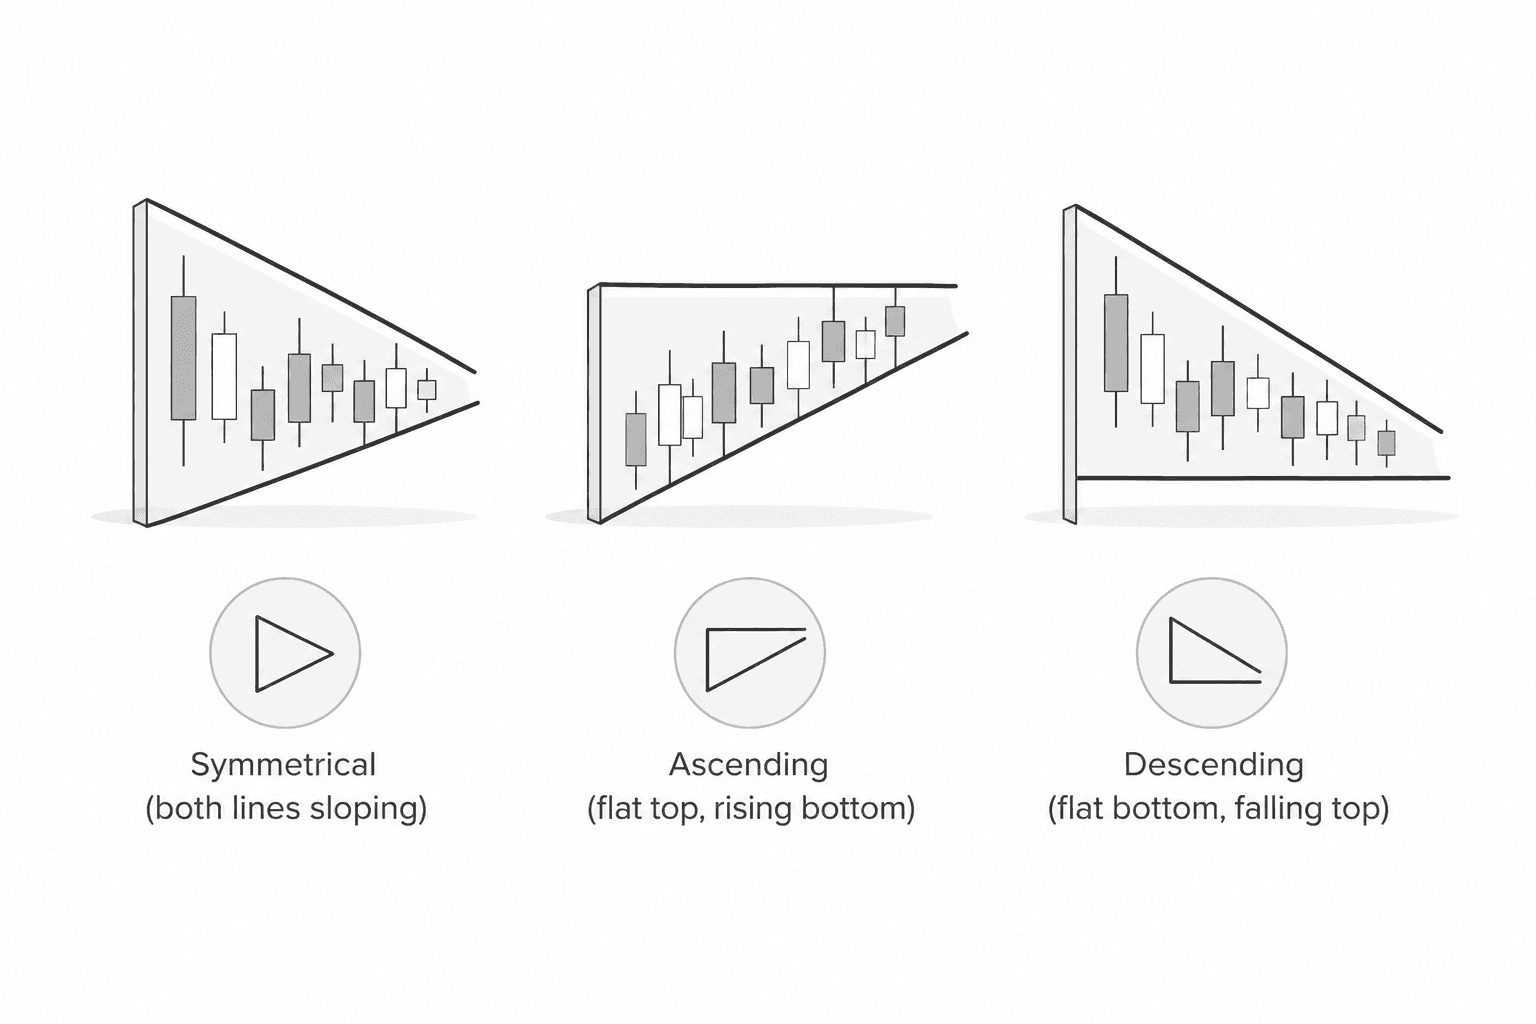
Triangles come in three forms, and the difference is simply which of the two lines is doing the moving.
A symmetrical triangle has both lines sloping toward each other. The highs are getting lower and the lows are getting higher at the same time. Neither side is clearly winning.
An ascending triangle has a flat top and a rising bottom. The lows keep climbing while the highs stall against one level.
A descending triangle has a flat bottom and a falling top. The highs keep dropping while the lows hold at one level.
The next article looks at the ascending and descending versions closely, because those two carry a behavioral lean worth understanding. For now, just notice that all three are the same core idea, namely a market compressing, with small differences in who is doing the compressing.
How Beginners Misuse Triangles
A few honest cautions.
First, you will start seeing triangles everywhere once you know the shape, including in places where there is no real compression. As covered earlier in this stage, the brain finds the shapes it is looking for. A genuine triangle has real, visible narrowing across several swings, not two lines you drew hopefully through noise.
Second, breakouts are messier than the diagrams suggest. Price often pokes through a line, comes back inside, then leaves properly. It sometimes breaks one way, fails, and breaks the other. A triangle is a tendency, not a guarantee, and a fair number of them resolve in the unexpected direction.
Third, context matters. A triangle that forms during a strong uptrend and breaks upward is leaning with the behavior already in place. A triangle sitting in isolation, with no clear trend around it, is a weaker signal. The shape is the same. The surrounding situation changes how much it is worth.
What To Take From This
A triangle is one of the clearest examples of the whole idea behind chart patterns. It is a shape, yes, but the shape only matters because it reflects something real: a market growing less certain and compressing toward a decision.
When you see one, do not just label it. Read it. Ask whether the swings are genuinely narrowing, whether the crowd really does seem to be losing conviction, and whether the surrounding trend agrees with whatever breakout you are leaning toward. Do that, and the triangle stops being a shape you memorized and becomes a situation you can actually understand.
Success Criteria
After completing this lesson, you should be able to recognize a valid triangle on a chart, explain why price contracts within the formation, and describe what typically happens at the apex.
Common Misconception
Triangles are precise, clean formations.
The Truth: Real triangles are often messier than textbook examples and require some interpretation, and waiting for the perfect version means rarely finding valid setups in live markets.
FAQ's
Q: What are the three main types of triangles?
Q: Are triangle breakouts reliable?
Q: What is a triangle pattern in trading?
Table of Contents
About Me

Krista Weber
After a career as a VP of UX and EdTech executive, I retired early—and quickly realized the traditional world of trading education is fundamentally broken.
As someone with a Master’s in HCI who specialized in the design of e-learning systems, I saw a massive gap: beginners aren't failing because trading is impossible; they’re failing due to massive cognitive overload and terrible instructional design.
This site bridges that gap. I’m applying the principles of learning science, systems thinking, and minimalist UX to strip away the market noise and teach trading the way it actually should be taught.
Stay in Touch
Some of the pages on my travel blog contain affiliate links. Whenever you buy something through one of these links, I get a small commission at no extra cost to you. As an affiliate, I only recommend products and services that I feel are high quality and helpful to my readers. Thanks for your support.
Read More

Breakout trading is the practice of entering a position the moment price moves beyond a defined level of support or resistance. It sounds simple, and it is, in structure. The challenge is that most breakouts are false.
Updated on Jun 12, 2026

Why matching a strategy to your cognitive style matters more than finding the 'best' one.
Updated on Apr 27, 2026

Before exploring individual strategies, it's worth asking a more fundamental question: what actually counts as a trading strategy? The answer shapes everything.
Updated on Apr 27, 2026