What Even Counts as a Chart Pattern?
A chart pattern is a recurring shape, but it only counts when the shape reflects a real behavioral situation. The name is shorthand. The behavior is the subject.

Learning Path Stage 3: Chart Patterns
Learning Level 1: Recognition
Primary Learning Objective
By the end of this lesson, you will be able to define what distinguishes a legitimate chart pattern from an arbitrary price shape.
How Do You Know If What You See Is Real?
If you spend any time around trading content, you will hear the phrase "chart pattern" constantly. Head and shoulders, triangles, flags, wedges, double tops. The names pile up quickly, often delivered with the confidence of someone naming constellations.
It can leave a beginner with a reasonable question that rarely gets asked directly: What actually counts as a chart pattern?
It is worth answering plainly, because the answer changes how you read every pattern that follows.
A Pattern Is a Recurring Shape
At its simplest, a chart pattern is a recognizable shape that price tends to trace out, often enough that traders gave it a name. That is the whole definition. A pattern is a shape that recurs.
The interesting question is why any shape would recur at all. Price is just a running record of buying and selling. There is no reason for it to repeat itself unless something underneath it is repeating.
And something is: human behavior.
Patterns Repeat Because Behavior Repeats
Markets are made of people making decisions under uncertainty. People get fearful in similar ways, greedy in similar ways, and hesitant in similar ways. When a similar situation shows up, the crowd tends to react in a broadly similar fashion.
A chart pattern is what that shared reaction looks like when you draw it.
A triangle, where price swings in a steadily narrowing range, is what a market looks like when participants are becoming uncertain and the gap between buyers and sellers is compressing.
A double top is what it looks like when the crowd tries the same high twice and fails both times.
This is the reframe that matters most: A chart pattern is not magic geometry. It is a probabilistic record of crowd behavior. The shape is a side effect of a behavioral situation, not a spell the market is obligated to obey.
Patterns Are Categories Humans Impose
Here is the part most trading content skips: A chart pattern is a category that humans place onto continuous movement. Price does not arrive labeled.
Price moves in one unbroken stream. We are the ones who look at a stretch of it and say, "that section is a flag," or "that section is a range." The pattern is partly in the chart and partly in the eye of the person reading it.
This means patterns have fuzzy edges. There is no precise moment a wobble in price legally becomes a triangle. Two reasonable traders can look at the same chart and disagree about whether a pattern is there at all. A pattern is a useful label, not a hard object with crisp boundaries.
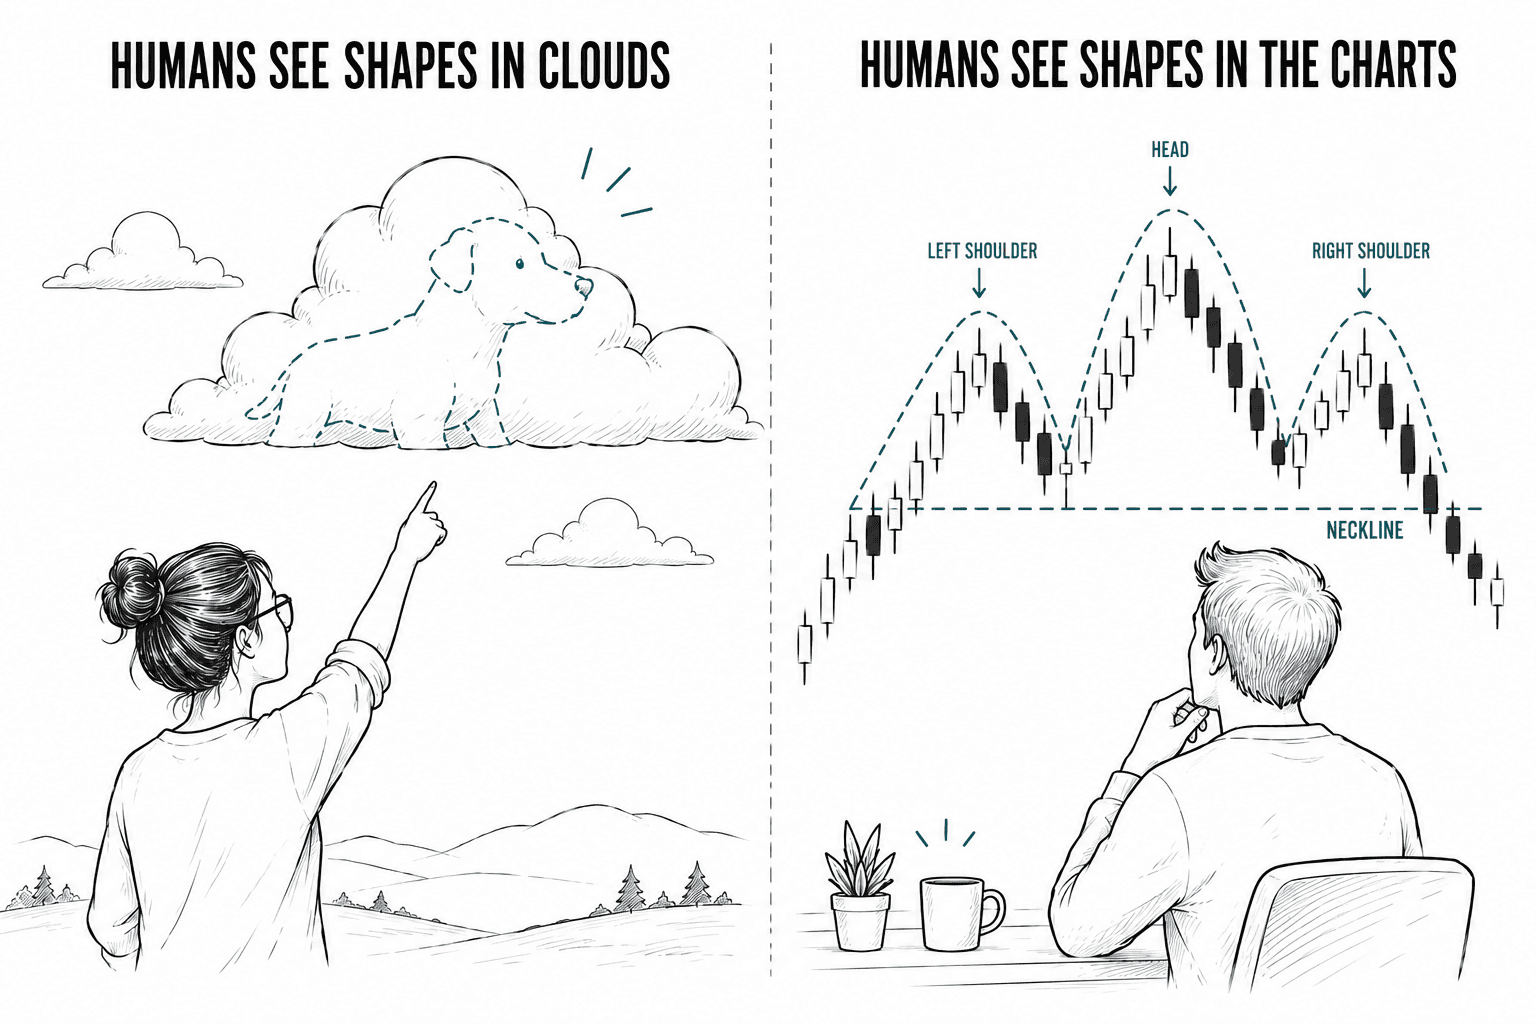
Drawing Faces in the Clouds
Humans are extraordinarily good at finding patterns, including patterns that aren't there. We see faces in clouds and shapes in static. This is helpful for survival, but it is dangerous on a price chart.
It means not everything that looks like a pattern counts as one. You can find a rough triangle in almost any chart if you squint hard enough. The shape being present is not, by itself, meaningful.
The better test is behavioral. A chart pattern is worth taking seriously when the shape reflects a genuine situation underneath: real consolidation, real repeated rejection, or real exhaustion. If the shape is there but the behavior is not, what you have found is just a coincidence wearing a costume.
Why This Matters Before You Learn the Names
It would be easy to skip straight to the list of patterns. The names are appealing and the diagrams look authoritative. But starting with the definition changes how the rest of the information lands.
If you learn patterns as a list of shapes to memorize, you end up scanning charts for shapes, which your pattern-hungry brain will always find.
If you learn patterns as records of behavior, you start asking a better question. Instead of asking, "Is there a triangle here?" you ask, "Is the crowd actually compressing toward a decision?" The shape becomes a prompt to check the behavior, rather than the conclusion itself.
So, What Actually Counts?
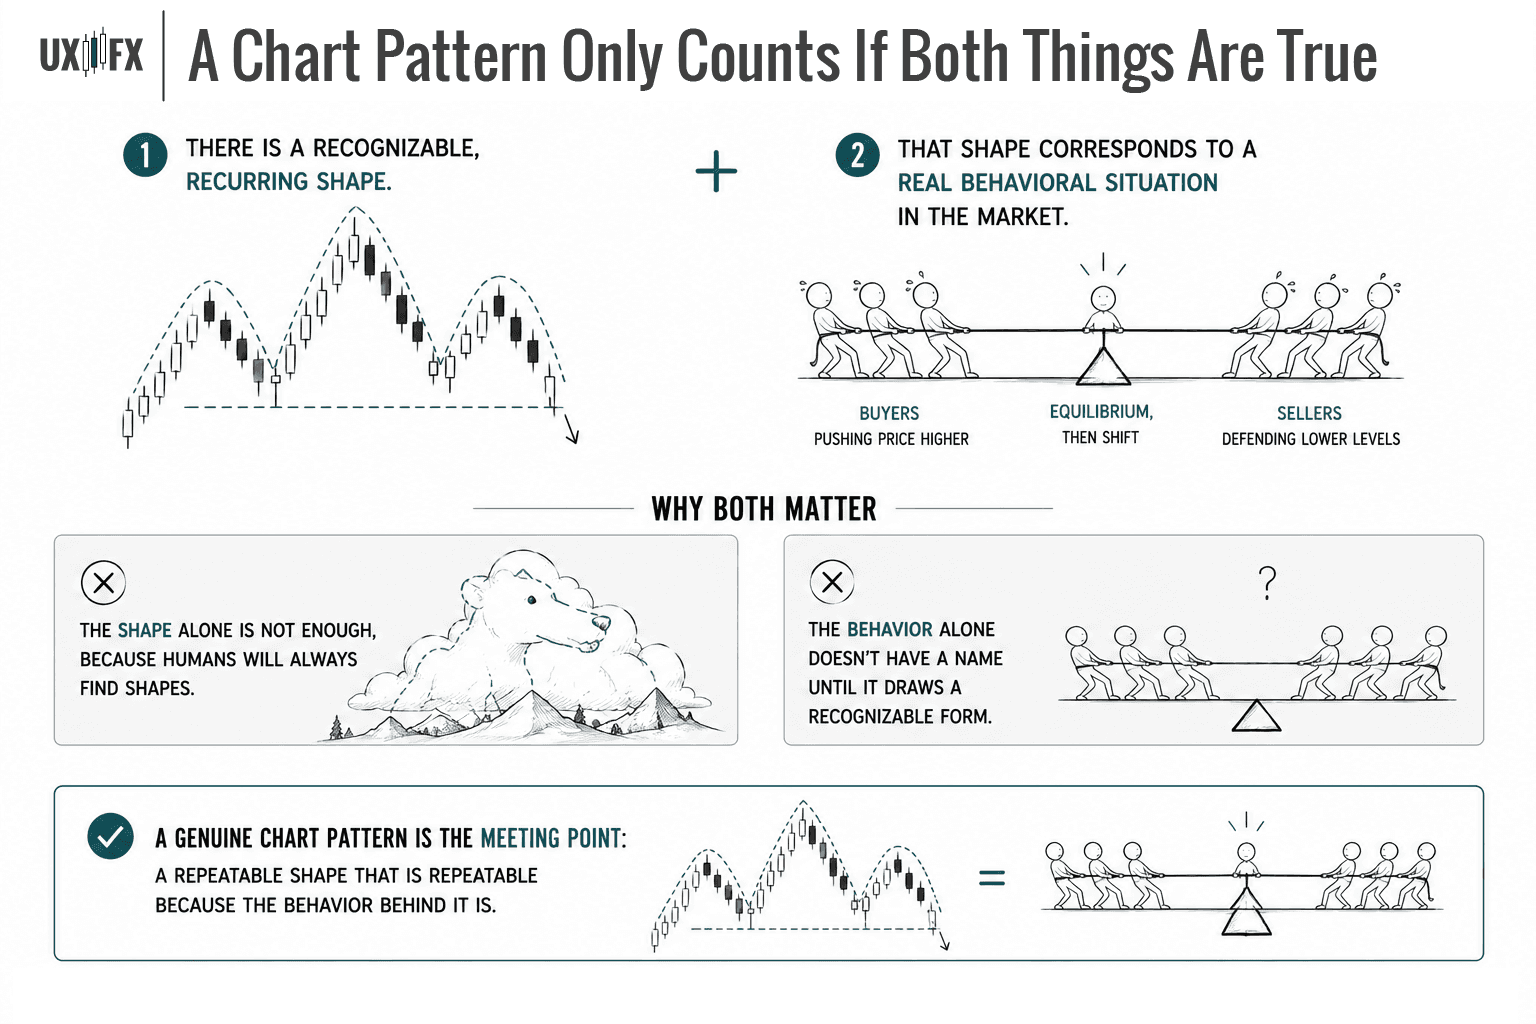
A chart pattern counts when two things are true at once:
There is a recognizable, recurring shape.
That shape corresponds to a real behavioral situation in the market.
The shape alone is not enough, because humans will always find shapes. The behavior alone doesn't have a name until it draws a recognizable form. A genuine chart pattern is the meeting point: a repeatable shape that is repeatable because the behavior behind it is.
You will spend the rest of this stage looking at specific patterns. When you find yourself getting lost in the names, come back to this. A pattern is not a prediction the market promised to honor. It is a shorthand for a human situation.
The name is just the label. The behavior is the actual subject.
Success Criteria
After completing this lesson, you should be able to explain what makes a pattern worth tracking, and distinguish between patterns with structural or behavioral basis and those that are visually interesting but predictively meaningless.
Common Misconception
Anything that looks like a recognizable shape on a chart is a valid pattern worth trading.
The Truth: The number of patterns in common use far exceeds the number with documented predictive value.
FAQ's
Q: How many chart patterns do you need to know?
Q: Are chart patterns predictive or just descriptive?
Q: What is the definition of a chart pattern?
Table of Contents
About Me

Krista Weber
After a career as a VP of UX and EdTech executive, I retired early—and quickly realized the traditional world of trading education is fundamentally broken.
As someone with a Master’s in HCI who specialized in the design of e-learning systems, I saw a massive gap: beginners aren't failing because trading is impossible; they’re failing due to massive cognitive overload and terrible instructional design.
This site bridges that gap. I’m applying the principles of learning science, systems thinking, and minimalist UX to strip away the market noise and teach trading the way it actually should be taught.
Stay in Touch
Some of the pages on my travel blog contain affiliate links. Whenever you buy something through one of these links, I get a small commission at no extra cost to you. As an affiliate, I only recommend products and services that I feel are high quality and helpful to my readers. Thanks for your support.
Read More

Breakout trading is the practice of entering a position the moment price moves beyond a defined level of support or resistance. It sounds simple, and it is, in structure. The challenge is that most breakouts are false.
Updated on Jun 12, 2026

Why matching a strategy to your cognitive style matters more than finding the 'best' one.
Updated on Apr 27, 2026

Before exploring individual strategies, it's worth asking a more fundamental question: what actually counts as a trading strategy? The answer shapes everything.
Updated on Apr 27, 2026