
How to Draw Support and Resistance
Let’s be honest: 'price stopped going up' isn't a magical spell. It’s just the predictable result of human anxiety, greed, and specific math colliding at a single price point. If you can identify exactly who is pulling the trigger and why, resistance stops being a random line you're desperately hoping holds, and becomes a map of market psychology you can actually read.

Learning Path Stage 2: Reading Charts
Learning Level 3: Application
Primary Learning Objective
By the end of this lesson, you will be able to analyze the mechanical and behavioral drivers behind a resistance level, allowing you to correctly identify why resistance holds, breaks, or flips into support based on the psychology of different market participants.
Let’s be honest: "price stopped going up" isn't a magical spell. It’s just the predictable result of human anxiety, greed, and specific math colliding at a single price point.
If you can identify exactly who is pulling the trigger and why, resistance stops being a random line you're desperately hoping holds, and becomes a map of market psychology you can actually read.
The Cast of Characters Selling at Resistance
Resistance happens when selling supply overpowers buying demand. But who exactly is dumping their shares or contracts? It turns out the sellers usually fall into five highly predictable buckets:
The "Take the Money and Run" Crowd (Profit-Takers): These are the smart cookies who bought lower and are sitting on green. As price approaches a clear historical high, they click "sell" to lock in rewards. Because everyone looks at the same charts, their profit targets heavily cluster at the exact same levels.
The "Please Just Let Me Break Even" Club (Trapped Buyers): These poor souls bought the absolute top of the last breakout right before it collapsed. They’ve spent weeks or months underwater, sweating through tears. The moment price crawls back to their entry level, they instantly dump it just to escape with zero losses. This creates a massive wall of overhead supply.
The Technical Short-Sellers: These traders didn't buy earlier; they are sharks looking at the historical level, licking their chops, and betting price will fail there again. They aggressively throw fresh sell orders into the mix.
Institutions Doing "Housekeeping" (Hedgers): Large funds managing massive portfolios will often sell into a rally to reduce risk. They don’t necessarily think the trend is over—they’re just executing prudent risk management. But their massive size adds heavy gravity to the price.
The Soulless Overlords (Algorithms): High-frequency trading systems are programmed mechanically to sell at obvious technical zones or psychological round numbers. They don't feel fear or greed; they just execute instantly.
The Takeaway: None of this is random. When price hits resistance, you are watching a massive convergence of profit-takers, panic-sellers, technical sharks, and automated bots all screaming "Sell!" at the exact same time.
Reading the Candlestick Crime Scene
You can see this battle play out in real time by watching the candles as they approach the danger zone:
1. The Approach Candles
Watch the momentum. If the bullish candles get smaller and smaller as price approaches the level, buyers are losing their nerve. The car is running out of gas before it even hits the wall.
2. The Test Candle
When price finally slams into the resistance level, look for these telltale signatures:
The Long Upper Wick: Price tried to break out, sellers absolutely walloped it, and price got dragged back down before the close. The wick is basically a visual monument to a failed coup.
The Bearish Engulfing: A strong green candle is immediately swallowed whole by a massive red candle next to it. Buyers had full control and lost it in a single session.
The Indecisive Doji: A tiny candle body with wicks on both sides. It means buyers and sellers are locking horns like angry rams, and nobody has won yet. Treat the next candle as the tiebreaker.
3. The Rejection Candle
If resistance holds, the follow-up candle will be a large, aggressive red bar moving away from the zone. The sellers have won the round, and the buyers are retreating to look for safety.
Pro Tip: Resistance is a Zone, Not a Laser Beam
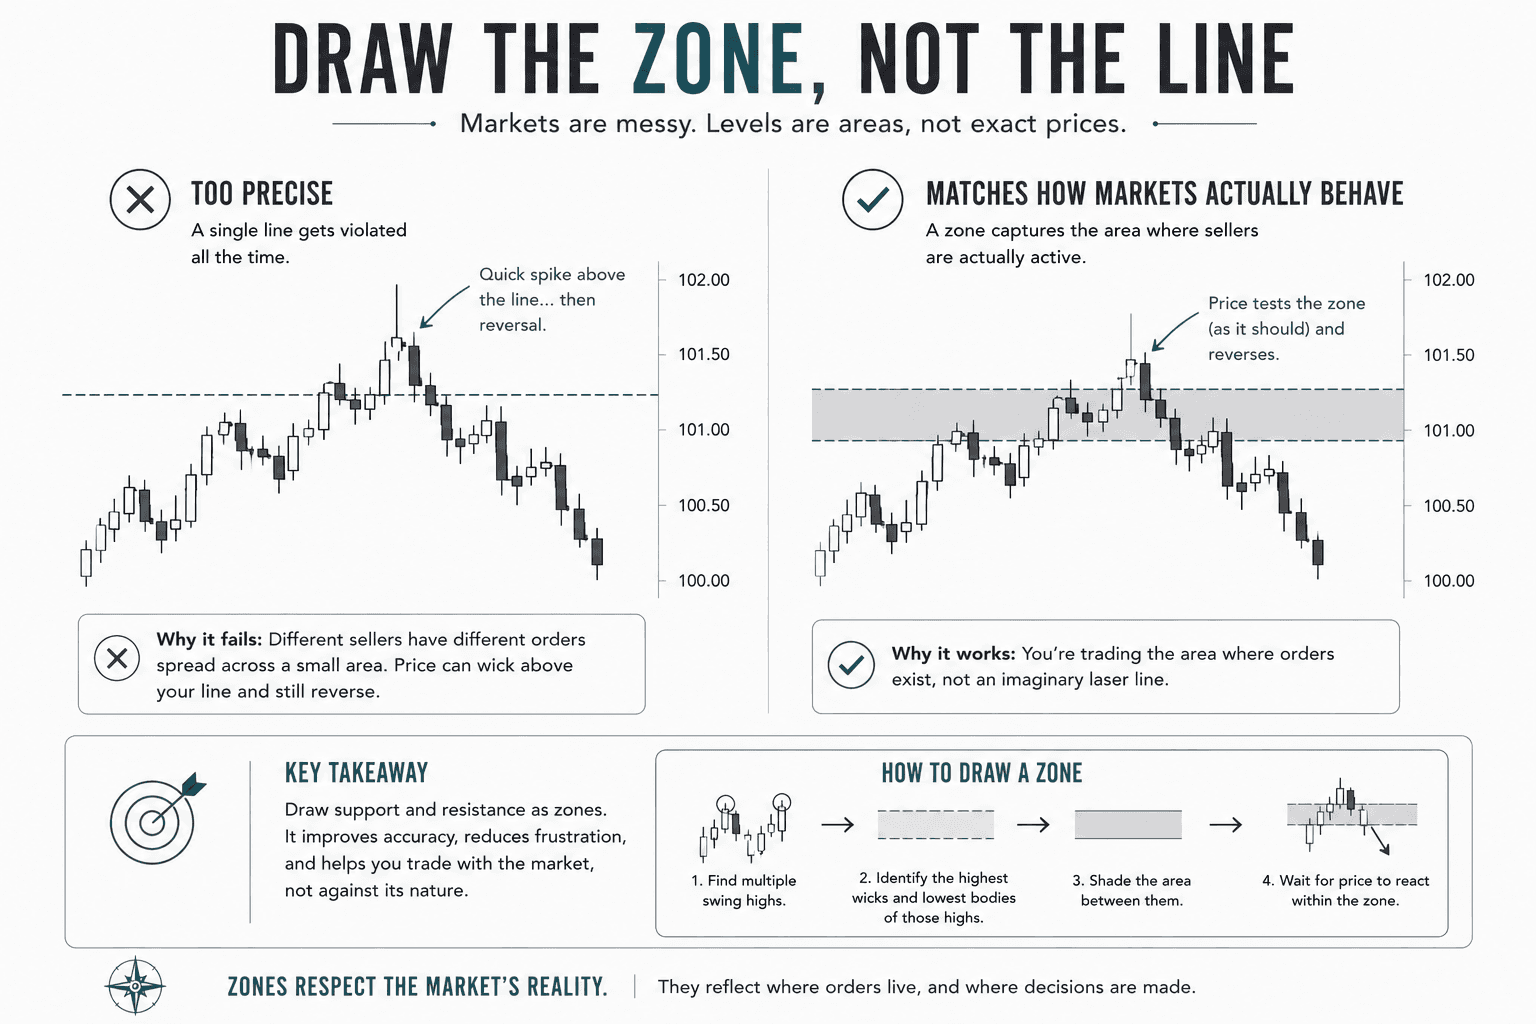
One of the biggest mistakes beginners make is drawing resistance as a single, razor-thin line.
Markets are messy. Different sellers have different exit strategies spread across a small price window. If you draw a single line at $100.00, you’ll get chopped to pieces when price spikes to $100.45 before reversing.
Draw a shaded zone instead of a line. It keeps you from getting faked out by minor volatility and accounts for the fact that human behavior happens in ranges, not perfect integers.
Why Resistance Ultimately Snaps
Resistance holds until it doesn't. When a level breaks, it’s usually down to three factors:
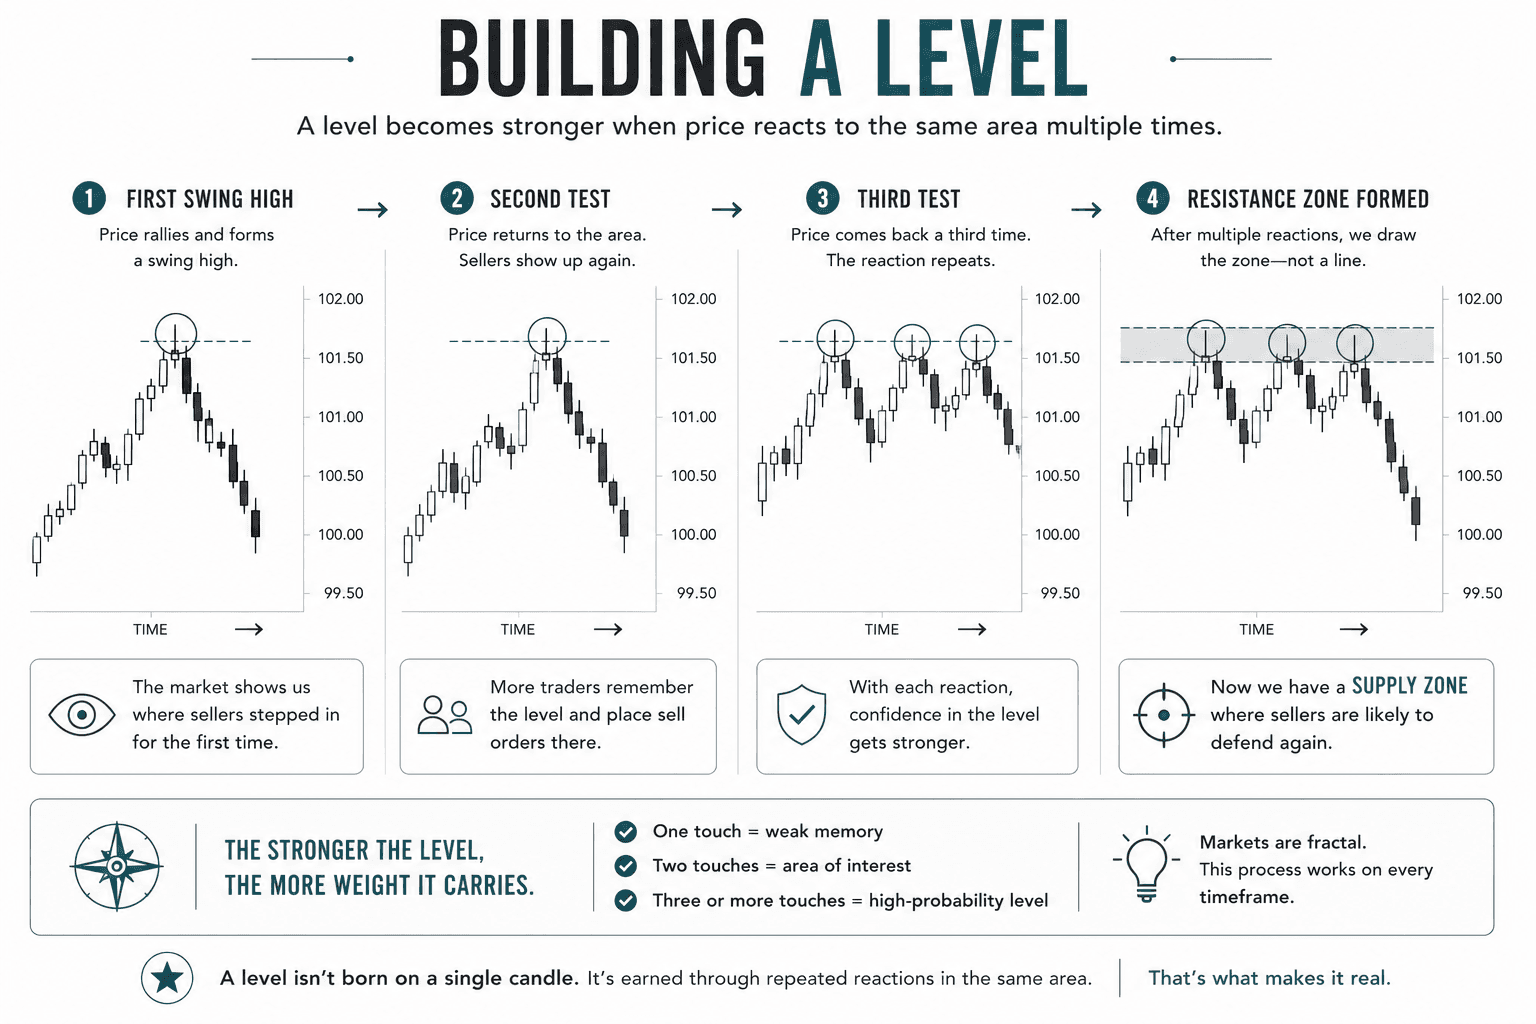
The Supply Gets Absorbed: If price keeps hitting a resistance level over and over, the profit-takers finish selling and the break-even club gets fully cleared out. Eventually, there are simply no sellers left to hold the line.
A Fundamental Catalyst: An unexpected news event, earnings beat, or central bank announcement drops. Sudden massive demand floods the market, instantly obliterating any normal sell orders waiting at the level.
Pure Trend Momentum: In a monster bull market, FOMO (Fear Of Missing Out) takes over. Buyers will happily plow right through old resistance levels without even pausing to say hello.
The "Role Reversal" Mechanic
When resistance finally breaks convincingly, the script flips completely.
Remember those short-sellers who bet the level would hold? They are now trapped in a losing trade. They frantically wait for a minor pullback to their entry point so they can buy back their positions and exit at break-even.
Add in new buyers who missed the initial breakout boat and technical traders buying the retest on purpose, and suddenly you have three distinct groups all buying at the exact same price where people used to sell.
[Old Resistance] ---> Convincing Breakout ---> Pullback/Retest ---> [New Support]
That is the mechanical, un-magical reason why old resistance reliably transforms into new support.
Bottom Line: Resistance doesn't stop price; sellers stop price. Resistance is just the specific coordinates where they've chosen to stand their ground. Know who they are, and you'll easily spot the exact moment they start running out of ammunition.
Practice This
Reading about a framework and applying it under time pressure are different skills. "Mark the Support Before I Do" is a hands-on markup exercise that puts this exact process to work, with a grading system for judging which of your levels are actually worth keeping. If you've followed the steps above, that's the natural next lesson.
Success Criteria
You will know you have mastered this concept when you can:
Identify and describe the five primary categories of sellers (profit-takers, trapped buyers, technical shorts, institutional hedgers, and algorithms) that create overhead supply.
Analyze a candlestick chart frame-by-frame to identify the approach, test, and rejection signatures that signal seller conviction.
Draw resistance accurately as a shaded zone rather than a single laser-thin line to account for scattered order distribution.
Explain the role reversal mechanic—the exact reason why broken resistance structurally transforms into new support upon a retest.
Common Misconception
Resistance is a fixed, objective line on a chart that mathematically forces the price to stop rising.
The Truth: Resistance is not an invisible wall; it is a fluid, dynamic zone populated by human decisions and automated orders. Price stops moving upward solely because the volume of supply (sellers) momentarily overpowers the volume of demand (buyers). If those specific sellers run out of ammunition or a new fundamental catalyst enters the market, the level will easily snap.
FAQ's
Q: Are round numbers (like $100 or $1.1000) actual resistance?
Q: What happens to the shorts when a breakout happens?
Q: If everyone can see a resistance level, doesn't that make it useless?
Table of Contents
About Me

Krista Weber
After a career as a VP of UX and EdTech executive, I retired early—and quickly realized the traditional world of trading education is fundamentally broken.
As someone with a Master’s in HCI who specialized in the design of e-learning systems, I saw a massive gap: beginners aren't failing because trading is impossible; they’re failing due to massive cognitive overload and terrible instructional design.
This site bridges that gap. I’m applying the principles of learning science, systems thinking, and minimalist UX to strip away the market noise and teach trading the way it actually should be taught.
Stay in Touch
Some of the pages on my travel blog contain affiliate links. Whenever you buy something through one of these links, I get a small commission at no extra cost to you. As an affiliate, I only recommend products and services that I feel are high quality and helpful to my readers. Thanks for your support.
Read More

Open almost any trading platform and you'll see EUR/USD sitting next to XAU/USD, NQ, ES, and a dozen CFDs on stocks you've heard of. They all show up as candlesticks moving left to right, which quietly implies they're all the same kind of thing. They aren't. Before going deeper into any one of them, it's worth drawing the map.
Updated on Sep 6, 2026

Futures are standardized contracts tied to defined specifications and a future settlement date. They can look complex at first, but the mechanics become much clearer once you know what the contract specification controls. Here's what you actually need to know.
Updated on Sep 6, 2026

CFDs appear everywhere in retail trading – but most new traders couldn't explain exactly what they are or why that matters. Here's a plain-language breakdown, including the parts that most introductions skip.
Updated on Sep 6, 2026