
Is This Structure Worth Trading?
Identifying structure is the precondition for trading it. But identifying structure doesn't mean the structure is worth trading. This article walks through the evaluation process for deciding whether what you've found on the chart actually meets the bar for a tradeable setup.

Learning Path Stage 2: Reading Charts
Learning Level 5: Evaluation
Primary Learning Objective
By the end of this lesson, you will be able to apply a strict 5-part evaluation filter to any technically valid structural level on a 4H or daily chart, allowing you to mathematically separate high-probability setups from low-probability market noise.
From Structure to Trade: The Gap
Most developing traders fall into a specific psychological gap: finding structure and automatically treating it as a green light to enter a trade.
Structure is strictly context. It tells you where the interesting price areas are, where market participants have made major decisions before, and where future reactions are highly likely to occur. However, "a reaction is likely here" and "I should trade this right now" are two completely different statements.
The evaluation process between finding structure and entering a trade is where your actual edge either exists or dies. The five questions below make that process explicit.
Trading Room Reality: Chart structure is just the invite to the party. The entry trigger is the proof that anyone actually showed up.
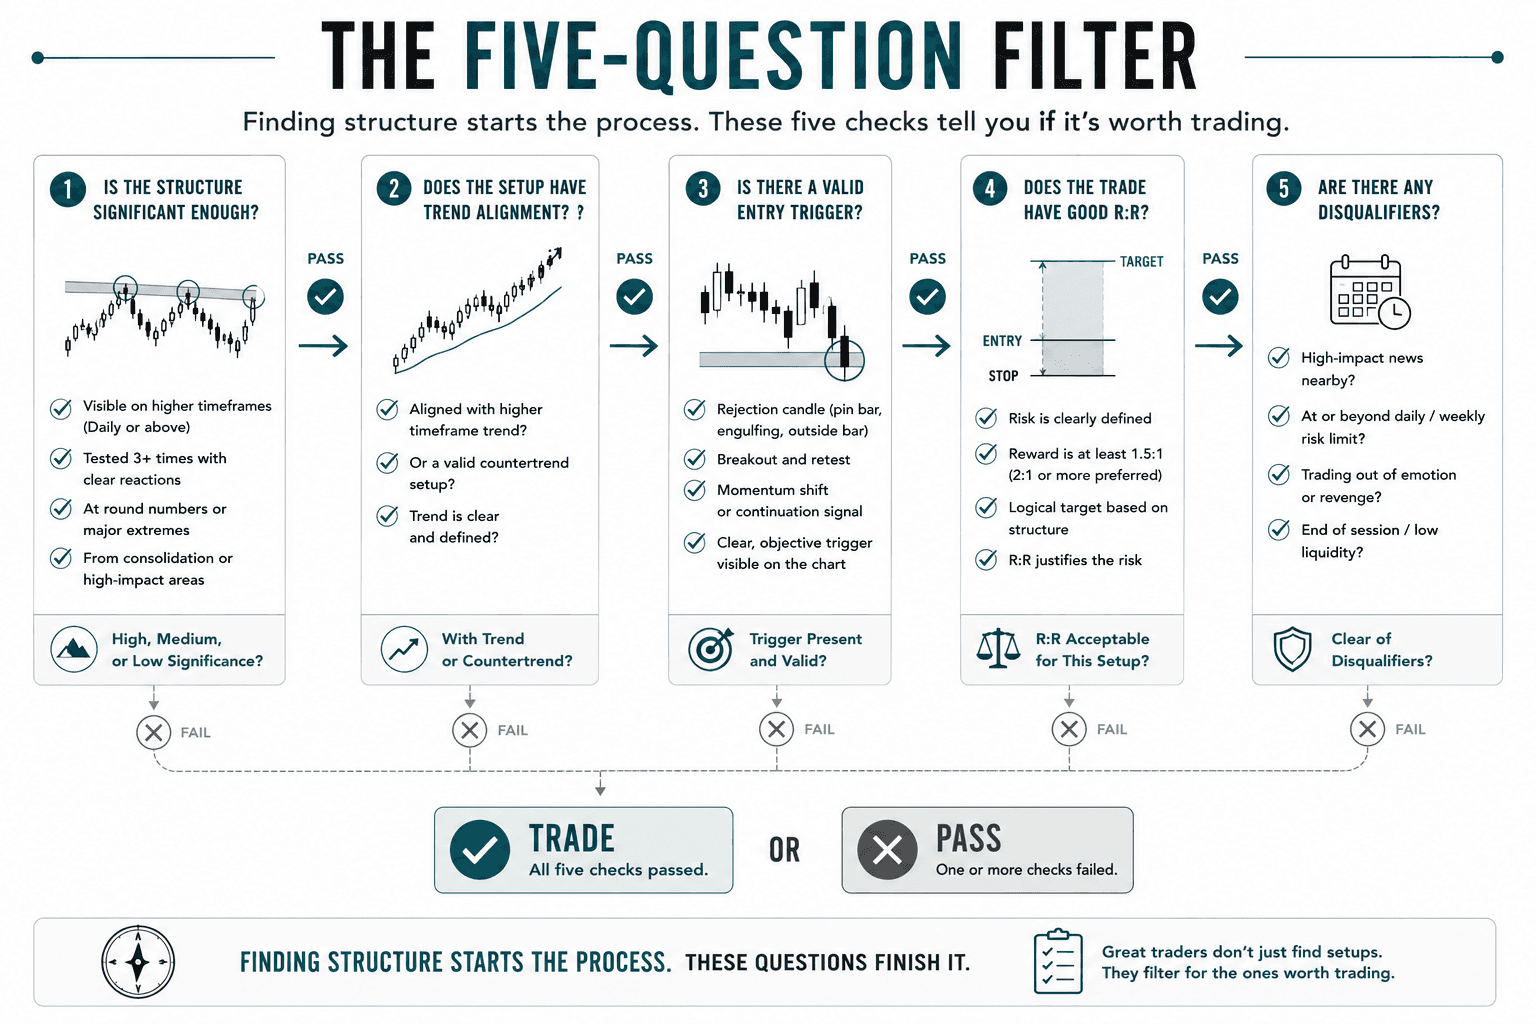
The 5-Step Evaluation Filter
Question 1: Is the Structure Significant Enough?
The Test: Would a significant number of other institutional or retail market participants also identify this as a notable level?
Significance goes far beyond how many times price has touched a line. It is about how prominent the level is to participants across the broader market.
High Significance Levels: These are clearly visible on daily or higher timeframes, tested three or more times with clear rejections, located at round numbers or 52-week extremes, or represent areas of prolonged consolidation where the market agreed on value.
Low Significance Levels: These are only visible on a 15-minute chart or lower, defined by only one or two minor touches, or sitting mid-range with zero macroeconomic context.
Trades based on low significance levels have a much lower probability of producing the expected behavior.
Your Log Entry: "This structure is [highly / moderately / marginally] significant because [reason]."
Question 2: Does the Setup Have Trend Alignment?
The Test: Is your trade direction aligned with the dominant trend on at least one higher timeframe?
Trend-aligned setups carry the massive statistical advantage of macro momentum. Countertrend setups can work, but they require the dominant trend to be completely exhausted or reversing, which demands substantial order flow evidence beyond your local support or resistance level.
Your Log Entry: "This setup is [with trend / countertrend / neutral]. The daily trend is [direction] and the 4H trend is [direction]."
For Countertrend Trades: "The trend appears structurally weakening because [evidence]."
Question 3: Is There a Clear Trigger?
The Test: Is there a specific, undeniable signal telling you that the structure is activating and the anticipated behavior has begun?
A structural level without a trigger is just a line on a chart. Price is sitting at it, but absolutely nothing is happening yet. A trigger is typically a distinct candlestick pattern or a breakout confirmation occurring right at your zone:
A bullish engulfing candle at a major support floor.
A bearish pinbar rejection at a resistance ceiling.
A clean hourly close below a structural neckline.
Without a trigger, the structure is simply in range. With a trigger, it officially becomes a trade setup.
Your Log Entry: "The trigger at this level is [specific candle signal or 'no trigger present yet, monitoring']."
Question 4: Does the R:R Make the Trade Worthwhile?
The Test: Once your entry, stop, and target are explicitly calculated, does the ratio clear your mechanical minimum?
Do not guess this. Calculate it mathematically before clicking execute:
Entry: [price]
Stop: [price] (placed just beyond the structure that completely invalidates your trade thesis)
Target: [price] (the next major structural level or prior swing extreme)
Risk vs Reward Calculation: Reward ÷ Risk
Your Log Entry: "R:R is [X]:1. This [meets / does not meet] my minimum threshold of [1.5:1 or 2:1]."
The Rule: If the R:R fails to meet your threshold, you either find a tighter entry or you walk away.
Question 5: Are There Any Disqualifying Conditions?
The Test: Is there an external variable that should completely halt this trade, regardless of how beautiful the chart looks?
This is your final safety inspection. You must immediately disqualify the setup if you experience any of the following:
High-impact news releases scheduled within the next 60 to 90 minutes, meaning your stop could easily be violated by a sudden news spike.
You are already at your maximum account risk budget across concurrent positions.
The trading session is ending and you will not be able to actively monitor the trade.
Your current emotional state is compromised by anxiety, distraction, or revenge trading.
Your Log Entry: "No disqualifying conditions present" or "Disqualified because [reason]."
The Final Assessment
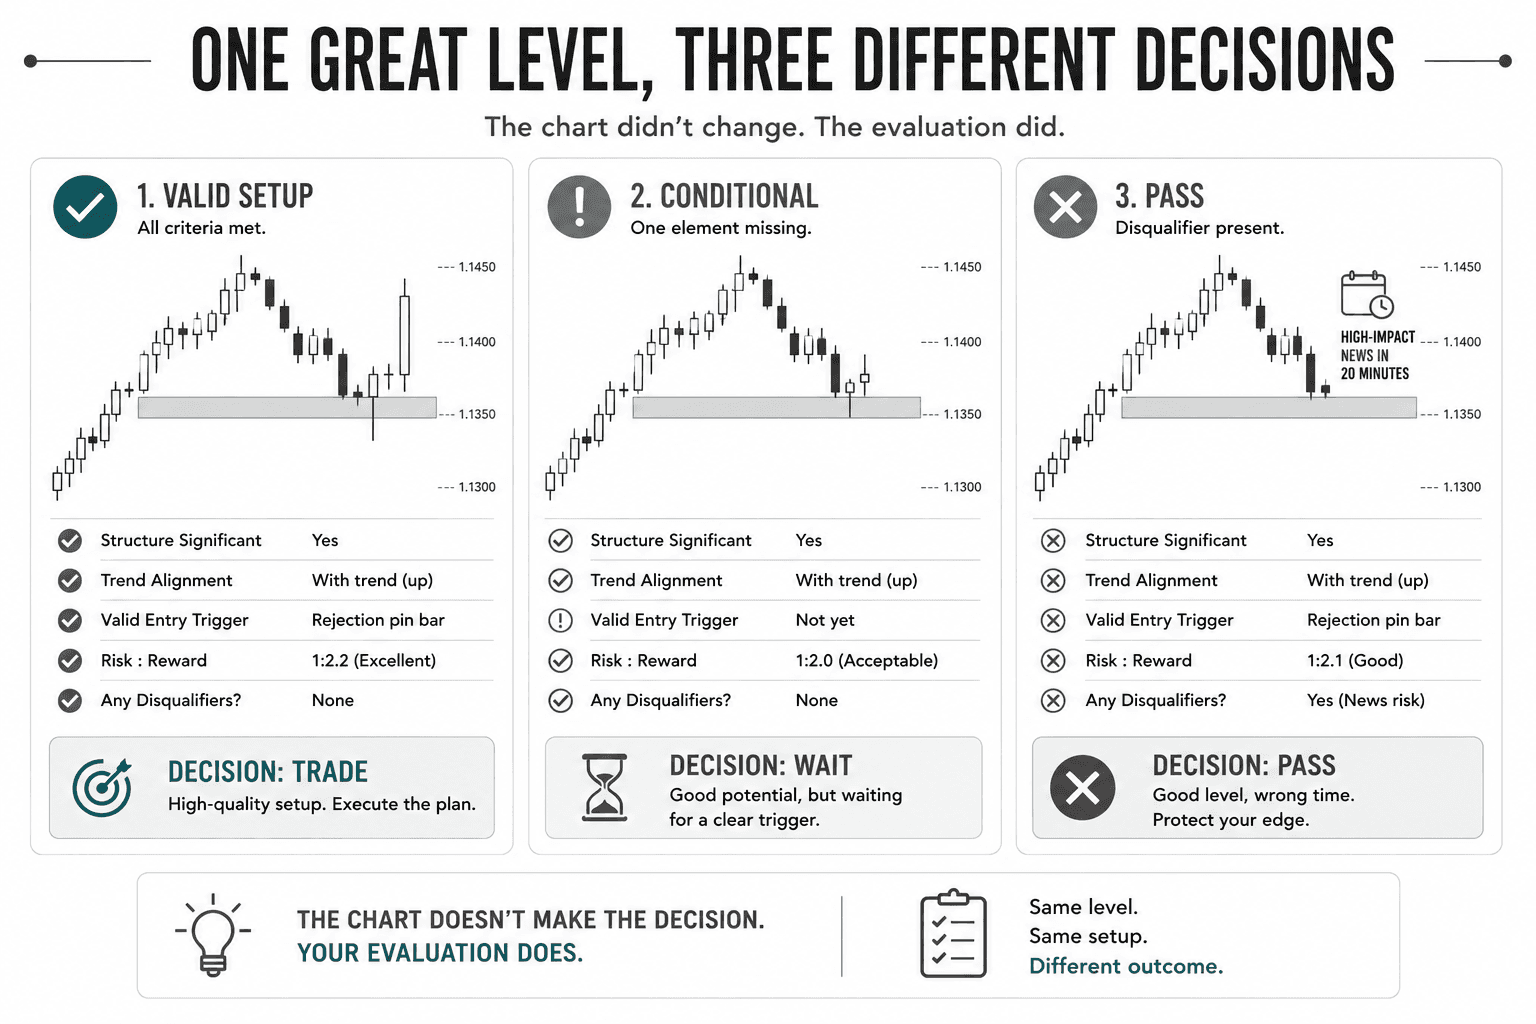
After working your way through all five filters, the potential trade must be classified into one of three strict buckets:
✓ Valid: The setup features significant structure, clear trend alignment, a confirmed trigger, acceptable R:R, and zero disqualifying conditions. Enter the market according to your plan.
⚠ Conditional: One element is slightly borderline; for example, your R:R is 1.4:1 against a 1.5:1 minimum, or a high-quality trigger candle is currently forming but not yet closed. Note exactly what variable would make it valid and monitor it cleanly.
✗ Pass: One or more questions produce a definitive failure. Do not enter under any circumstances. Note the structural flaw in your log and move on to the next chart.
Building the Habit
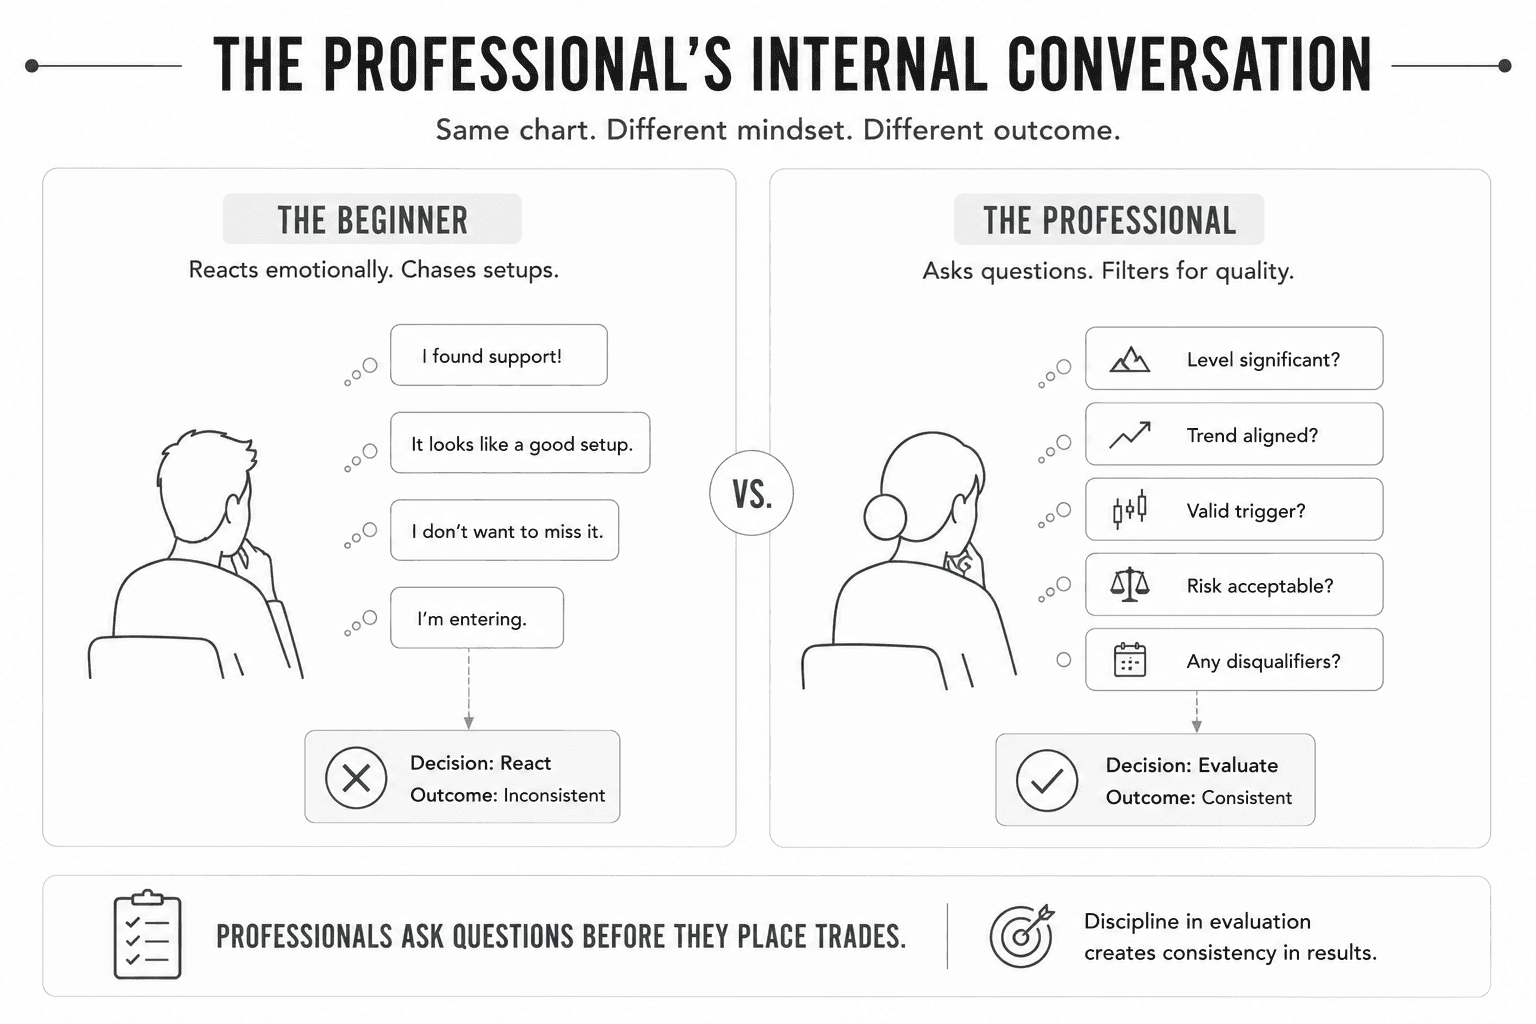
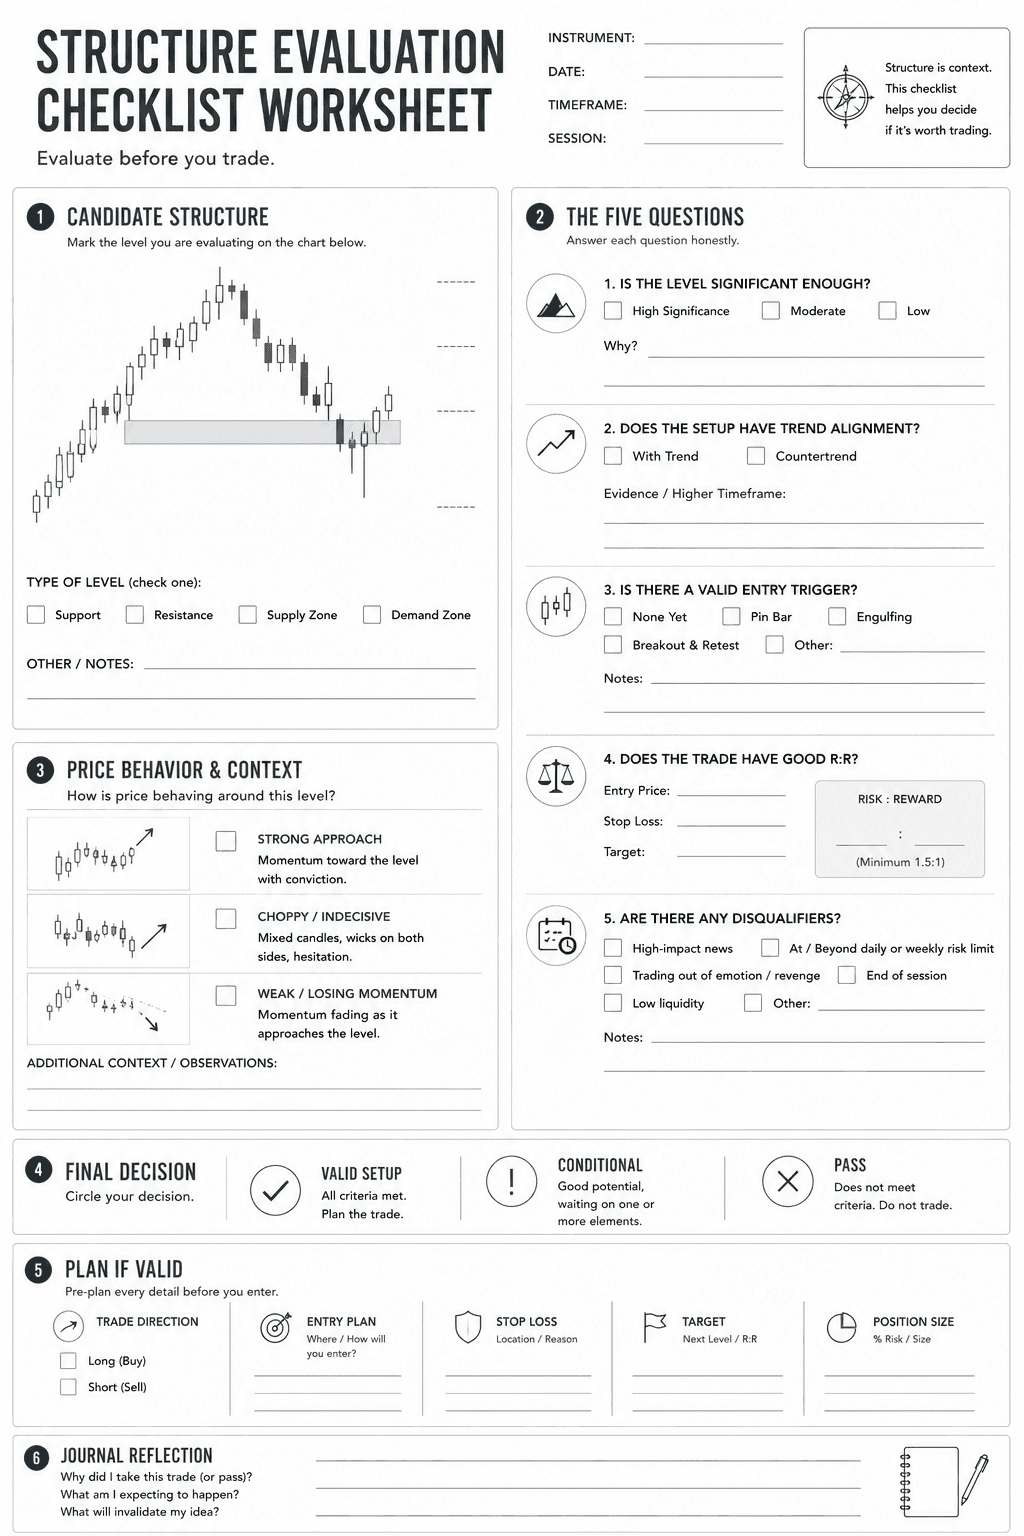
The first 50 times you run this evaluation process, you need to write it out explicitly in your log. All five questions, all five answers. The act of writing is the evaluation itself.
After 100 or more evaluated setups, the process completely internalizes. The questions begin to run automatically the moment your eyes scan a potential level. The decision to pass becomes fast, comfortable, and stress-free. It stops feeling like a missed opportunity and starts feeling like a correct application of professional standards.
That mental shift (moving from "I am missing trades by being too selective" to "I am actively protecting my capital from low-probability entries") is the definitive marker of a developing trader.
Structure tells you where to look. The evaluation tells you whether to act. You absolutely require both before you ever figure out when to pull the trigger.
Success Criteria
You will know you have successfully mastered this lesson when you can look at an active trade setup and confidently do the following:
Quantify Level Significance: Formally defend why a level matters based on higher timeframe visibility, touch count, or psychological confluence.
Verify Execution Triggers: Identify a specific candle close or structural break that proves the level is actively defending before entering.
Calculate Math Expectancy: Compute an exact mathematical risk-to-reward ratio based on structural invalidation points rather than arbitrary pip targets.
Enforce Safety Disqualifiers: Actively pass on a technically beautiful setup due to external risks like high-impact news or compromised trading psychology.
Common Misconception
Finding a significant, valid structural level means you have a trade.
The Truth: Recognizing structure only tells you where a reaction is likely. Trend alignment, a real trigger, favorable R:R, and the absence of disqualifying conditions are separate checks, and a technically valid level can still fail every one of them.
FAQ's
Q: I found a setup with great structure but terrible R:R. What do I do?
Q: How do I handle conflicting timeframes; for example, the daily says bullish but the 4H setup is bearish?
Q: Can I trade from a C-grade structural level if the pattern is strong enough?
Table of Contents
About Me

Krista Weber
After a career as a VP of UX and EdTech executive, I retired early—and quickly realized the traditional world of trading education is fundamentally broken.
As someone with a Master’s in HCI who specialized in the design of e-learning systems, I saw a massive gap: beginners aren't failing because trading is impossible; they’re failing due to massive cognitive overload and terrible instructional design.
This site bridges that gap. I’m applying the principles of learning science, systems thinking, and minimalist UX to strip away the market noise and teach trading the way it actually should be taught.
Stay in Touch
Some of the pages on my travel blog contain affiliate links. Whenever you buy something through one of these links, I get a small commission at no extra cost to you. As an affiliate, I only recommend products and services that I feel are high quality and helpful to my readers. Thanks for your support.
Read More

Open almost any trading platform and you'll see EUR/USD sitting next to XAU/USD, NQ, ES, and a dozen CFDs on stocks you've heard of. They all show up as candlesticks moving left to right, which quietly implies they're all the same kind of thing. They aren't. Before going deeper into any one of them, it's worth drawing the map.
Updated on Sep 6, 2026

Futures are standardized contracts tied to defined specifications and a future settlement date. They can look complex at first, but the mechanics become much clearer once you know what the contract specification controls. Here's what you actually need to know.
Updated on Sep 6, 2026

CFDs appear everywhere in retail trading – but most new traders couldn't explain exactly what they are or why that matters. Here's a plain-language breakdown, including the parts that most introductions skip.
Updated on Sep 6, 2026