
Support & Resistance Part 1: The Foundation Every Trader Builds On
Before indicators, patterns, or strategies — price needs somewhere to go and somewhere to stop. Here's how to see those places.

Learning Path Stage 6: Find Your Strategy
Learning Level 1: Recognition
Primary Learning Objective
By the end of this lesson, you will be able to explain what support and resistance trading is at a conceptual level and why it's one of the most widely applied approaches in retail forex.
Learn Where Price Stops and Turns—And Read Any Chart Like a Blueprint
If you listen to the loud, hyperactive corners of trading social media, you'll hear that wealth comes from a proprietary cocktail of lagging indicators: three overlapping moving averages, a neon-colored MACD, and an RSI that allegedly "predicts the future."
That's just visual clutter. It’s the trading equivalent of slapping twenty flashing buttons on a mobile landing page and hoping for a good user experience. It doesn't work in software, and it definitely doesn't work in the markets.
Before price can trend, reverse, compress, or breakout, it needs exactly two things: somewhere to go, and somewhere to stop. In the markets, those places are called Support and Resistance. Every viable trading strategy on earth—whether practiced by a retail trader in their pajamas or a multi-billion-dollar quant algorithm running in a climate-controlled server rack—answers to these two concepts.
The Wireframe of the Market
Strip away the academic textbook definitions and look at the raw mechanics:
Support is a price floor. It's a level where a declining asset historically stops, pauses, and bounces back up because buying pressure overwhelms selling pressure.
Resistance is a price ceiling. It's a level where a rising asset historically hits a wall, stalls, and reverses because sellers step into the room.
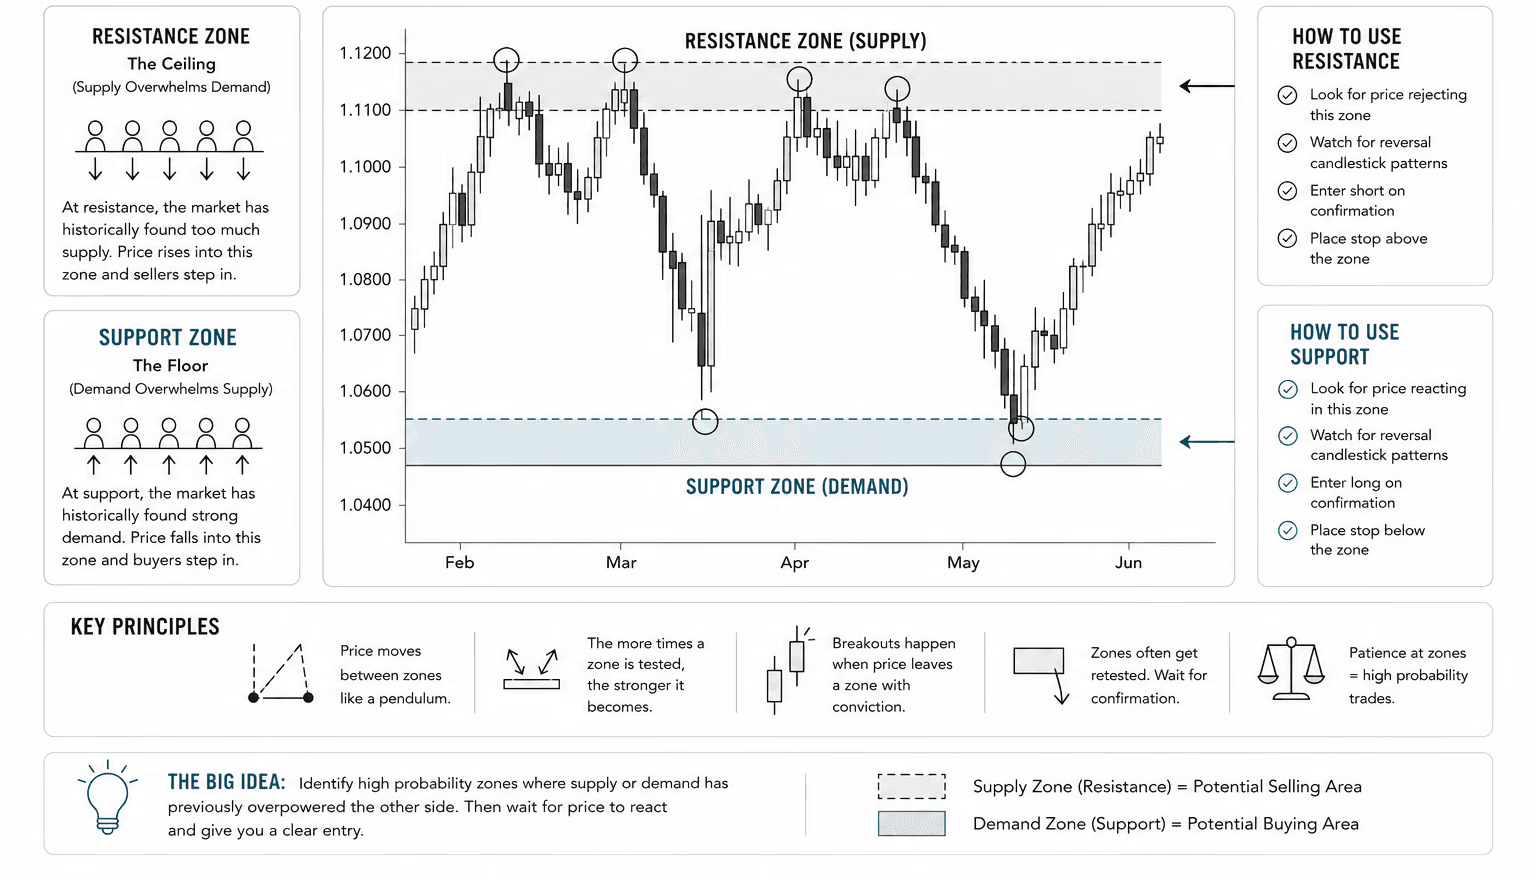
In textbooks, these levels are drawn as crisp, single-pixel horizontal lines. In reality? They are messy, behavioral zones.
The Behavioral Psychology (Why the Zones Exist)
Charts don't move because of geometry or Fibonacci magic. They move because of human memory and institutional order flow. Support and resistance zones are created by three groups of market participants experiencing intense cognitive biases at the exact same time:
1. The Longs (The Triumphant)
These are the buyers who entered at a specific floor, watched price rocket upward, and are currently kicking themselves for not buying more. The next time price drifts back to that same floor, they don't hesitate—they buy again. The memory of recent profit turns a random price point into a psychological anchor.
2. The Shorts (The Trapped)
These are the sellers who shorted the market at that floor, expecting it to break. Instead, they watched price rip upward against them. After weeks of intense psychological stress, staring at a floating red loss and praying for a pullback to save their account, price finally drops back to their original entry. The moment it hits, they aggressively buy to close their short positions with zero damage.
3. The Observers (The FOMO Crowd)
Traders who watched the original bounce happen, hesitated, and missed the train. They've spent days staring at the chart thinking, "If price ever goes back to that level, I'm absolutely getting in."
The Result: When price returns to the floor, all three groups—the triumphant, the trapped, and the envious—simultaneously smash the BUY button. This creates a massive, synchronized influx of demand over supply, and the floor holds.
Role Reversal: The Flipping Point
One of the most elegant, structural behaviors in market analysis is the identity flip: once a level is cleanly breached, it completely reverses its role.
Broken Resistance becomes Support.
Broken Support becomes Resistance.
Think of it like moving up a floor in an apartment building. Yesterday's ceiling is today's floor.

Why does this happen? The psychology completely inverts. If price punches through a heavy resistance ceiling, the short-sellers defending it are suddenly trapped in a catastrophic loss. When price dips back to that broken ceiling, those shorts scramble to buy and exit at break-even, while breakout buyers rush to add to their positions. The old ceiling is now defended as a floor.
Keeping Cognitive Load Low: The 3-Step Workflow
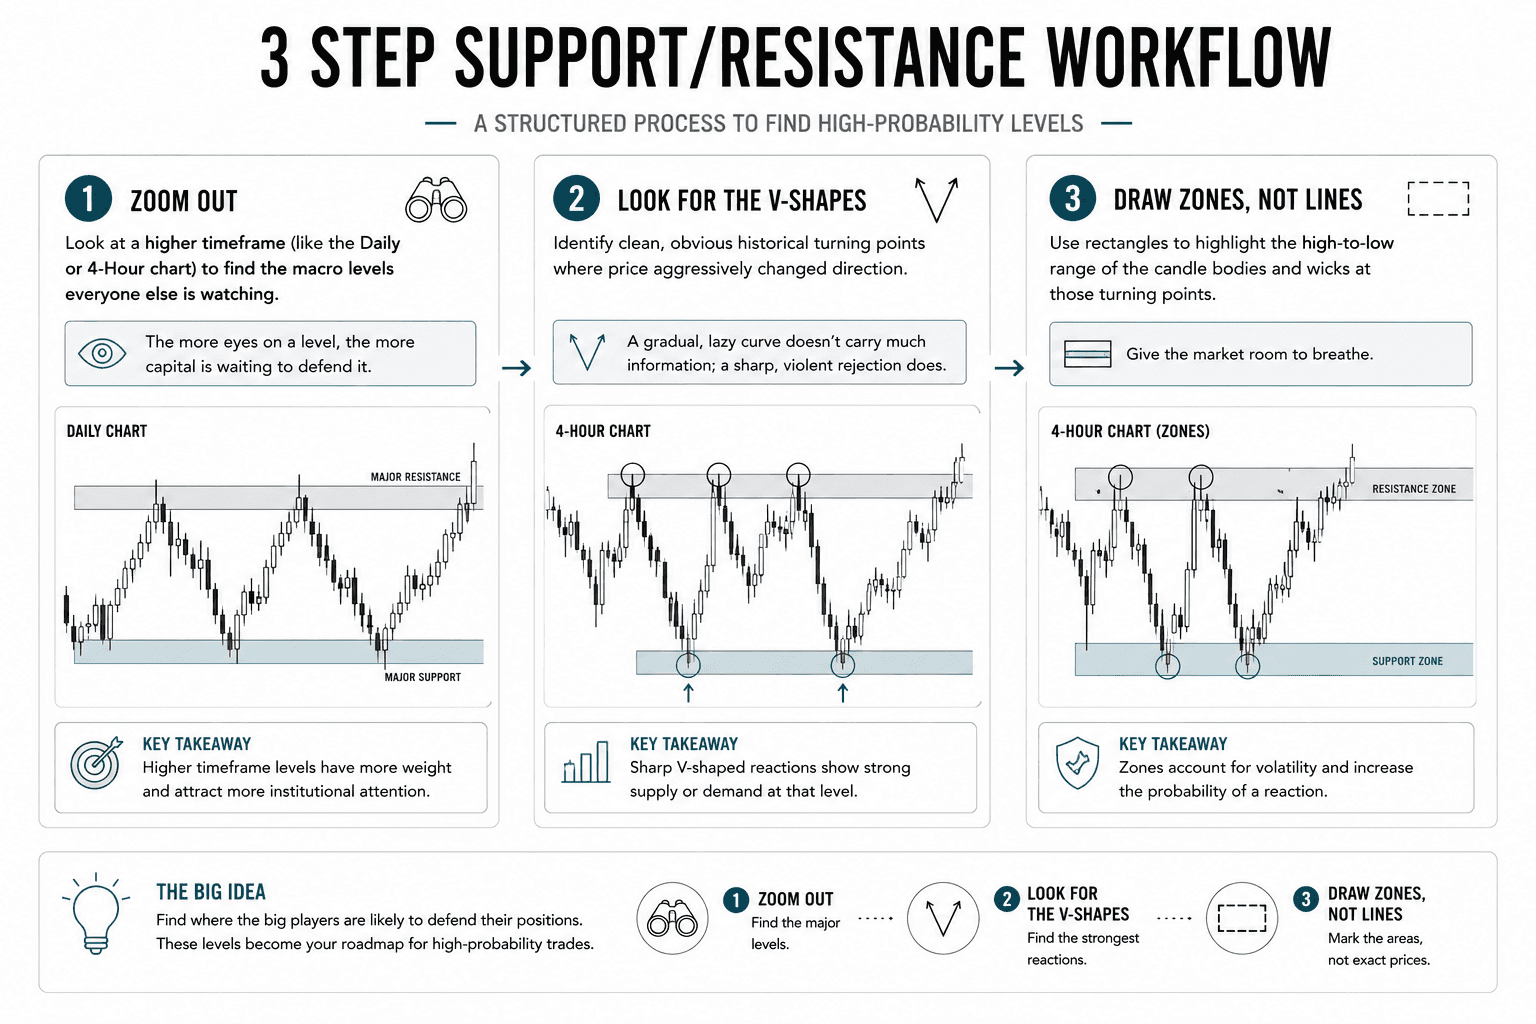
Your goal when opening a blank chart is not to draw fifty lines until it looks like a spiderweb. That leads straight to analysis paralysis. Keep your user interface clean with a simple, three-step structural workflow:
Zoom Out: Look at a higher timeframe (like the Daily or 4-Hour chart) to find the macro levels everyone else is watching. The more eyes on a level, the more capital is waiting to defend it.
Look for the V-Shapes: Identify clean, obvious historical turning points where price aggressively changed direction. A gradual, lazy curve doesn't carry much information; a sharp, violent rejection does.
Draw Zones, Not Lines: Use rectangles to highlight the high-to-low range of the candle bodies and wicks at those turning points. Give the market room to breathe.
The Product Roadmap
This post is your wireframe—the structural foundation. Over the next five parts of this Support & Resistance series, we build out the full application.
Here is where our development pipeline is heading:
Part 1: The Foundation Every Trader Builds On (You are here)
Part 2: The Mechanics – How support and resistance actually work under the hood and the exact mechanics of why they eventually break.
Part 3: The Cultural Consensus – Why this is the rare, mythical concept that fundamental analysts, technical chartists, and high-frequency algorithms all agree on.
Part 4: The Resource Filter – A curated, zero-fluff list of books, tools, and learning materials actually worth your finite cognitive energy.
Part 5: The Hard Data – How to backtest a support and resistance strategy without lying to yourself or optimizing your data into an illusion.
Stop searching for a holy grail indicator that promises a zero-effort win rate. Learn to read the architectural boundaries of the market first. Your eyes, and your trading account, will thank you.
Success Criteria
After completing this lesson, you should be able to describe the core premise of support and resistance trading, identify who it tends to work for, and explain where it fits in the broader landscape of trading approaches.
Common Misconception
Support and resistance is a beginner approach that traders graduate out of.
The Truth: It's applied at every level of sophistication, from simple retail use to institutional order flow analysis; the complexity lies in execution and context, not the concept itself.
FAQ's
Q: Is support and resistance the same as supply and demand?
Q: How is supply and demand different from regular support and resistance?
Q: Do support and resistance levels ever stop working?
Table of Contents
About Me

Krista Weber
After a career as a VP of UX and EdTech executive, I retired early—and quickly realized the traditional world of trading education is fundamentally broken.
As someone with a Master’s in HCI who specialized in the design of e-learning systems, I saw a massive gap: beginners aren't failing because trading is impossible; they’re failing due to massive cognitive overload and terrible instructional design.
This site bridges that gap. I’m applying the principles of learning science, systems thinking, and minimalist UX to strip away the market noise and teach trading the way it actually should be taught.
Stay in Touch
Some of the pages on my travel blog contain affiliate links. Whenever you buy something through one of these links, I get a small commission at no extra cost to you. As an affiliate, I only recommend products and services that I feel are high quality and helpful to my readers. Thanks for your support.
Read More

Open almost any trading platform and you'll see EUR/USD sitting next to XAU/USD, NQ, ES, and a dozen CFDs on stocks you've heard of. They all show up as candlesticks moving left to right, which quietly implies they're all the same kind of thing. They aren't. Before going deeper into any one of them, it's worth drawing the map.
Updated on Sep 6, 2026

Futures are standardized contracts tied to defined specifications and a future settlement date. They can look complex at first, but the mechanics become much clearer once you know what the contract specification controls. Here's what you actually need to know.
Updated on Sep 6, 2026

CFDs appear everywhere in retail trading – but most new traders couldn't explain exactly what they are or why that matters. Here's a plain-language breakdown, including the parts that most introductions skip.
Updated on Sep 6, 2026