
Support & Resistance Part 5: How to Backtest (Without Fooling Yourself)
A practical guide to testing your S&R approach on historical data — and the biases that make most backtesting results useless.

Learning Path Stage 5: Sim Trading & Journaling
Learning Level 3: Application
Primary Learning Objective
By the end of this lesson, you will be able to design and execute a backtesting procedure for a support and resistance trading approach.
It's Really Easy To Be A Great Trader When You Lie to Yourself
If you have made it this far, congratulations: you now know how support and resistance actually functions, how the institutional machinery weaponizes it, and where to find legitimate resources. But we have arrived at the ultimate inflection point. This is where we transition from passive chart-gazing to clinical system design.
And this is also where most retail traders end up with a false belief that they have cracked the S&R code and are on the train to money town.
Backtesting support and resistance sounds like a relaxing Sunday afternoon activity. You open a completed historical chart, draw a few neat boxes where price obviously boomed or crashed, scroll backward, and count your hypothetical millions.
There is a glaring software defect in that approach: hindsight bias. When your brain already knows how the chart ends, it automatically assigns "genius structural significance" to the levels that held, while your memory completely scrubs out the dozens of levels that got steamrolled like they weren't even there. Your backtest records a fictional 75% win rate, but your live account will record a very real margin call.
Our goal for this final module isn't to make you feel good. It’s to build a testing engine that reflects what would have actually happened under the cold uncertainty of live market order flow.
The Hindsight Kill-Switch: Manual Chart Replay
There is really only one way to backtest discretionary S&R without completely fooling yourself: the chart replay tool. Algorithmic backtesting scripts are great for fixed mechanical channels, but human visual processing is required to assess messy structural zones. To control for hindsight, you must use candle-by-candle replay to explicitly hide the future. If you are scrolling through a completed static chart, you aren't testing a strategy; you're just looking at a historical photo album.
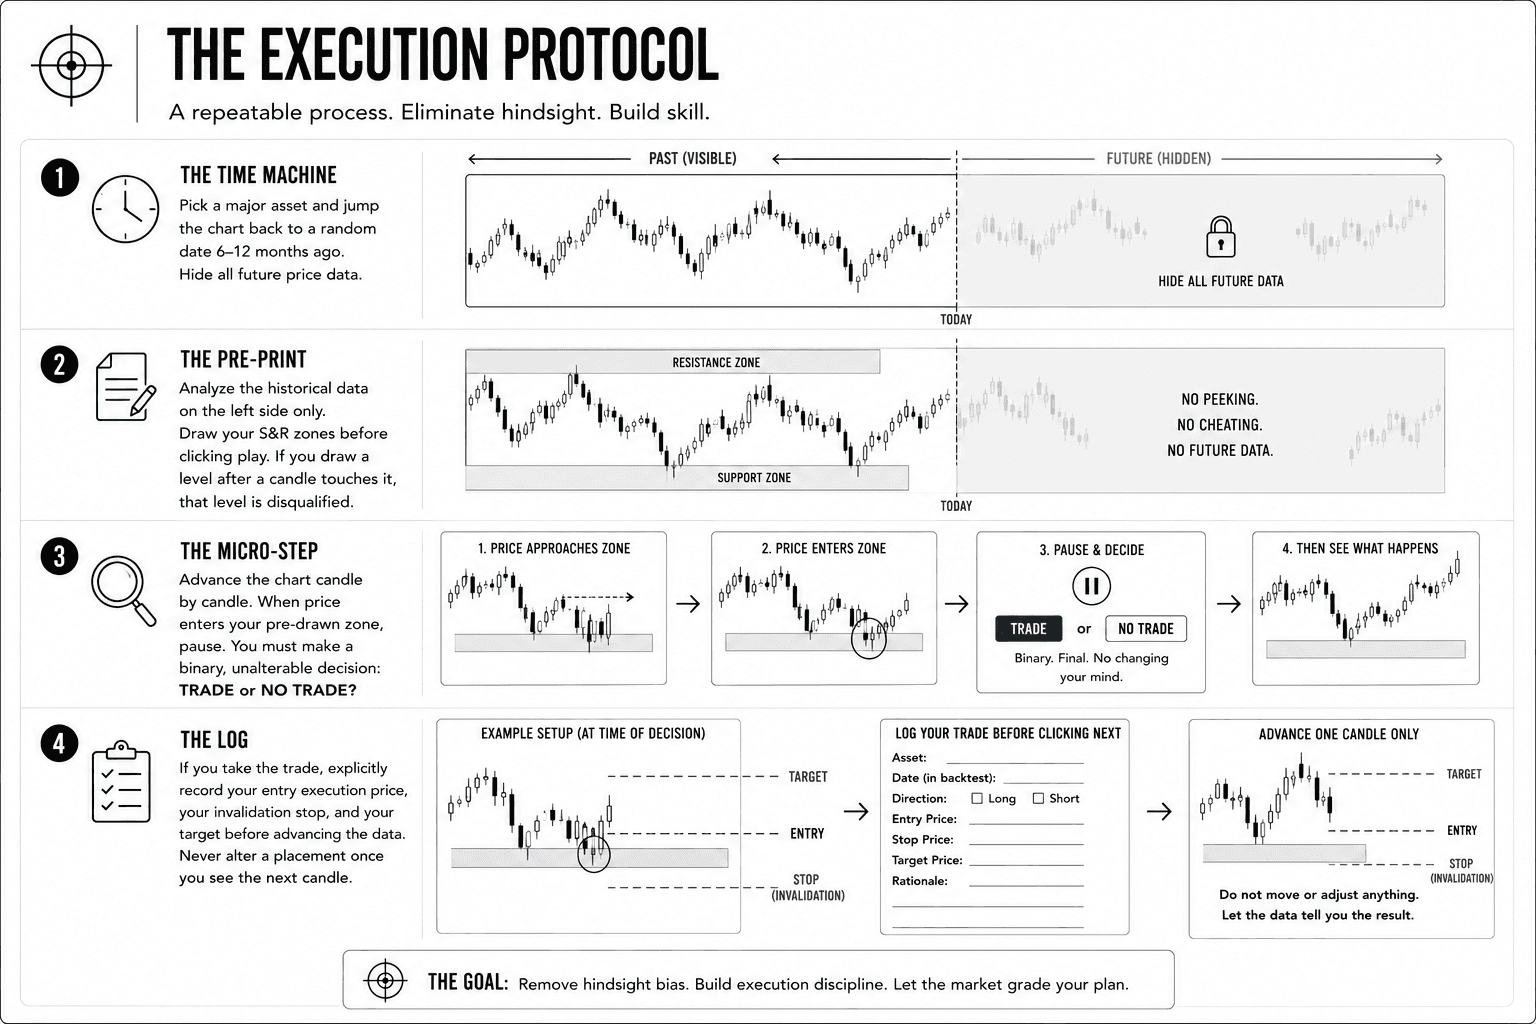
The Execution Protocol:
The Time Machine: Pick a major asset and jump the chart back to a random date six to twelve months ago. Hide all future price data.
The Pre-Print: Analyze the historical data available on the left side of your screen only. Draw your S&R zones before clicking play. If you draw a level after a candle touches it, that level is disqualified.
The Micro-Step: Advance the chart candle by candle. When price enters your pre-drawn zone, pause. You must make a binary, unalterable decision: Trade or No Trade? 4. The Log: If you take the trade, explicitly record your entry execution price, your invalidation stop, and your target before advancing the data. Never alter a placement once you see the next candle.
The Data Schema: What Your Log Must Capture
A backtest is only as intelligent as the data fields you choose to track. If you only record "Win" or "Loss," you are leaving 90% of your operational edge on the table. Your log needs to track the full context of the market interface, including the setups you choose to skip.
Core Tracking Fields:
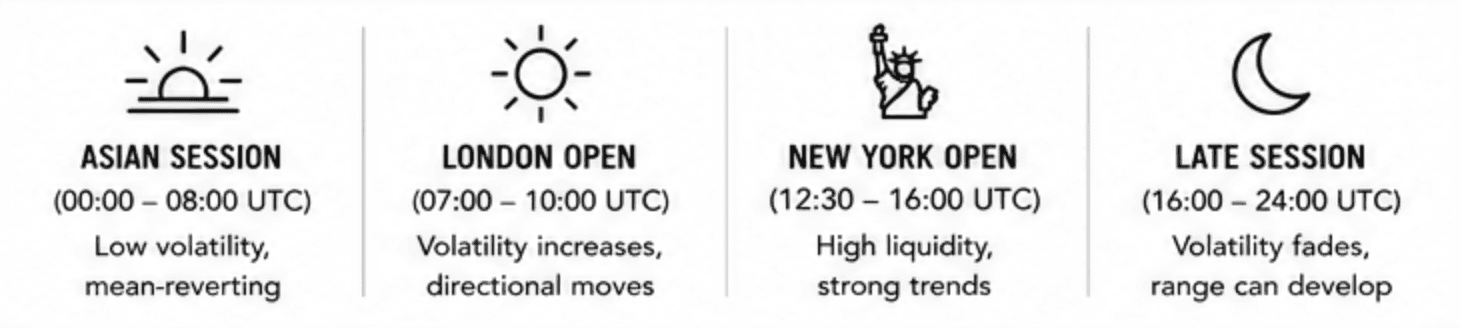
Session Signature: S&R zones behave vastly different during the high-liquidity New York or London opens than they do during the quiet, mean-reverting Asian session.
Structural Timeframe: Is this a rock-solid Daily level, a structural 4-Hour zone, or a noisy 1-Hour line?

The Touch Count: How many times has the market previously reacted to this exact zone? Is it a fresh, highly orders-dense level (Touch 1), or a depleted, fragile floor that has been pounded four times already?

The Entry Interface: Did you buy aggressively the microsecond price stepped into the box (Aggressive), did you wait for a clean daily rejection candlestick to print (Confirmation), or did you wait for price to break out and retest the roof from above (Conservative)?

Maximum Adverse Excursion (MAE): This is a critical metric. It records exactly how far price moved against your position before either hitting your stop or running to your target. If your stop is 30 pips away, but your winners never move more than 8 pips into the negative, your stop architecture is bloated and killing your position sizing.

The "Did Not Trade" (DNT) Log: You must document the setups you actively chose to pass on and the exact rule that filtered you out. Tracking your skipped trades is the only way to mathematically prove whether your entry filters are actually protecting your capital or if they are just shrinking your sample size out of cowardice.

Four Psychological Bugs That Inflate Your Spreadsheets
When humans backtest manually, their brains will subconsciously try to optimize the results to trigger a dopamine hit. Watch out for these four common behavioral defects:
1. Cherry-Picking the Entry Candle
On a completed historical chart, it is incredibly easy to say, "Oh, I would have perfectly timed my entry right at the absolute tip of that long rejection wick." No, you wouldn't have. In real-time execution, you don't get to see the wick until the candle closes. If your rules require waiting for a candle close, you would have entered at a much worse price, which completely alters your risk-to-reward metrics.

2. Selective Level Definition
If your pre-drawn level gets sliced through like warm butter, your brain will try to rationalize it: "Well, that wasn't a major level anyway, I wouldn't have actually taken that trade." This is a circular, self-serving argument. If it’s on your chart before the replay starts, it counts as a loss. No editing the ledger. The market doesn't have an undo button.

3. Market Regime Blindness
Running an S&R backtest exclusively through a three-month sideways consolidation range will yield an insanely high win rate. Running that exact same strategy through a violent, trending macro expansion phase will completely wipe out your account. Your testing window must span multiple market regimes to prove its structural resilience.

4. Sample Size Overconfidence
Logging 15 trades tells you absolutely nothing. It is a statistical anomaly. Fifty trades is the absolute bare minimum required to formulate a basic operational hypothesis. One hundred trades across contrasting market environments is where the data actually begins to reflect a verified mathematical edge.

Decoupling the Report: How to Read Your Data
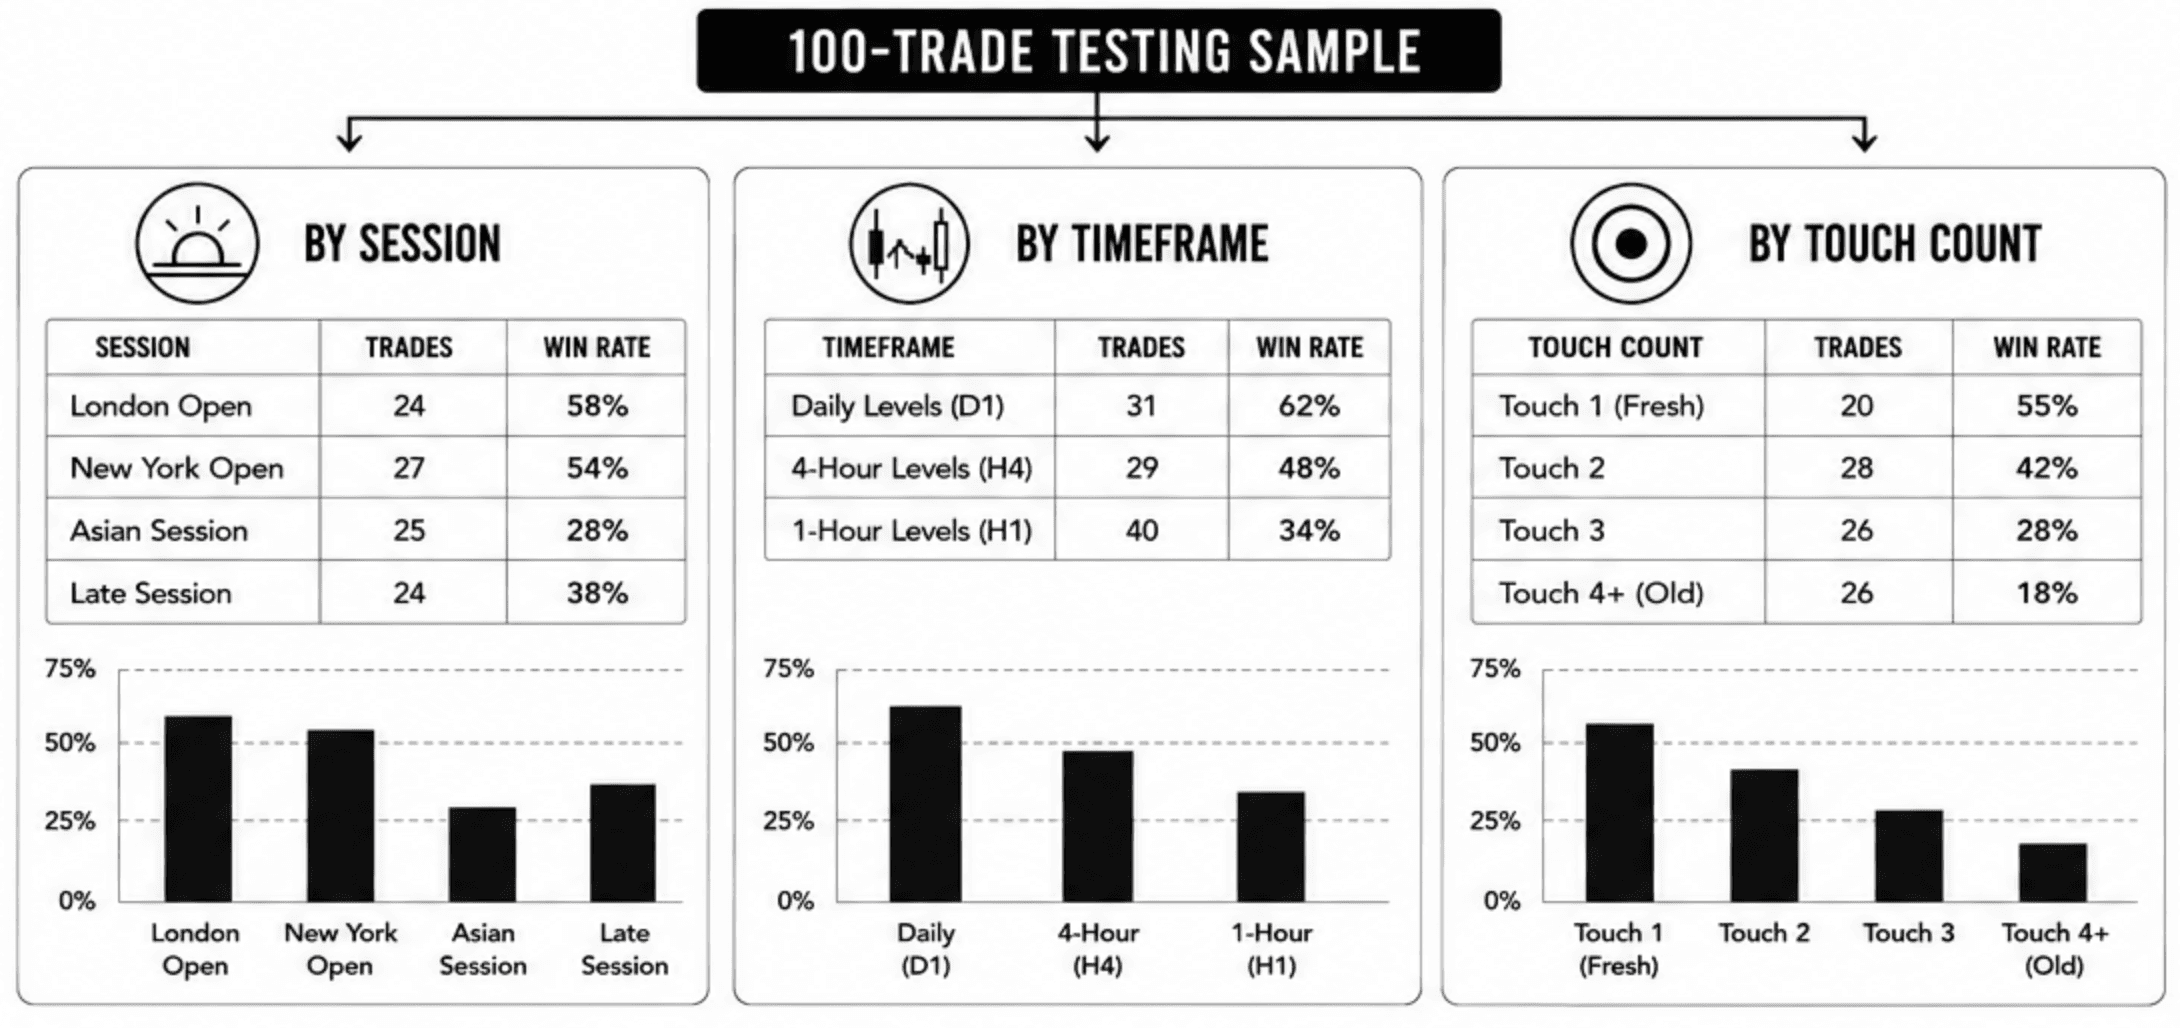
Once you have logged your sample size, stop obsessing over the aggregate win rate. An aggregate number hides the actionable data. You need to segment your report to find out where your specific edge is hiding:
Filter by Timeframe: If your data reveals a 65% win rate on Daily zones but a abysmal 32% win rate on 1-Hour zones, you have discovered something vital: your edge only exists on the higher-timeframe wireframes. You can immediately delete the lower-timeframe noise from your operational routine.
Filter by Touch Count: Do your first-touch reactions dramatically outperform third and fourth touches? If the win rate completely falls off a cliff after the third touch, your data is telling you that the resting institutional order blocks have been entirely depleted. Stop buying old floors.
Calculate Risk-Adjusted Expectancy: A flashy 70% win rate means absolutely nothing if your average losing trade is three times larger than your average winner. Conversely, an ugly, emotionally grueling 40% win rate will fund a spectacular lifestyle if your average winning trade yields a 3:1 reward-to-risk payoff.
The Reality Check
An honest, manual backtest of support and resistance is a highly sobering experience. It will quickly shatter the retail illusion that these lines are magic boundaries that work flawlessly across every asset and timeframe.
The data will likely reveal that your edge is actually narrow, highly conditional, and entirely dependent on specific sessions and higher-timeframe structures.
But here is the secret: that narrow, conditional edge is exactly how professional operators extract money from the market. The universal, "works everywhere all the time" version only exists in marketing brochures. The conditional, highly restricted version is real, robust, and tradeable.
Now take this protocol, open your charting interface, turn on replay mode, and go find out if your trading thesis can actually survive a run-in with historical reality.
Additional Articles in This Series:
Part 2: The Mechanics – How support and resistance actually work under the hood and the exact mechanics of why they eventually break.
Part 3: The Cultural Consensus – Why this is the rare, mythical concept that fundamental analysts, technical chartists, and high-frequency algorithms all agree on.
Part 4: The Resource Filter – A curated, zero-fluff list of books, tools, and learning materials actually worth your finite cognitive energy.
Part 5: The Hard Data – How to backtest a support and resistance strategy without lying to yourself or optimizing your data into an illusion.
Success Criteria
After completing this lesson, you should be able to define specific, testable rules for your S&R approach, run the test across a meaningful data set, and evaluate results using the appropriate metrics.
Common Misconception
Backtesting S&R is unreliable because the levels are subjective.
The Truth: The subjectivity can be managed by defining precise criteria for level selection before testing and applying them mechanically, which actually makes the backtest more rigorous than many quantitative approaches.
FAQ's
Q: How do I avoid hindsight bias when backtesting S&R?
Q: What win rate should I expect from a properly backtested S&R strategy?
Q: How many trades do I need to backtest before my results mean anything?
Table of Contents
About Me

Krista Weber
After a career as a VP of UX and EdTech executive, I retired early—and quickly realized the traditional world of trading education is fundamentally broken.
As someone with a Master’s in HCI who specialized in the design of e-learning systems, I saw a massive gap: beginners aren't failing because trading is impossible; they’re failing due to massive cognitive overload and terrible instructional design.
This site bridges that gap. I’m applying the principles of learning science, systems thinking, and minimalist UX to strip away the market noise and teach trading the way it actually should be taught.
Stay in Touch
Some of the pages on my travel blog contain affiliate links. Whenever you buy something through one of these links, I get a small commission at no extra cost to you. As an affiliate, I only recommend products and services that I feel are high quality and helpful to my readers. Thanks for your support.
Read More

Open almost any trading platform and you'll see EUR/USD sitting next to XAU/USD, NQ, ES, and a dozen CFDs on stocks you've heard of. They all show up as candlesticks moving left to right, which quietly implies they're all the same kind of thing. They aren't. Before going deeper into any one of them, it's worth drawing the map.
Updated on Sep 6, 2026

Futures are standardized contracts tied to defined specifications and a future settlement date. They can look complex at first, but the mechanics become much clearer once you know what the contract specification controls. Here's what you actually need to know.
Updated on Sep 6, 2026

CFDs appear everywhere in retail trading – but most new traders couldn't explain exactly what they are or why that matters. Here's a plain-language breakdown, including the parts that most introductions skip.
Updated on Sep 6, 2026