
Support & Resistance Part 3: The Most Agreed-Upon Idea in Trading
S&R is the rare concept that technical traders, fundamentalists, and institutions all reference — and understanding why that consensus exists tells you a lot about how markets actually work.

Learning Path Stage 6: Find Your Strategy
Learning Level 2: Understanding
Primary Learning Objective
By the end of this lesson, you will be able to explain why support and resistance trading is so pervasive in retail trading culture and critically evaluate the claims made on its behalf.
How 200 Years of Price Memory Still Drives Every Trade You Take
If you lock a technical chartist, a fundamental stock analyst, and a quantitative high-frequency software engineer in a room together, they will spend hours arguing. The chartist will call macroeconomics a lagging indicator; the fundamental analyst will call chart drawing "financial nonsense for men who look at monitors in the dark"; and the quant will quietly design an algorithm to front-run both of them while they aren't looking.
Yet, if you open a chart and point to a massive, screamingly obvious historical price floor, a miracle happens: all three of them will suddenly fall silent and nod in synchronized agreement.
Support and resistance is the rare, cross-disciplinary holy grail of the financial world. It has survived over two centuries of market evolution, outlasting the transition from handwritten trading ledgers to high-frequency fiber-optic cables. It doesn’t hold because of some mystical geometric alignment or because the universe loves rectangles. It holds because it maps a fundamental truth about human cognition: market participants have predictable price memory, and when a crowd concentrates its attention on one number, things get weird.
The 200-Year Wireframe: From Charles Dow to Modern Desks
Support and resistance started with raw, unrefined observation long before anyone figured out they could package it into a $1,499 Discord mentorship course.
Charles Dow (the pioneer behind the Dow Jones Industrial Average) wrote a series of editorials in The Wall Street Journal between 1900 and 1902. Without the benefit of multi-monitor setups or colorful neon indicators, he noted that markets move in distinct, behavioral sequences of highs and lows. His core observation was beautifully simple: price routinely struggles to cross boundaries where it previously experienced a massive shift in power.
Over a century later, we are still organizing our entire trading software interfaces around that exact same premise. That level of staying power is incredibly rare in finance. S&R isn’t a flawless crystal ball, but the underlying psychology, that humans anchor their financial trauma and expectations to historical price nodes, remains an unbroken law of market mechanics.
The Four Tribes of the Consensus
To understand why these zones are so powerful, look at how the four major market participants independently utilize the exact same structural grid, even while pretending they are entirely different species:
1. The Technical Chartist
Whether a retail trader is using traditional Japanese candlesticks, classic chart patterns, or modern, over-complicated "Smart Money Concepts" frameworks with a dozen acronyms, the foundational architecture is identical. They are all drawing boxes to figure out one thing: Where is the floor, and where is the ceiling? They use these levels to anchor their entire system of entries, profit targets, and invalidation stops.
2. The Fundamental Analyst
Fund managers who pride themselves on reading multi-page corporate balance sheets instead of charts still use the exact same vocabulary when they think no one is listening. Their research reports are filled with lines like: "The stock was aggressively rejected at $200," or "The currency broke through its 52-week low handle." Their logic is purely economic in that certain prices represent vital valuation thresholds that instantly focus institutional attention.
3. The Algorithmic Quantitative Strategy
Automated models don't have feelings, but they do have servers. Mean-reversion algorithms are explicitly programmed to buy assets when they stretch too far from a historical support node. Momentum and breakout systems are coded to aggressively ramp up their order size the millisecond a major resistance ceiling is shattered. It doesn't matter whether a quantitative researcher calls it a "support zone" or "the death of common sense". Their algorithms are tracking the exact same behavioral pattern.
4. The Institutional Order Flow
Central banks, mega hedge funds, and market makers use their own enterprise jargon. They love to talk about "order blocks," "value areas," and "prior settlement levels". But their heavy execution footprint is what actually builds the lines retail traders stare at. When an institutional block order is resting at a specific price, a violent bounce off that zone isn't a technical coincidence; it’s the physical manifestation of resting institutional capital being filled.

The Ultimate Self-Fulfilling Prophecy
Here is the fascinating psychological wrinkle of market design: When enough participants watch the exact same level, the level works simply because everyone is watching it.
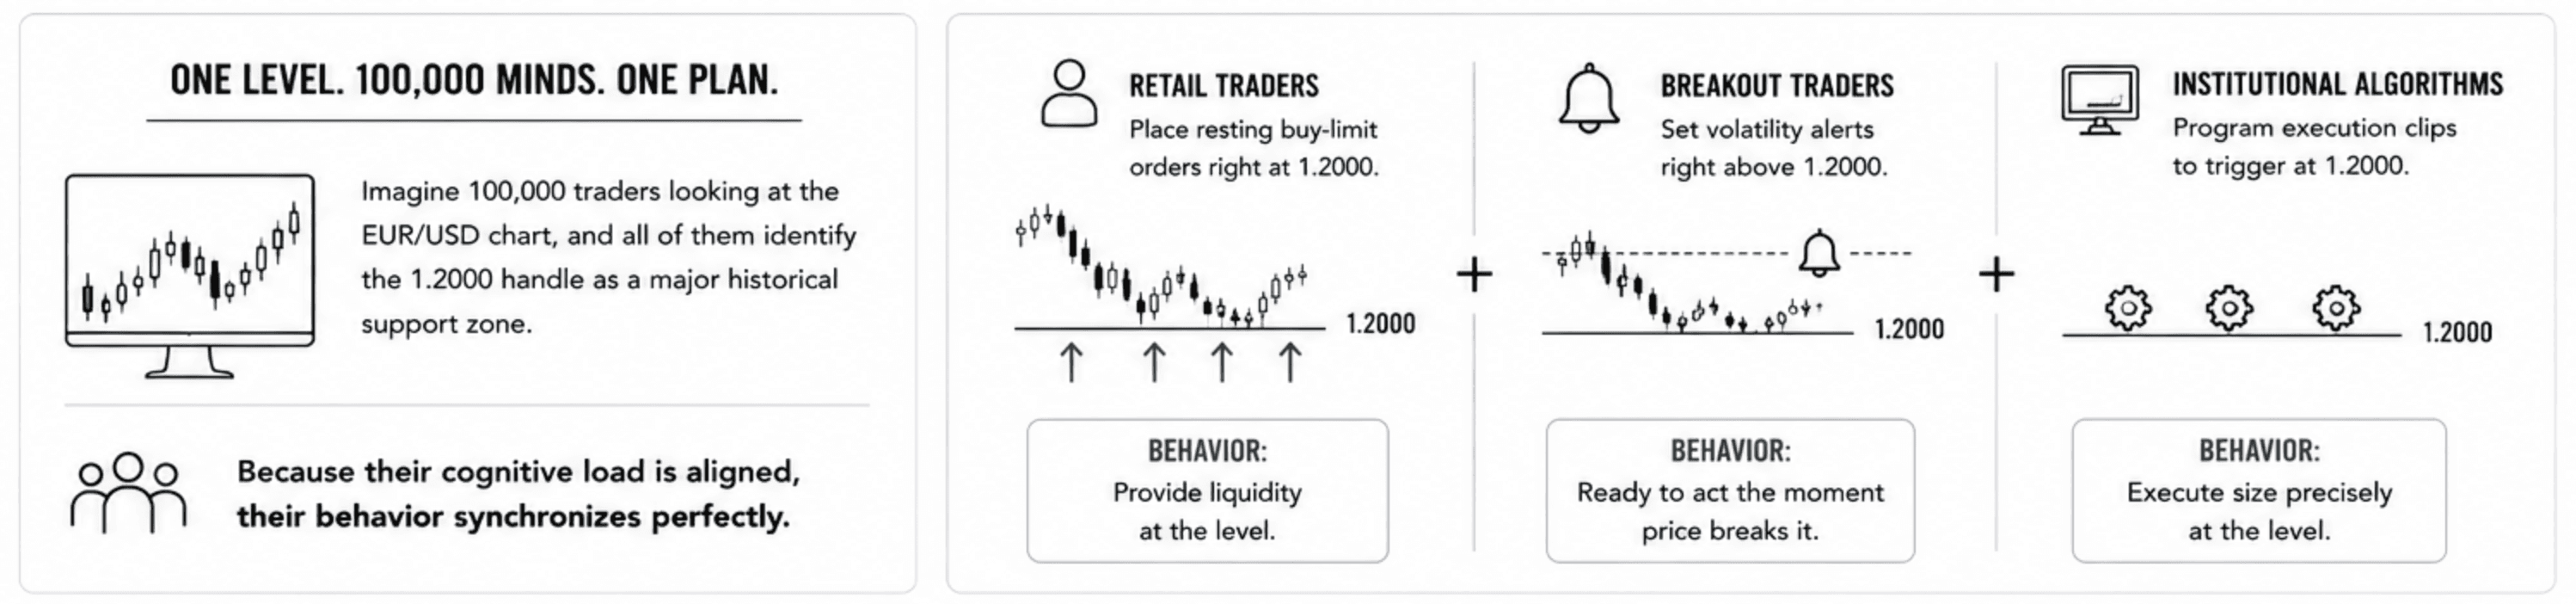
Imagine 100,000 traders looking at the EUR/USD chart, and all of them identify the 1.2000 handle as a major historical support zone. Because their cognitive load is aligned, their behavior synchronizes perfectly:
Retail traders place resting buy-limit orders right at 1.2000.
Breakout traders set volatility alerts right above 1.2000.
Institutional algorithms program execution clips to trigger at 1.2000.
When price finally drifts down to touch that exact digit, a massive wall of prepared capital activates simultaneously. The aggressive buying pressure that causes the ensuing bounce isn’t caused by a magical feature of the number 1.2000. It is the collective action of a synchronized crowd executing the exact same plan at the exact same millisecond.
This also explains a foundational rule of chart layout: Higher timeframe levels work infinitely better than lower timeframe levels. The Daily chart is being monitored by everyone from macro position funds down to intraday scalpers. The 5-minute chart is only being watched by a tiny, hyper-specific subset of short-term day traders who are a tiny drop in a sea of money. More eyeballs equals more capital, which yields a far more reliable structural reaction. If you are drawing support lines on a 1-minute chart without starting at a higher timeframe, you aren't trading structure; you're gambling.
The Dark Side of Consensus: The Liquidity Sweep
The exact same consensus that gives support and resistance its edge also makes it an incredibly dangerous honey trap. When a price level is obvious enough for a retail textbook to highlight it, institutional algorithms know exactly where your protective stop-losses are hiding.
This behavioral trap is called a liquidity sweep, or more accurately, the day trader account killer.
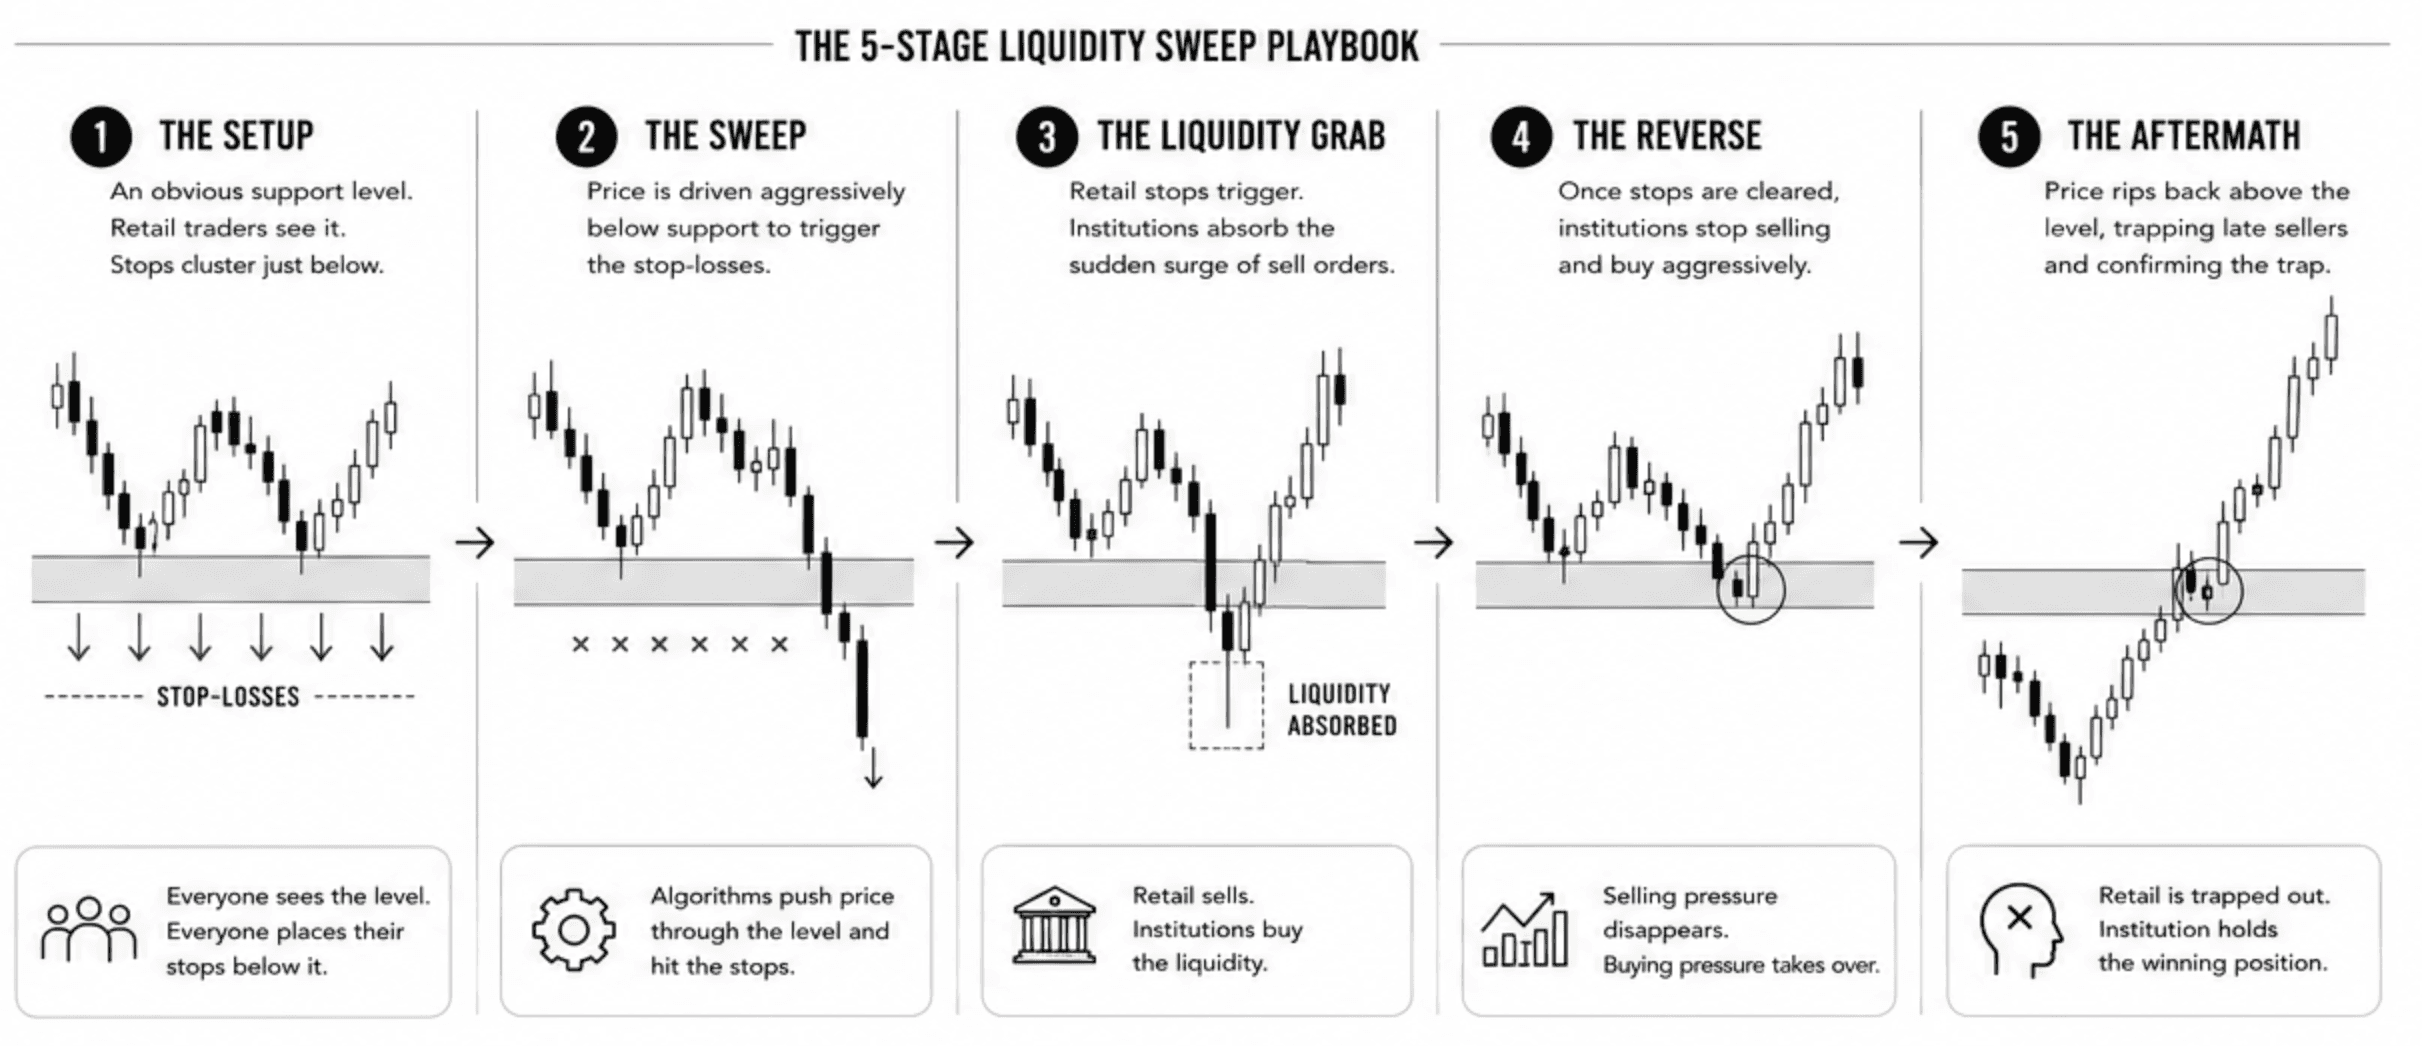
An institution wants to buy a massive clip of volume without driving the market price up against themselves. To find that liquidity, they look for where the crowd has clustered their stops. They will intentionally engineer a brief, aggressive push straight through an obvious support floor.
To the retail trader, it looks like a catastrophic breakout. They panic and their protective sell-stops trigger. But that sudden surge of retail sell orders is exactly what the institution needed to seamlessly fill their massive buy orders. Once the retail stops are entirely cleaned out, the institution stops selling, and price aggressively rips right back above the floor.
You have likely lived through this software defect in your own trading: you get stopped out at a loss, only to watch price instantly reverse and soar directly toward your original profit target. You were 100% right about the structural level, but you were 100% wrong about your stop placement. You got used for your liquidity, and they didn't even say thank you.
How to Fix Your Stop Architecture
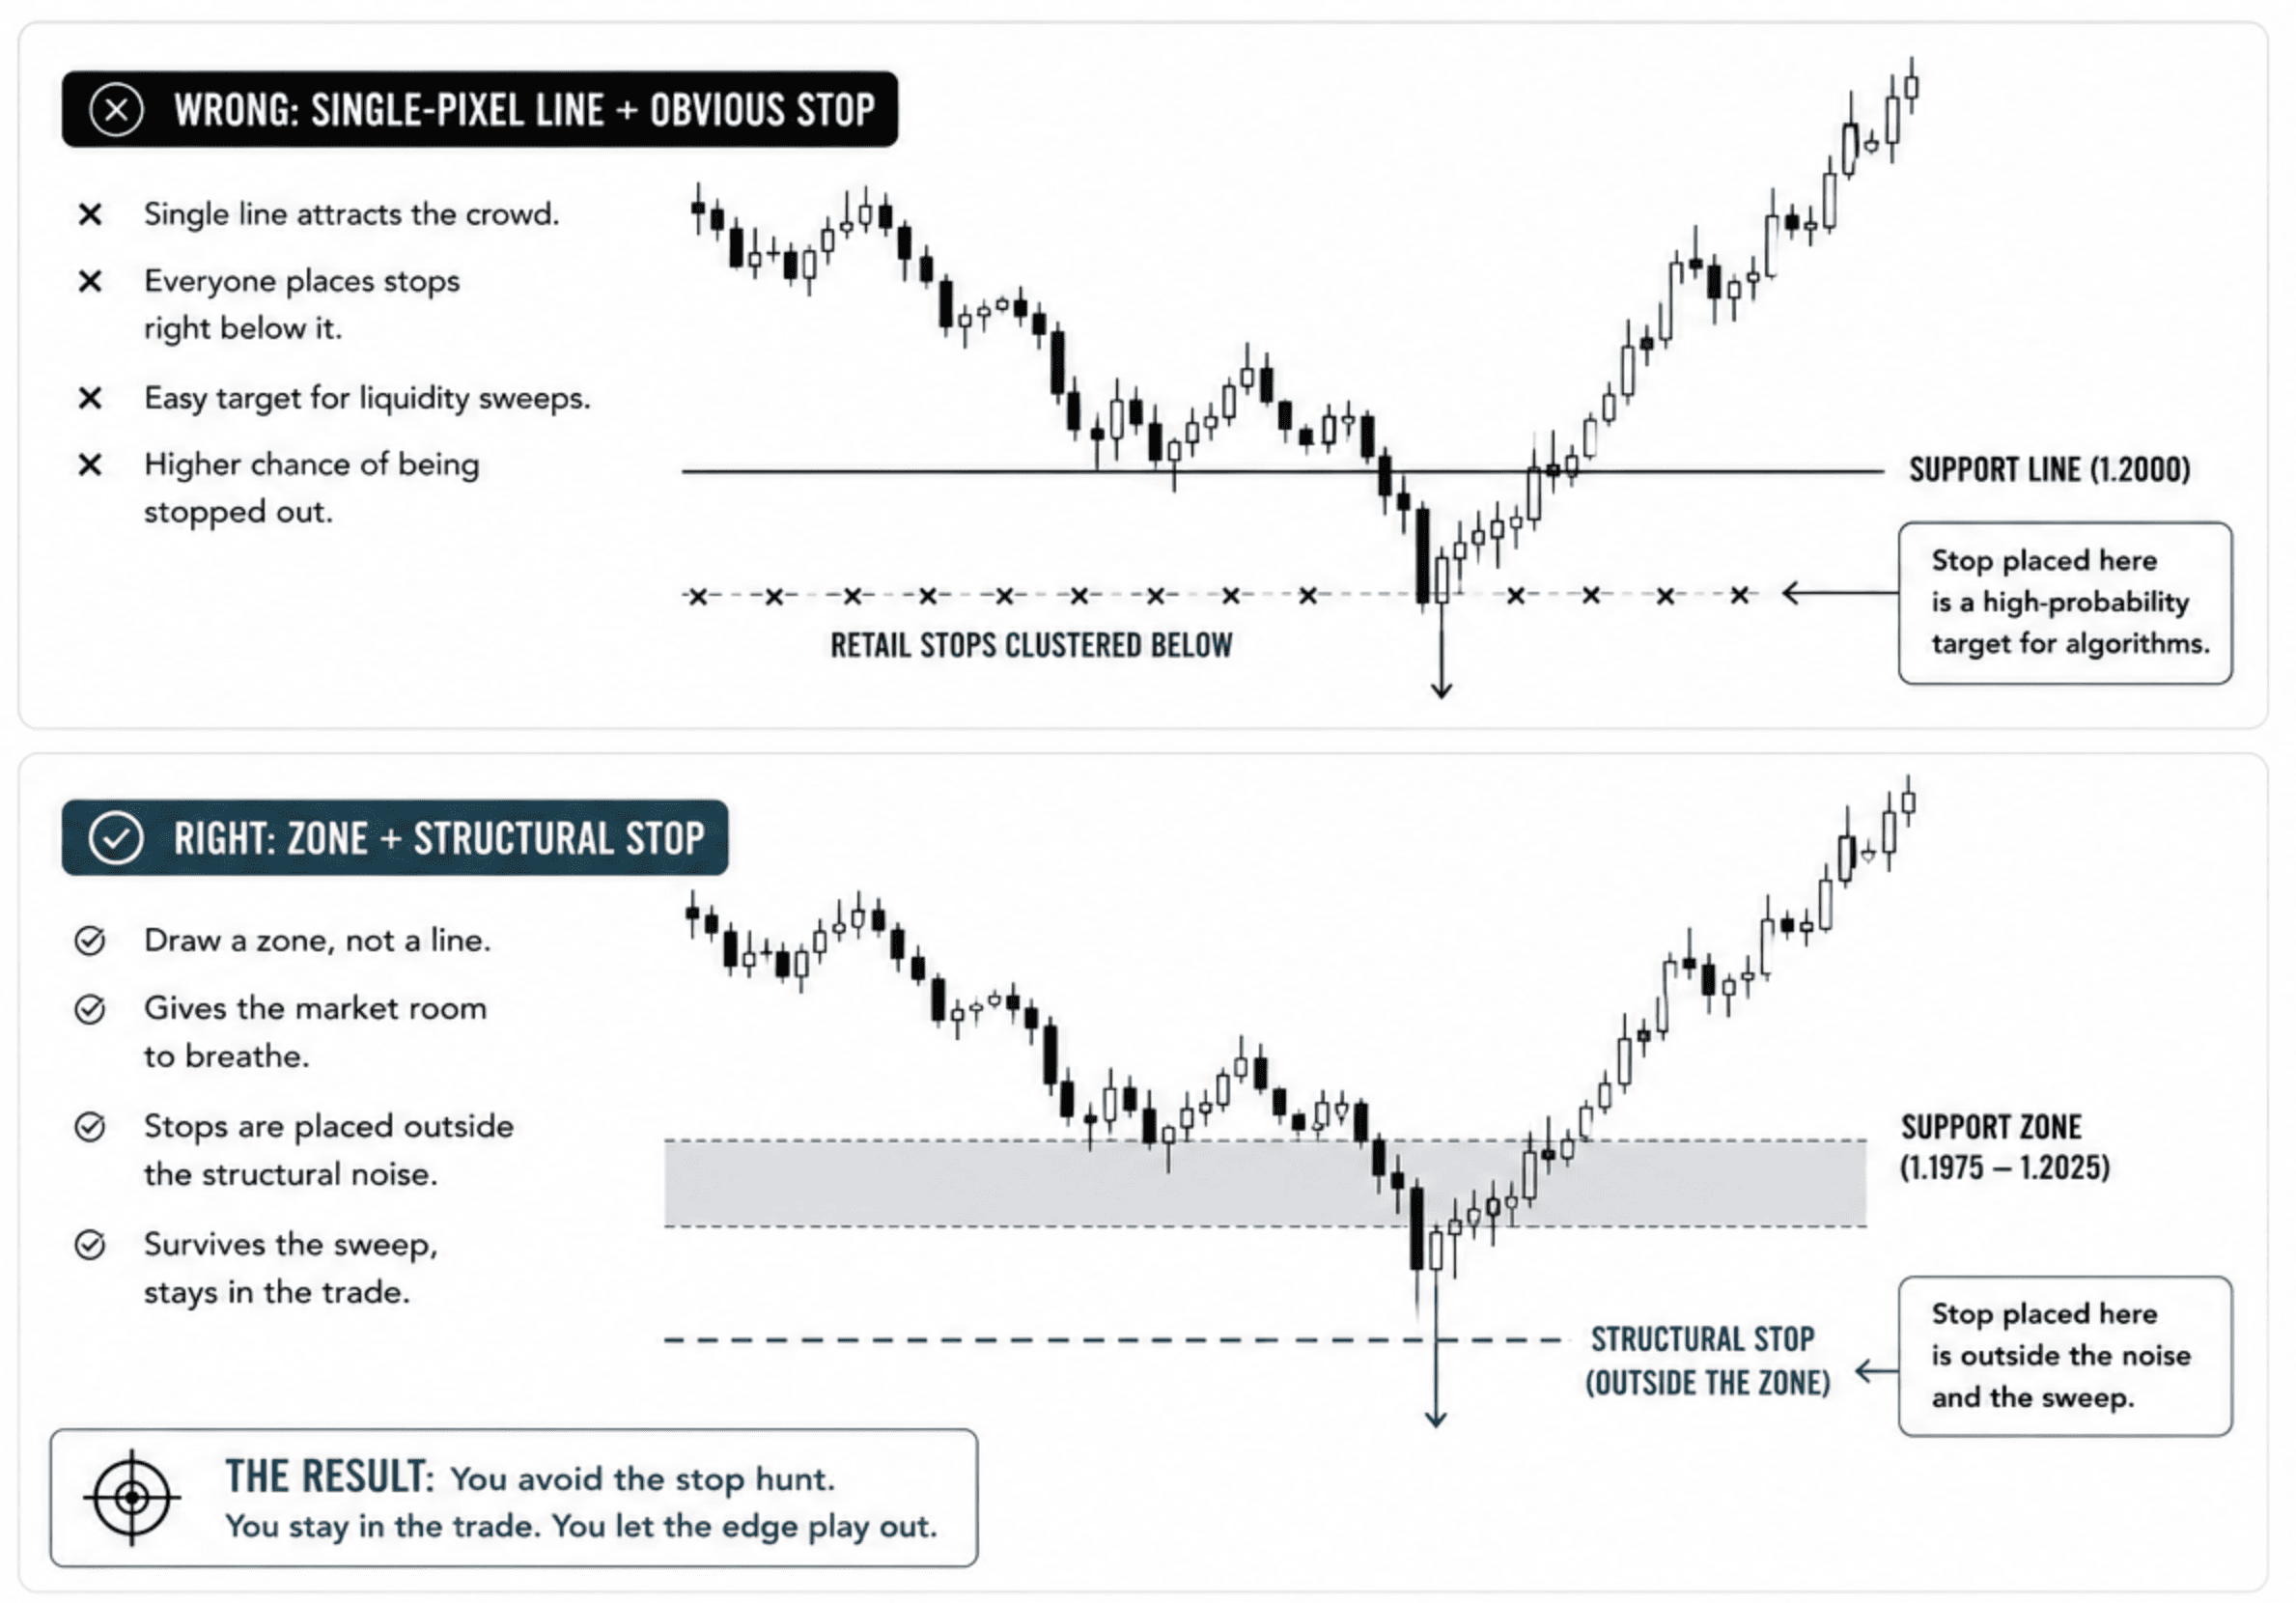
Understanding liquidity sweeps doesn’t mean you abandon support and resistance. It means you stop drawing single-pixel lines and start drawing zones. You must give the market room to breathe. Instead of placing your stop-loss right at the obvious edge where the entire retail world is hiding, place it completely outside the structural noise of the zone.
The Final Blueprint
Support and resistance isn't a rigid, automated trading strategy; it is a clinical description of auction market behavior that every strategy must account for.
Regardless of whether your personal framework relies on complex moving average crossovers, macroeconomic interest rate differentials, or raw price action candles, if you are executing trades without looking at where price sits relative to the higher-timeframe S&R grid, you are going to learn an expensive lesson.
Every single profitable framework eventually bows to these boundaries. The question isn't whether you will use support and resistance in your career. The question is whether you will start using it on purpose.
All Support and Resistance Articles in this Strategy Series
Part 2: The Mechanics – How support and resistance actually work under the hood and the exact mechanics of why they eventually break.
Part 3: The Cultural Consensus – Why this is the rare, mythical concept that fundamental analysts, technical chartists, and high-frequency algorithms all agree on.
Part 4: The Resource Filter – A curated, zero-fluff list of books, tools, and learning materials actually worth your finite cognitive energy.
Part 5: The Hard Data – How to backtest a support and resistance strategy without lying to yourself or optimizing your data into an illusion.
Success Criteria
After completing this lesson, you should be able to describe the factors that contribute to S&R's popularity (simplicity, intuitive logic, partial self-fulfilling nature) and identify the ways that popularity leads to overstatement of its reliability.
Common Misconception
The self-fulfilling nature of widely-watched levels makes them automatically reliable.
The Truth: Widespread attention to a level increases the likelihood of a reaction but also increases the likelihood of a stop hunt through the level, and these effects partially cancel each other out.
FAQ's
Q: Is S&R too basic to use as a primary strategy?
Q: If everyone can see the same S&R levels, doesn't that make them less reliable?
Q: Do professional traders actually use support and resistance?
Table of Contents
About Me

Krista Weber
After a career as a VP of UX and EdTech executive, I retired early—and quickly realized the traditional world of trading education is fundamentally broken.
As someone with a Master’s in HCI who specialized in the design of e-learning systems, I saw a massive gap: beginners aren't failing because trading is impossible; they’re failing due to massive cognitive overload and terrible instructional design.
This site bridges that gap. I’m applying the principles of learning science, systems thinking, and minimalist UX to strip away the market noise and teach trading the way it actually should be taught.
Stay in Touch
Some of the pages on my travel blog contain affiliate links. Whenever you buy something through one of these links, I get a small commission at no extra cost to you. As an affiliate, I only recommend products and services that I feel are high quality and helpful to my readers. Thanks for your support.
Read More

Open almost any trading platform and you'll see EUR/USD sitting next to XAU/USD, NQ, ES, and a dozen CFDs on stocks you've heard of. They all show up as candlesticks moving left to right, which quietly implies they're all the same kind of thing. They aren't. Before going deeper into any one of them, it's worth drawing the map.
Updated on Sep 6, 2026

Futures are standardized contracts tied to defined specifications and a future settlement date. They can look complex at first, but the mechanics become much clearer once you know what the contract specification controls. Here's what you actually need to know.
Updated on Sep 6, 2026

CFDs appear everywhere in retail trading – but most new traders couldn't explain exactly what they are or why that matters. Here's a plain-language breakdown, including the parts that most introductions skip.
Updated on Sep 6, 2026