Support & Resistance Part 2: How Support and Resistance Actually Works (And Why It Breaks)
A support level isn't magic — it's the sum of decisions made by real traders at a specific price. Understanding the mechanics makes the levels much easier to trust.

Learning Path Stage 6: Find Your Strategy
Learning Level 2: Understanding
Primary Learning Objective
By the end of this lesson, you will be able to identify, draw, and apply support and resistance levels using consistent, objective criteria.
The Memory Problem at the Core of Every Level
Support and resistance levels don't exist because charts are magical. They exist because traders remember price. Every level on your chart represents a moment where enough buyers or sellers made a decision that changed the direction of price — and the market collectively filed that memory away.
Think of it like the comments section of a product launch. The first big reaction — whether overwhelmingly positive or catastrophically negative — anchors the conversation. Every subsequent interaction happens in reference to that first inflection point. Markets work the same way. The more decisive the original reaction at a price level, the stronger the memory, and the more likely that level is to produce a reaction again.
This article covers the mechanics of how levels form, what distinguishes a strong level from a weak one, why levels switch roles when they break, and the common errors traders make when applying them.
How a Level Forms: The Order Flow Mechanics
Every support and resistance level is, mechanically, an accumulation of unfilled or remembered orders at a specific price. Three things create significant levels:
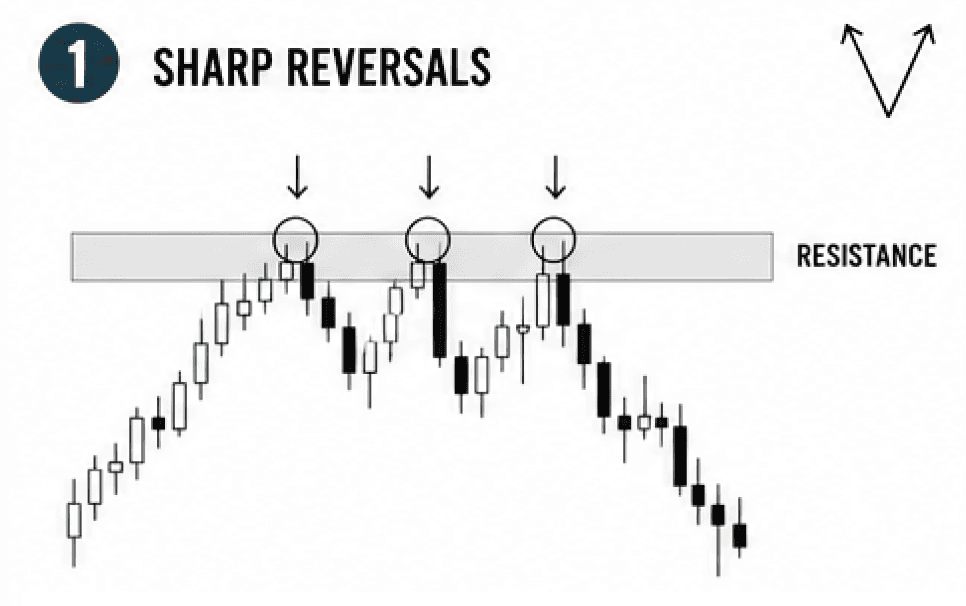
1. Sharp Reversals
When price reaches a level and aggressively reverses — a large candle body rejecting decisively from that price — it signals that a significant volume of orders was waiting there. Institutions don't broadcast their orders in advance; you read their presence from the speed and force of the reversal. A sharp V-shaped rejection at a level is the market's fingerprint for institutional participation.
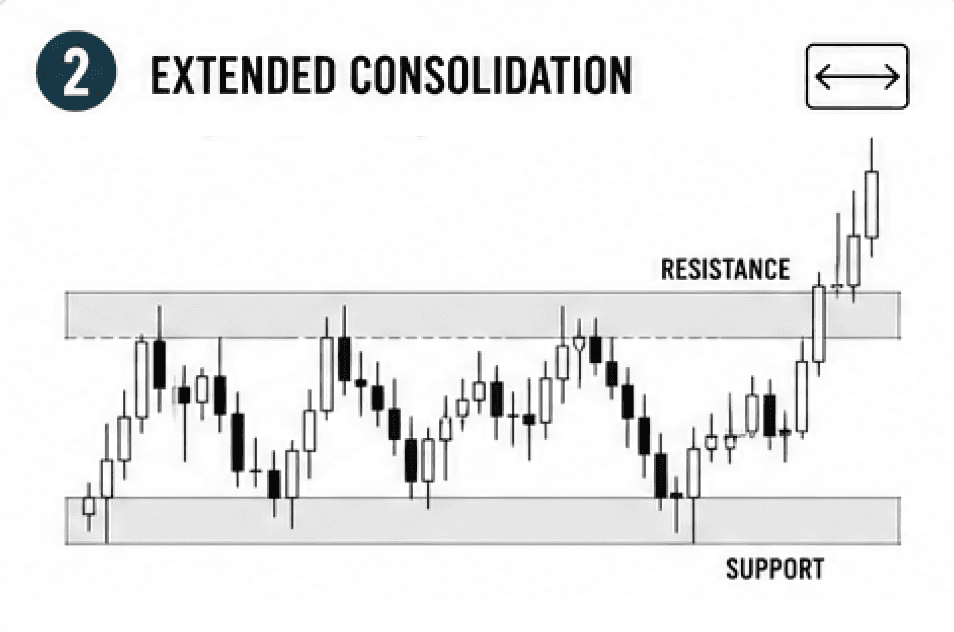
2. Extended Consolidation
When price oscillates sideways for multiple candles before moving, it signals that supply and demand were roughly equal at that level for a period of time. When price eventually breaks out of that consolidation, the boundaries of the range become significant — the top becomes resistance, the bottom becomes support (or vice versa if the breakout goes the other direction).
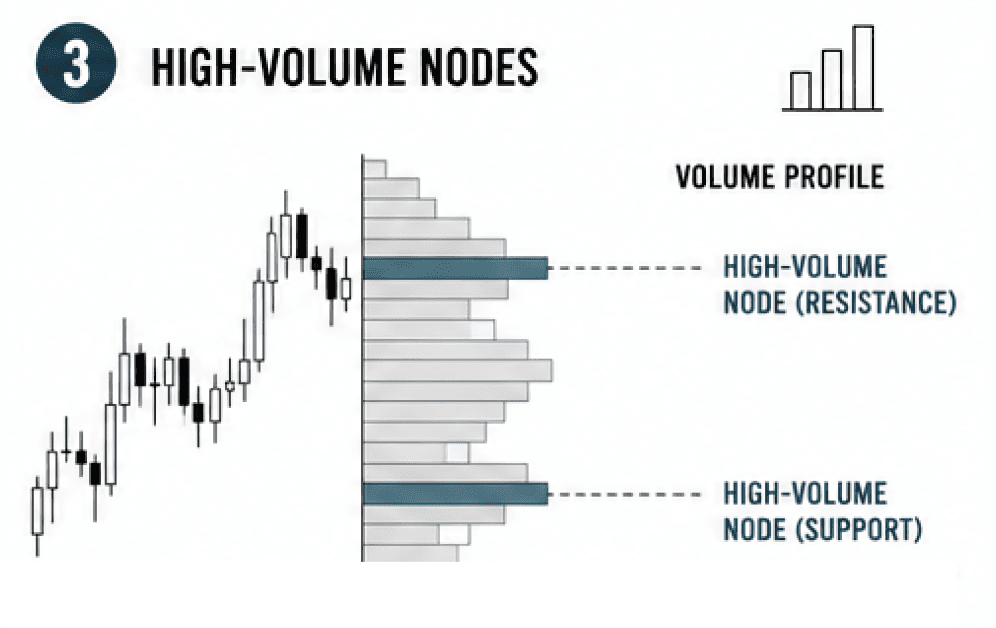
3. High-Volume Nodes
If you have access to volume profile data, you'll notice that certain price levels have dramatically higher volume than adjacent levels. These high-volume nodes act as support and resistance because participants who transacted there have a vested interest in price returning to that level.
What Makes a Level Strong vs. Weak
Not all levels are equal. The factors that determine level strength:
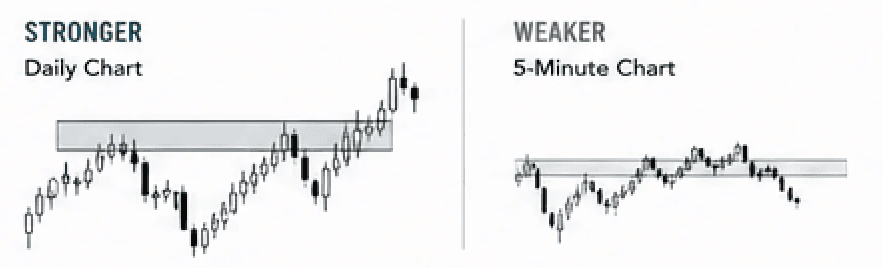
Timeframe. A level visible on the Daily chart carries more weight than one only visible on the 5-minute chart. Higher timeframe levels have been observed by more participants and have more capital defending them.
Number of touches. A level that has produced three clean reactions carries more conviction than one that has only been touched once. Each additional reaction validates the level. But also, each touch also depletes the orders resting there, which leads to the next point.
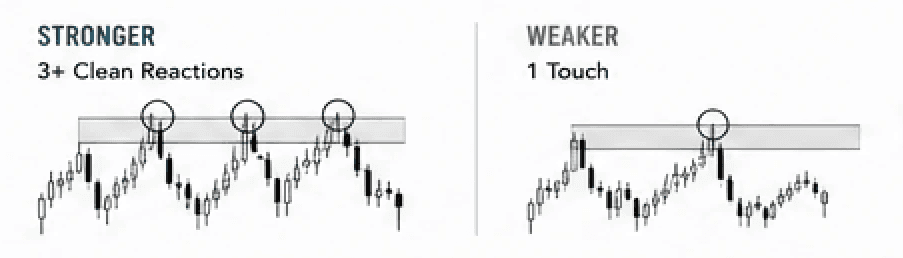
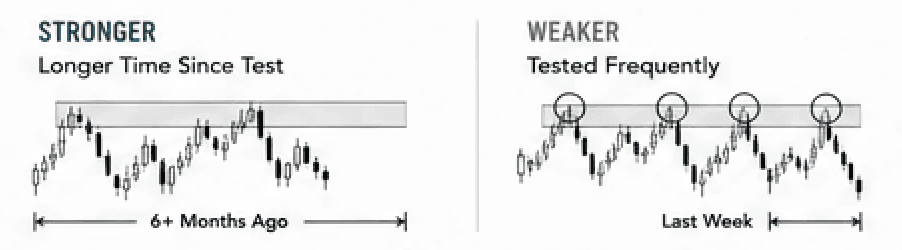
Time since last test. A level tested six months ago may have fresher orders waiting than one touched four times last week. Frequent testing exhausts the supply of orders at that price, eventually causing the level to fail.
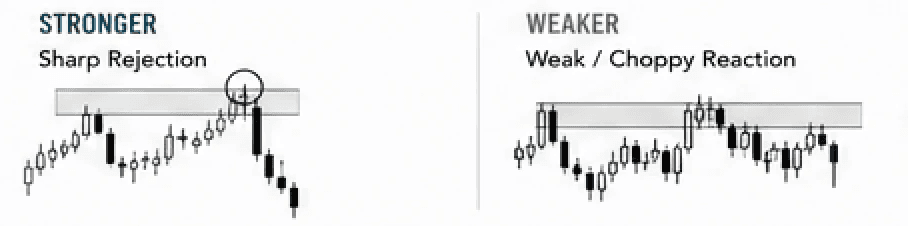
Clarity of reaction. A level where price reversed sharply with a single large candle is more significant than one where price drifted sideways and gradually turned. Conviction in the reaction suggests institutional order flow.
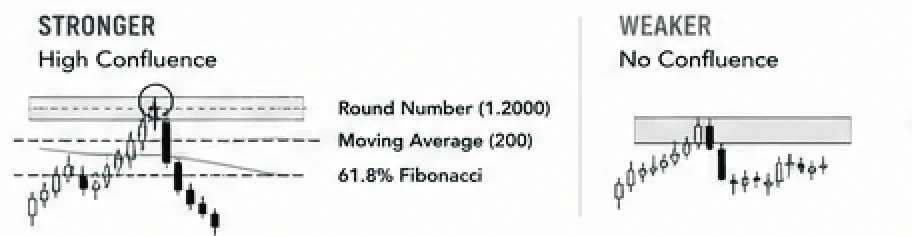
Confluence. A level where a horizontal S&R zone coincides with a round number (1.2000, 50.00), a moving average, or a Fibonacci retracement is exponentially stronger because multiple participants are watching the same price for different reasons.
The Role Reversal Mechanism
One of the most counterintuitive and reliable phenomena in markets: when a support level breaks, it becomes resistance. When a resistance level breaks, it becomes support.
This happens because the psychology of everyone who traded at that level completely inverts when the level fails. Imagine a support level at 1.2000 on EUR/USD. Three groups of traders are trapped when it breaks down:
The buyers who bought the support are now underwater. They're holding a losing long position and praying for price to return to 1.2000 so they can exit at break-even.
The sellers who shorted thinking it would break are now profitable and looking to add, but only if price gives them a better entry. That better entry is a pullback to the broken level.
New sellers who missed the breakdown are watching for a retest of the broken support to enter short with a tight stop above the level.
All three groups converge at the broken level — but now all three are selling, not buying. The old floor has become a new ceiling. This is why broken-support-turned-resistance reactions are among the most reliable setups in technical trading: the order flow logic is clear and verifiable.
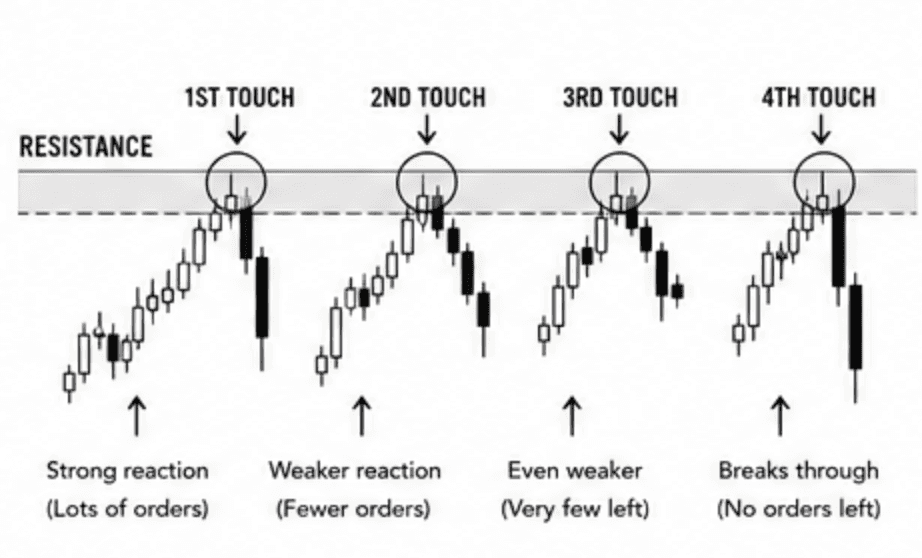
Why Levels Break: The Depletion Model
Every support level contains a finite amount of buying interest. Think of it as a tank of orders: each time price tests the level, some orders get filled and removed. The first test hits the tank when it's full — strong reaction. The second test finds fewer orders — moderate reaction. The third or fourth test may find the tank nearly empty — weak or no reaction, and the level breaks.
This is why you should be increasingly cautious about a level the more times it's been tested without breaking. In UX terms: the more users report a broken feature, the faster engineering patches it. Markets resolve their own inefficiencies through repeated testing.
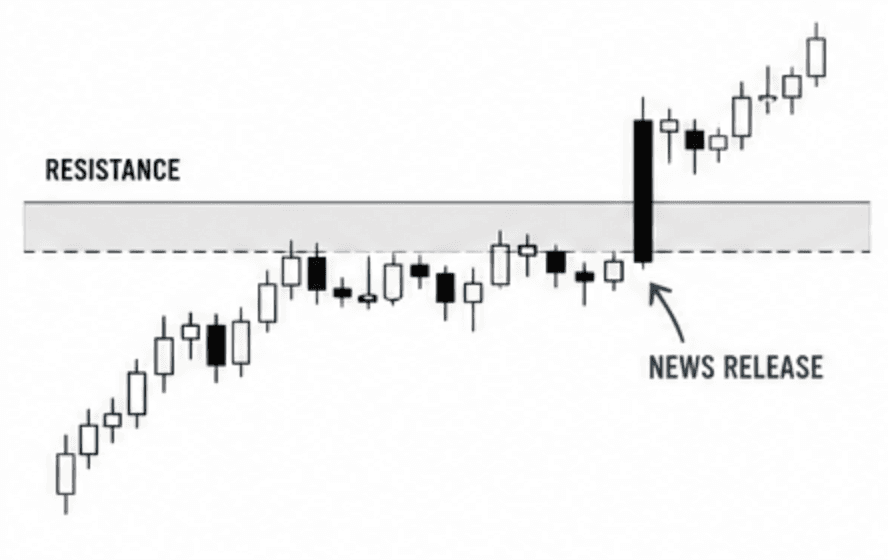
Three specific catalysts force levels to break when they otherwise might hold:
High-impact news events that fundamentally shift the supply/demand balance (central bank decisions, major economic data releases)
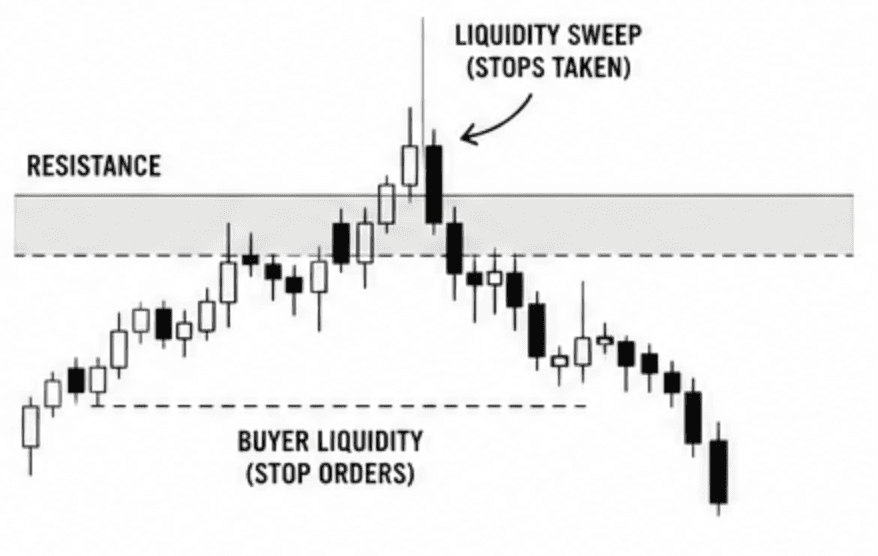
Liquidity sweeps where institutional players deliberately push price slightly beyond a level to harvest the stop orders clustered there, then reverse. What looks like a break is actually a fill at the best possible price
Order depletion - the level simply runs out of defending orders over repeated tests
The Three Most Common Mechanics Mistakes
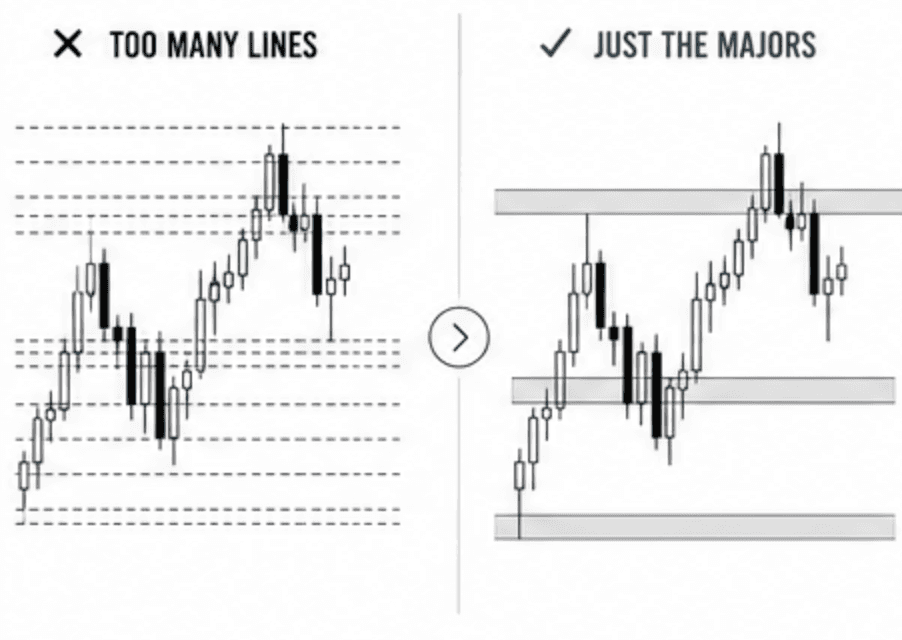
Drawing Too Many Lines
Analysis paralysis is a direct product of over-drawing. If your chart looks like a prison cell, you haven't identified significant levels. You've simply catalogued every price that ever existed. Stick to three to five major levels on any given chart. If you can't decide which five matter most, that's your signal to spend more time with the chart before trading it.
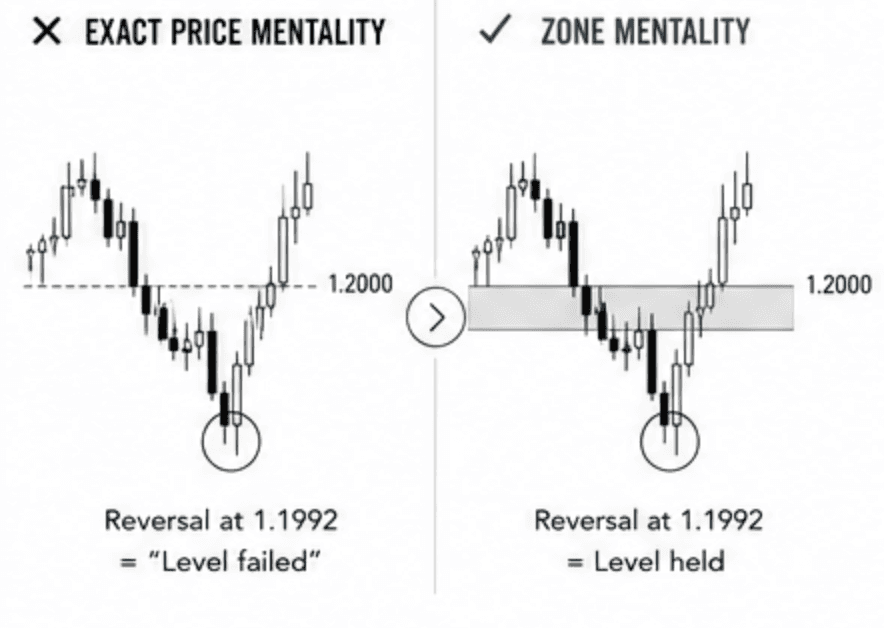
Treating Levels as Exact Prices Instead of Zones
Markets are not precise. A support level at 1.2000 will rarely produce a reversal exactly at 1.2000. Use horizontal rectangles spanning the wicks and bodies of the candles that formed the level. Give the market a few pips of breathing room. If price taps 1.1992 and reverses hard, your level held — don't declare failure because price didn't stop at the exact number.
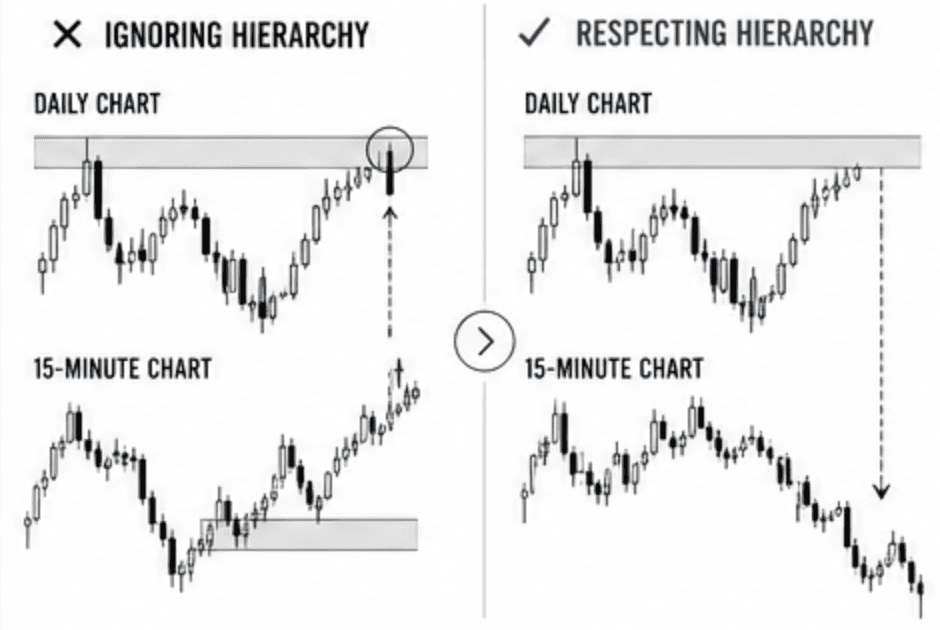
Ignoring the Timeframe Hierarchy
A strong resistance level on the Daily chart overrides a weak support level on the 15-minute chart. Always establish your higher timeframe context before drawing lower timeframe levels. Trading a 5-minute support that sits directly inside a Daily resistance zone is like approving a product feature that conflicts with the core architecture. It will fail for structural reasons, regardless of how good the local decision looked.
Additional Articles in This Series:
Part 1: The Foundation Every Trader Builds On (You are here)
Part 2: The Mechanics – How support and resistance actually work under the hood and the exact mechanics of why they eventually break.
Part 3: The Cultural Consensus – Why this is the rare, mythical concept that fundamental analysts, technical chartists, and high-frequency algorithms all agree on.
Part 4: The Resource Filter – A curated, zero-fluff list of books, tools, and learning materials actually worth your finite cognitive energy.
Part 5: The Hard Data – How to backtest a support and resistance strategy without lying to yourself or optimizing your data into an illusion.
Success Criteria
After completing this lesson, you should be able to mark significant levels on any chart, explain your rationale for each, and describe how you determine whether a level is meaningful or arbitrary.
Common Misconception
Every price level that's been touched multiple times is a valid support or resistance level.
The Truth: Significance is determined by the quality of the reactions (sharp moves away, clear rejections) rather than the number of touches alone.
FAQ's
Q: How many touches does a level need to be valid?
Q: Can a support level on one timeframe conflict with resistance on another?
Q: Why does support become resistance after it breaks?
Table of Contents
About Me

Krista Weber
After a career as a VP of UX and EdTech executive, I retired early—and quickly realized the traditional world of trading education is fundamentally broken.
As someone with a Master’s in HCI who specialized in the design of e-learning systems, I saw a massive gap: beginners aren't failing because trading is impossible; they’re failing due to massive cognitive overload and terrible instructional design.
This site bridges that gap. I’m applying the principles of learning science, systems thinking, and minimalist UX to strip away the market noise and teach trading the way it actually should be taught.
Stay in Touch
Some of the pages on my travel blog contain affiliate links. Whenever you buy something through one of these links, I get a small commission at no extra cost to you. As an affiliate, I only recommend products and services that I feel are high quality and helpful to my readers. Thanks for your support.
Read More

Breakout trading is the practice of entering a position the moment price moves beyond a defined level of support or resistance. It sounds simple, and it is, in structure. The challenge is that most breakouts are false.
Updated on Jun 12, 2026

Why matching a strategy to your cognitive style matters more than finding the 'best' one.
Updated on Apr 27, 2026

Before exploring individual strategies, it's worth asking a more fundamental question: what actually counts as a trading strategy? The answer shapes everything.
Updated on Apr 27, 2026