
Reading Price Action at Key Levels
Drawing significant levels on your chart is a task most traders can do reasonably well. Reading price action when price arrives at those levels and distinguishing a high-quality signal from noise, or a genuine reaction from a momentary hesitation is the skill that takes longer to develop.

Learning Path Stage 2: Reading Charts
Learning Level 3: Application
Primary Learning Objective
By the end of this article, readers will be able to evaluate structural candlestick formations and multi-candle sequences at established market boundaries to accurately determine whether a key price level is holding (rejection) or breaking (acceptance), reducing premature and ambiguous trade entries.
How to Stop Second-Guessing Every Single Entry
Drawing support and resistance levels on a chart is easy. Most traders can do it reasonably well after a few hours of watching YouTube tutorials.
The actual hard part? Reading what price does when it arrives at those lines. Distinguishing a high-quality trade signal from pure market noise, or a genuine trend reversal from a momentary hesitation, is the skill that separates funded traders from people who bleed account balances.
I'm going to assume you already know why buyers and sellers congregate at these areas. If you don’t, go back and read "What Buyers and Sellers Are Actually Doing at Support" and its resistance companion piece. What follows isn't a lecture on why the fight happens; it's about figuring out who is winning the fistfight.
Here is exactly what to look for when price meets a key level.
What You're Actually Trying to Figure Out
When price slams into a key level, you aren't trying to predict the future. You are asking one binary question: Is this level holding, or is it breaking?
If the level holds: You expect a reversal. The signal should show you that buyers (at support) or sellers (at resistance) just stepped into the arena with enough muscle to turn the market around.
If the level breaks: You expect price to blast right through it. The signal tells you that one side completely overwhelmed the other, and momentum is about to carry it down the block.
There is also Option C: The market is giving you absolutely nothing. The candle is still forming, or the reaction looks like a flatline. In this scenario, the only correct move is to sit on your hands and wait.
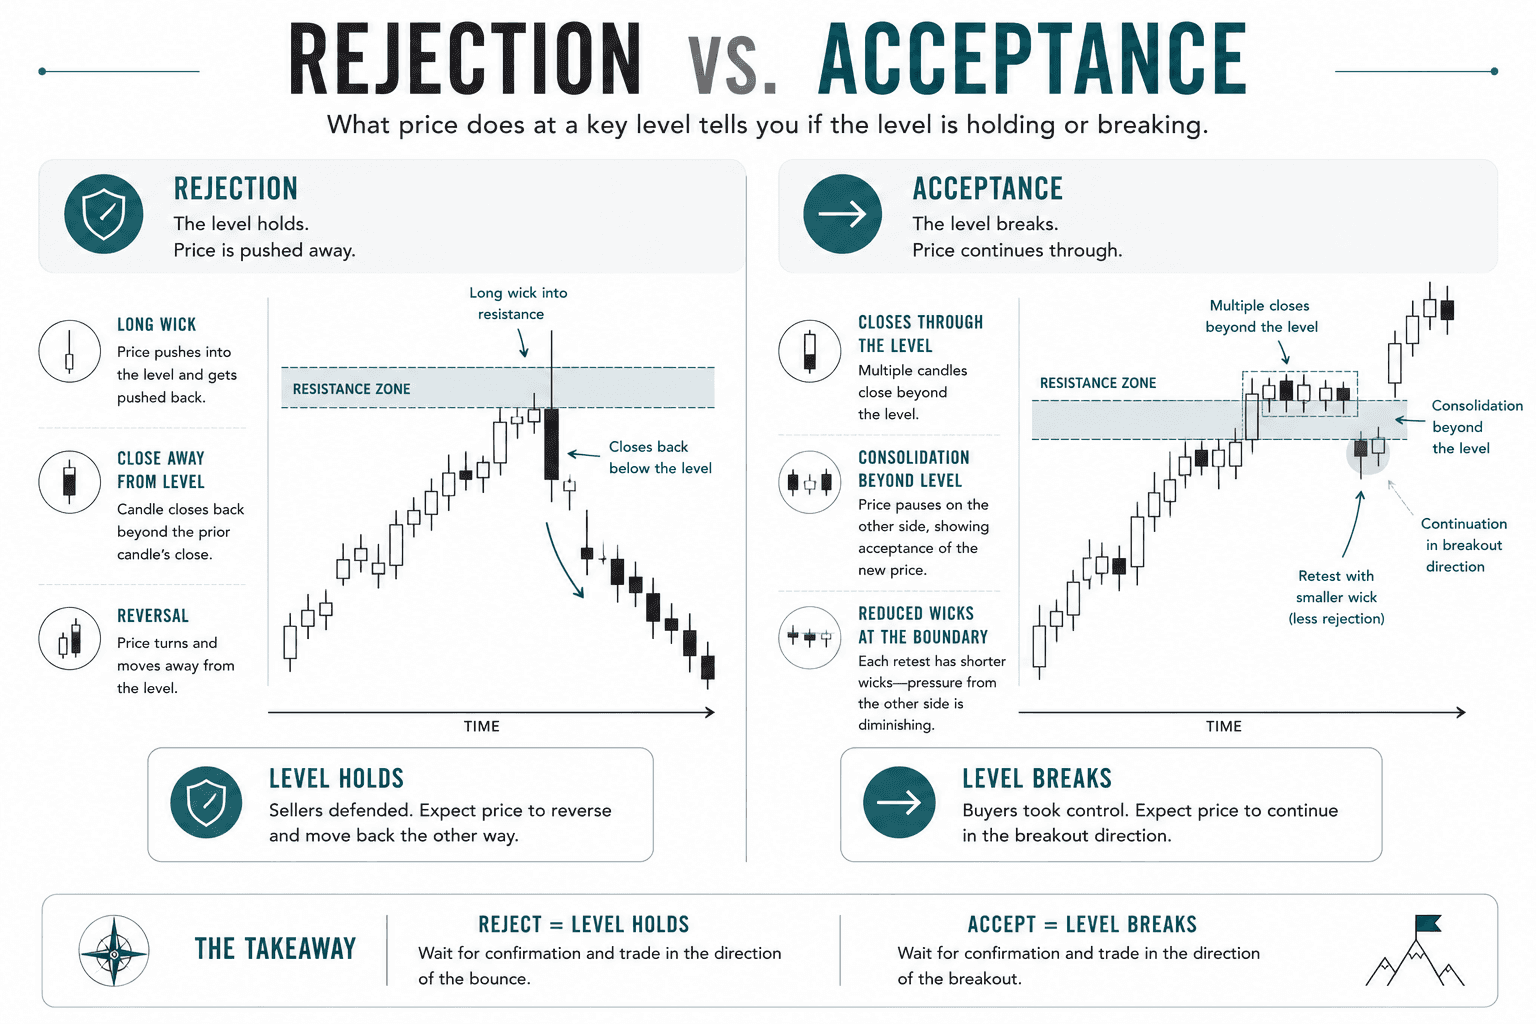
Reading Rejection (The "Not Today" Signal)
Rejection isn't a vibe; it's explicitly printed in the anatomy of a candlestick. Look for:
1. The Wick
A long, dramatic wick piercing into a level, followed by a candle body that closes miles away from it, is the universal sign of rejection. Price went to the level, met a brick wall of counter-pressure, and was violently shoved backward. The bigger the gap between the wick's tip and the candle's close, the harder the rejection.
At Support: A candle wicks deep into the support zone and closes near its highs. This tells you buyers absorbed the selling pressure like a sponge and pushed price back up. The lower wick is the crime scene footprint.
At Resistance: A candle wicks into the resistance ceiling and closes near its lows. Sellers stepped in, smacked the buyers down, and left a long upper wick behind to prove it.
2. The Close Relative to the Prior Candle
A rejection candle matters most when it structurally dominates the candle before it. You want to see a bullish rejection at support close above the previous candle’s close (or a bearish rejection close below it). This proves the rejection actually has enough momentum to bend local market structure, rather than just being a brief pause.
3. Absolute Unit Size
Size matters. A rejection candle that is noticeably larger than the sleepy candles surrounding it indicates high volume and institutional participation. It means traders actually care about this level.
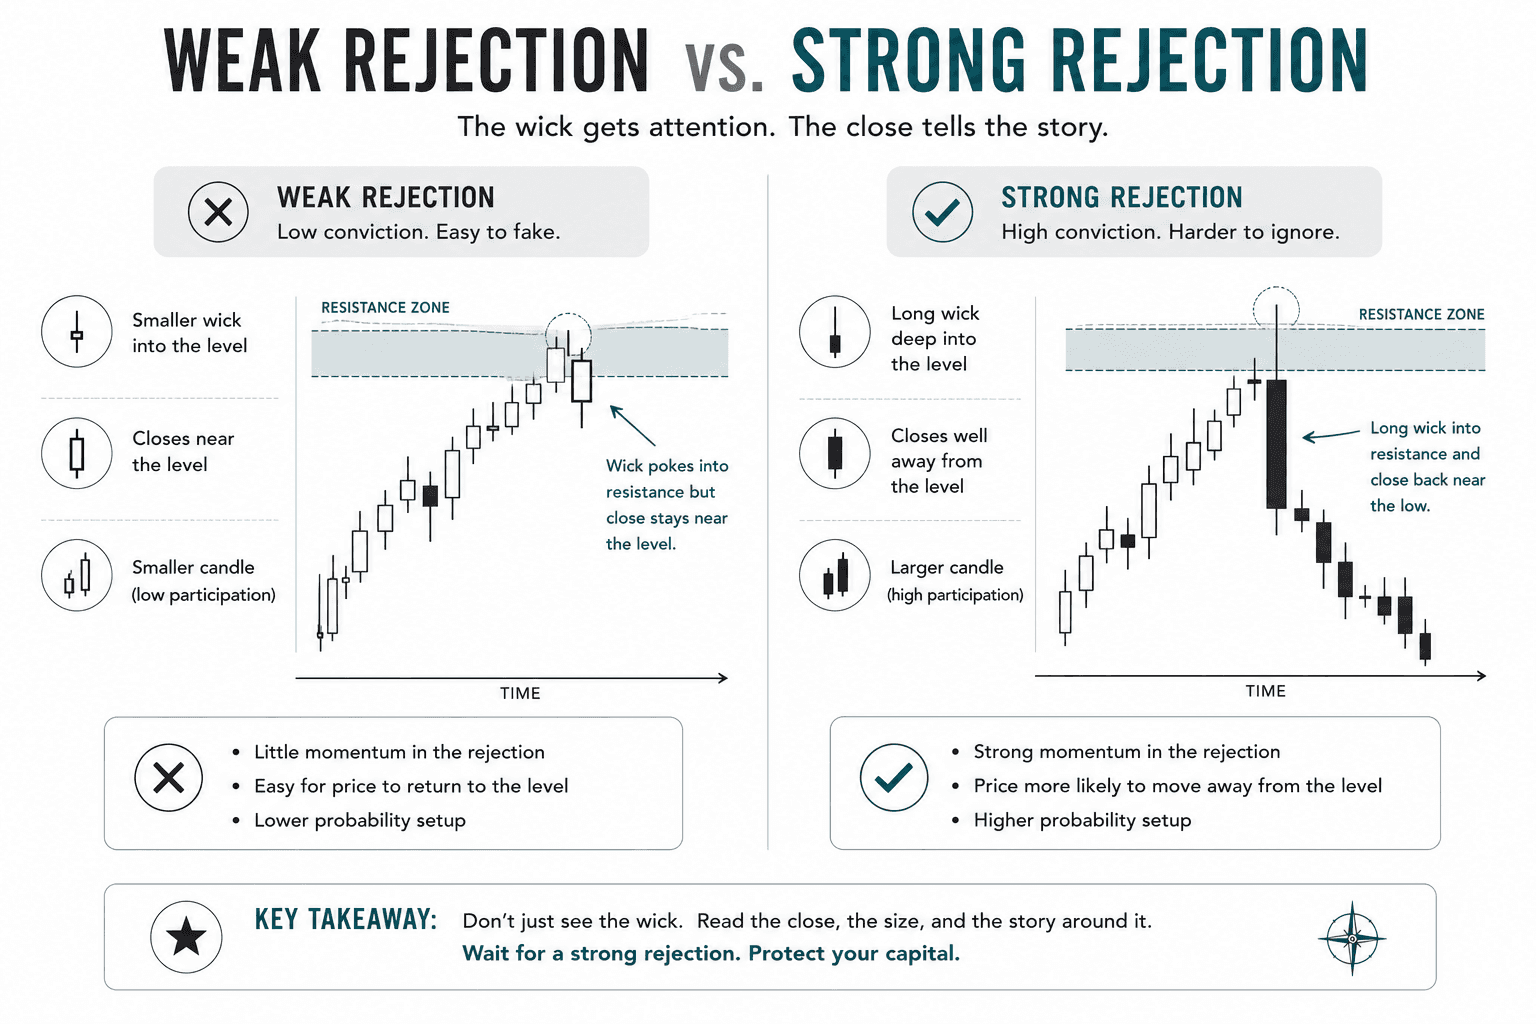
Reading Acceptance (The "Make Yourself at Home" Signal)
When price doesn’t care about your little drawing and decides to "accept" a level, the behavior shifts from a sharp bounce to a comfortable stay:
Closes Through the Level: Instead of wicking out and snapping back, multiple candles completely finish their ranges and close beyond the line. The barrier has officially failed its only job.
Consolidation Beyond the Fence: After crossing the line, price doesn’t panic and rush back. It parks and consolidates on the other side. This tells you buyers or sellers are perfectly comfortable conducting business at this brand-new price.
Shrinking Wicks: If price tests a level three times and the wicks get progressively shorter, the defense is fading. Every bounce is weaker than the last, meaning the defenders of that level are running out of ammo.
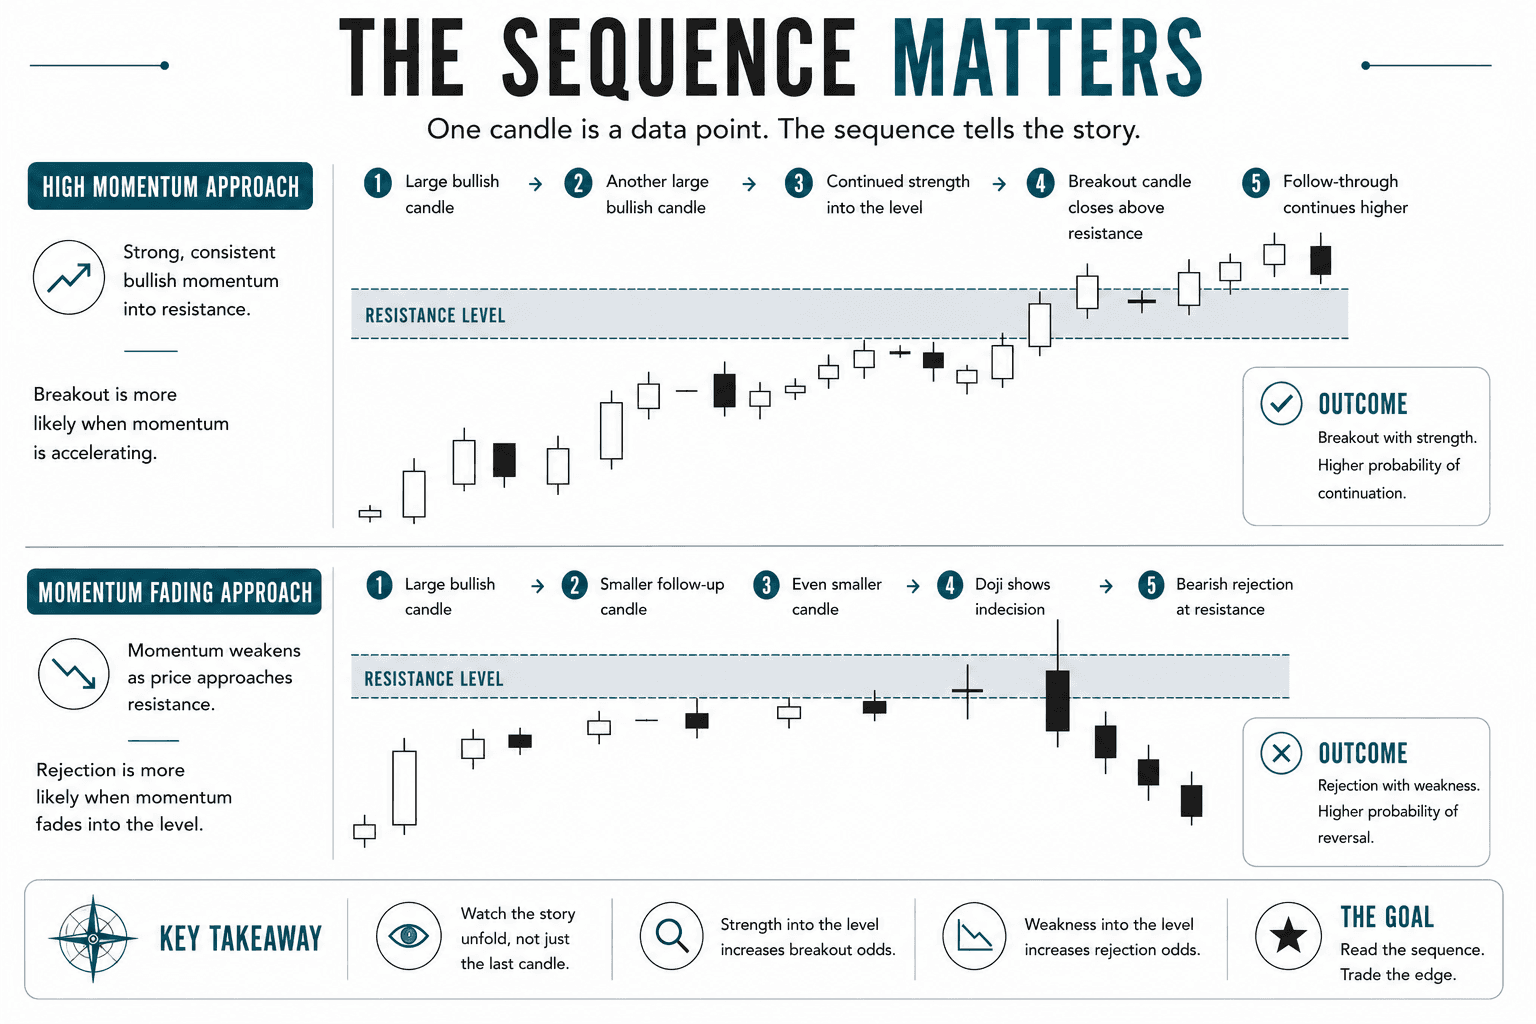
The Sequence Matters (Stop Looking at Single Candles)
A lone candlestick is just a single data point. The sequence of candles leading up to the test is where the actual story lives.
Velocity Going In: Are the candles marching toward your level massive and decisive (high momentum), or are they getting smaller, chopped up, and exhausted (declining momentum)? High momentum going into a wall usually results in a smash-through; low momentum suggests the trend is running out of breath and a reversal is brewing.
The Pre-Signal Context: A massive bullish engulfing candle at support looks great—unless it was preceded by three giant red death candles. Trying to stop a freight train is dangerous. That exact same bullish engulfing candle is 10x safer if the preceding candles were tiny, hesitant dojis, showing the bears completely ran out of steam before the bulls took over.
Repeated Battering: A level hammered four times in rapid succession is a weak level. Think of it like a door: the first kick gets a loud thud (strong rejection), but by the fourth kick, the hinges are coming off. Don't buy a support level that's being tested for the fifth time in an hour.
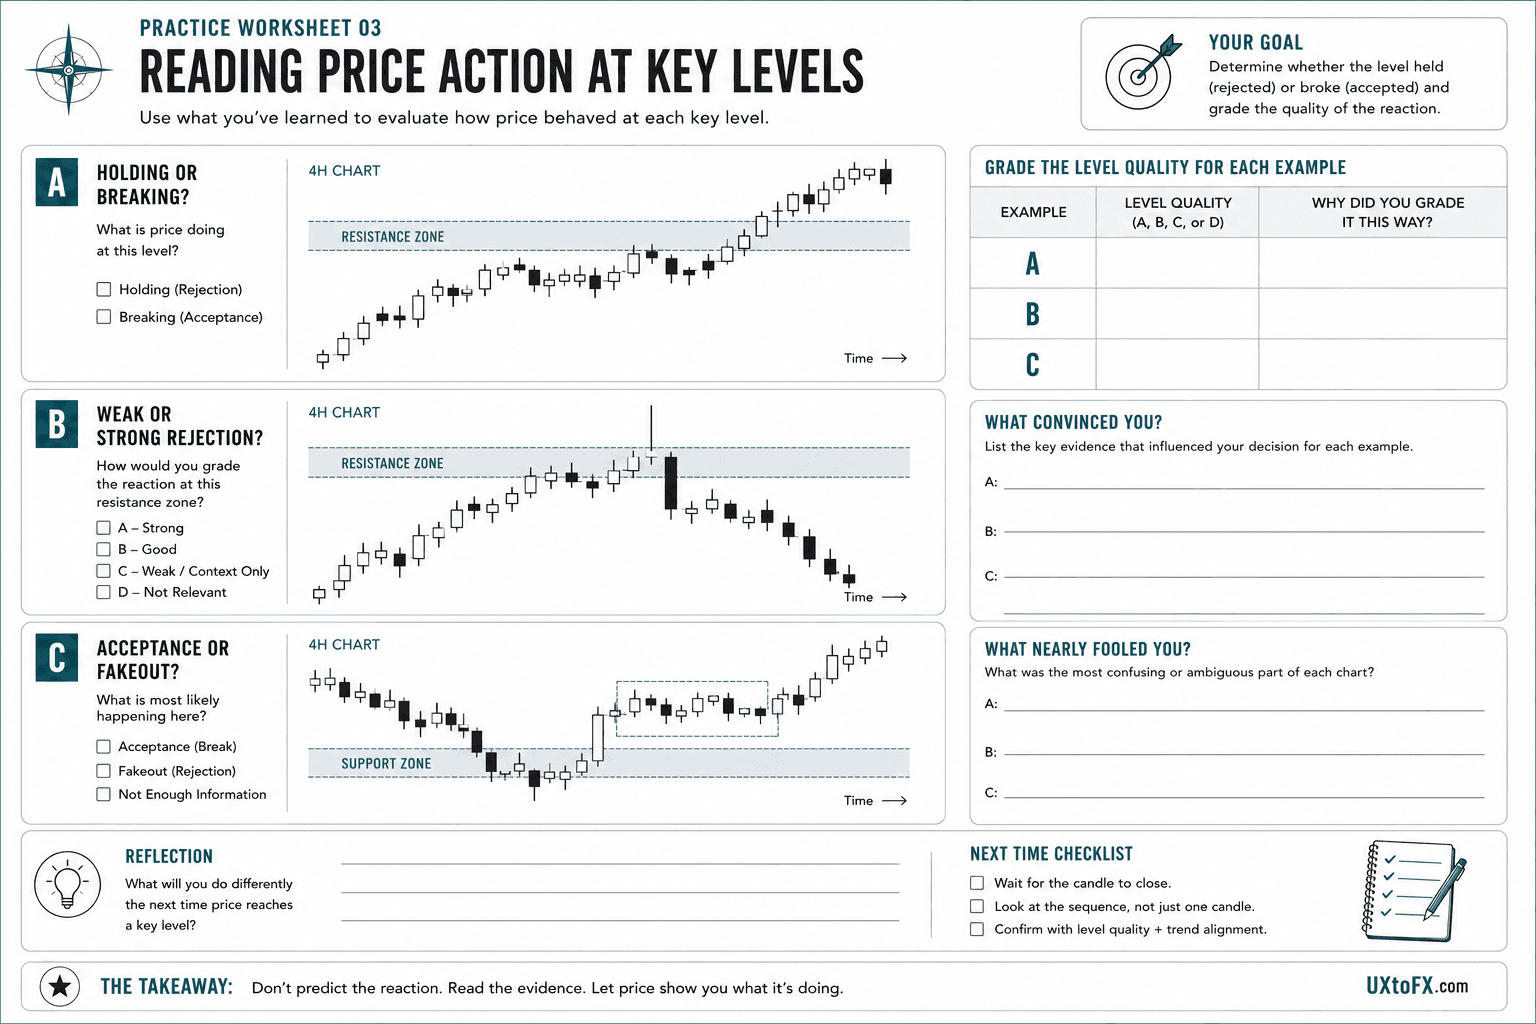
Success Criteria
You will know you have mastered the concepts in this article when you can:
Identify the three primary structural characteristics of a true market rejection: long wick extensions, dominant closing placements relative to prior candles, and above-average absolute unit size.
Differentiate between market rejection and market acceptance by tracking post-level candle closes, local consolidation patterns, and progressive wick decay across repeated tests.
Formulate a strict entry checklist that mandates a three-part confluence: a historically significant structural level, a confirmed rejection signal, and macro trend alignment.
Common Misconception
A long wick extending into a key support or resistance zone is an immediate, standalone green light to enter a reversal trade.
The Truth: A wick is completely ambiguous until the candlestick actually closes. Acting on a live, forming wick often traps traders in fakeouts or premature breakout entries. Furthermore, a single rejection candle isolated from the surrounding context (such as the velocity of the approach, the structural strength of the level, and higher-timeframe trend alignment) is a low-probability signal that frequently leads to stopped-out positions.
FAQ's
Q: Is one good rejection candle enough to enter a trade?
Q: I saw a textbook rejection candle at a key level, but it reversed and stopped me out immediately. What gives?
Q: How do I know if a wick is a real rejection or just a brief pause before it continues crashing through?
Table of Contents
About Me

Krista Weber
After a career as a VP of UX and EdTech executive, I retired early—and quickly realized the traditional world of trading education is fundamentally broken.
As someone with a Master’s in HCI who specialized in the design of e-learning systems, I saw a massive gap: beginners aren't failing because trading is impossible; they’re failing due to massive cognitive overload and terrible instructional design.
This site bridges that gap. I’m applying the principles of learning science, systems thinking, and minimalist UX to strip away the market noise and teach trading the way it actually should be taught.
Stay in Touch
Some of the pages on my travel blog contain affiliate links. Whenever you buy something through one of these links, I get a small commission at no extra cost to you. As an affiliate, I only recommend products and services that I feel are high quality and helpful to my readers. Thanks for your support.
Read More

Open almost any trading platform and you'll see EUR/USD sitting next to XAU/USD, NQ, ES, and a dozen CFDs on stocks you've heard of. They all show up as candlesticks moving left to right, which quietly implies they're all the same kind of thing. They aren't. Before going deeper into any one of them, it's worth drawing the map.
Updated on Sep 6, 2026

Futures are standardized contracts tied to defined specifications and a future settlement date. They can look complex at first, but the mechanics become much clearer once you know what the contract specification controls. Here's what you actually need to know.
Updated on Sep 6, 2026

CFDs appear everywhere in retail trading – but most new traders couldn't explain exactly what they are or why that matters. Here's a plain-language breakdown, including the parts that most introductions skip.
Updated on Sep 6, 2026