
Replay Lab: Finding Support in a Past Session
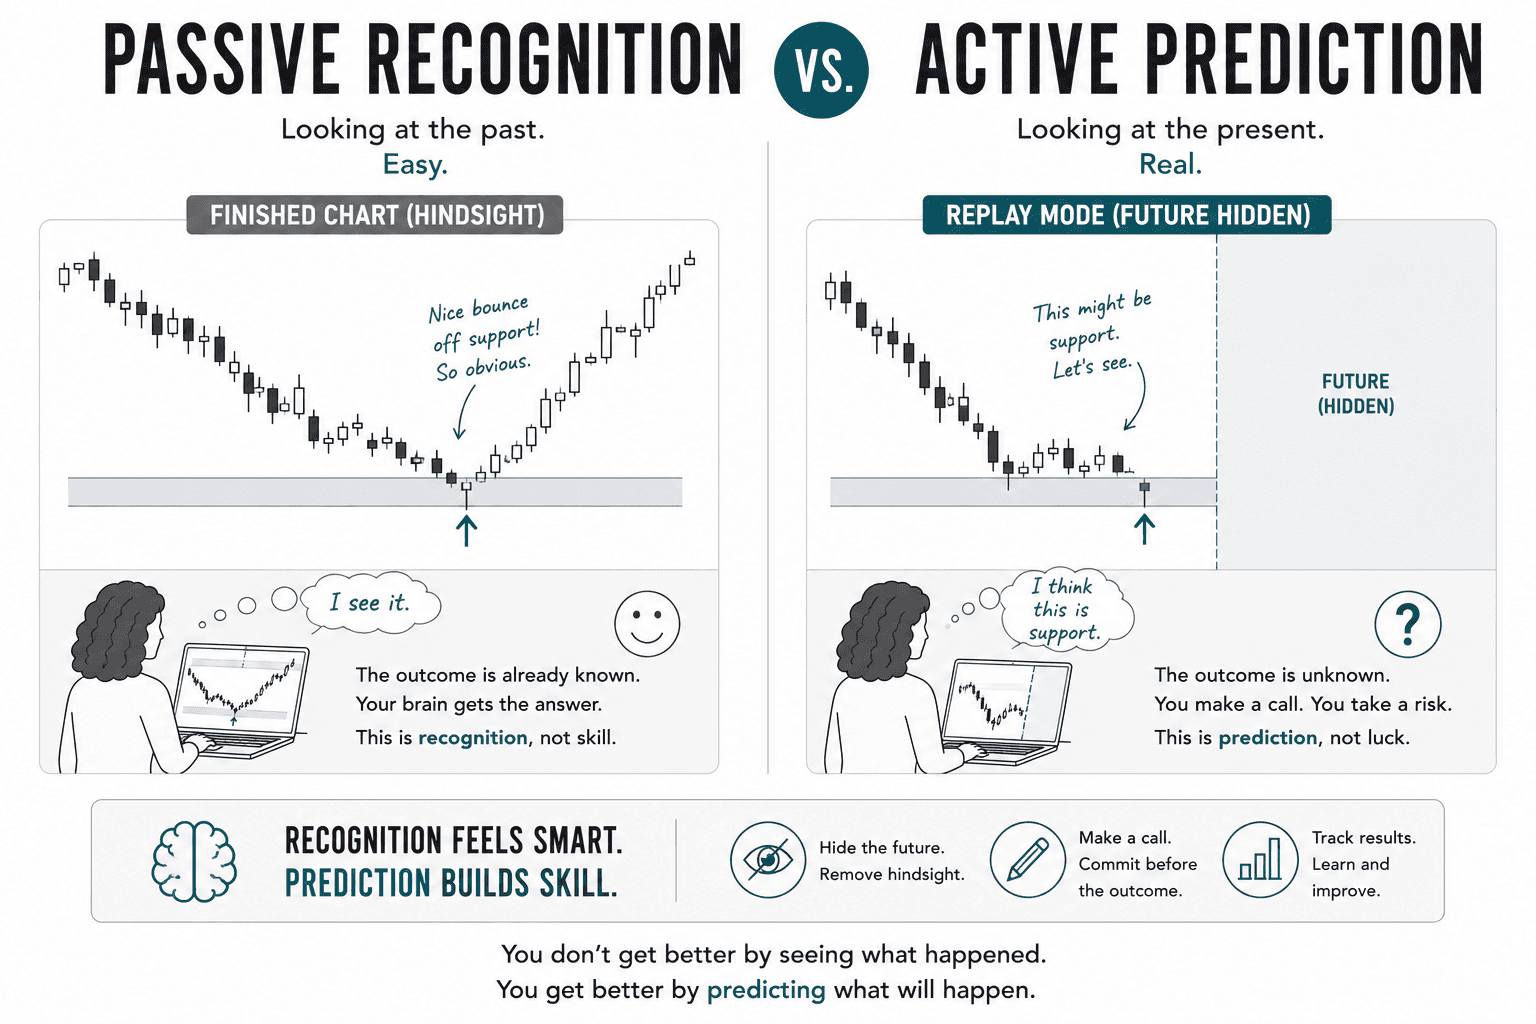
Most traders learn support by studying finished charts, where a video presenter or article author drew the level after seeing the reaction. That's passive recognition. You can spot support once someone shows it to you. You haven't trained the active skill of finding it yourself, in real time, before the outcome is known. Replay mode fixes this... You can't read a level into existence by staring at a finished chart. Find it before the reaction, and your brain learns something real.

Learning Path Stage 5: Sim Trading & Journaling
Learning Level 3: Application
Primary Learning Objective
The main goal of this lesson is to train your eye to actively identify valid, historical horizontal support levels and accurately anticipate market reactions in real-time without the psychological crutch of hindsight bias.
Why Are We Doing This? (The Anti-Hindsight Manifesto)
Train your eyes to spot where buyers might step in before they actually do, and every single setup you trade instantly gets sharper. Support is the bedrock of almost everything: bounces, pullbacks, and old resistance turning into new support. If your foundation is shaky, everything you build on top of it will collapse.
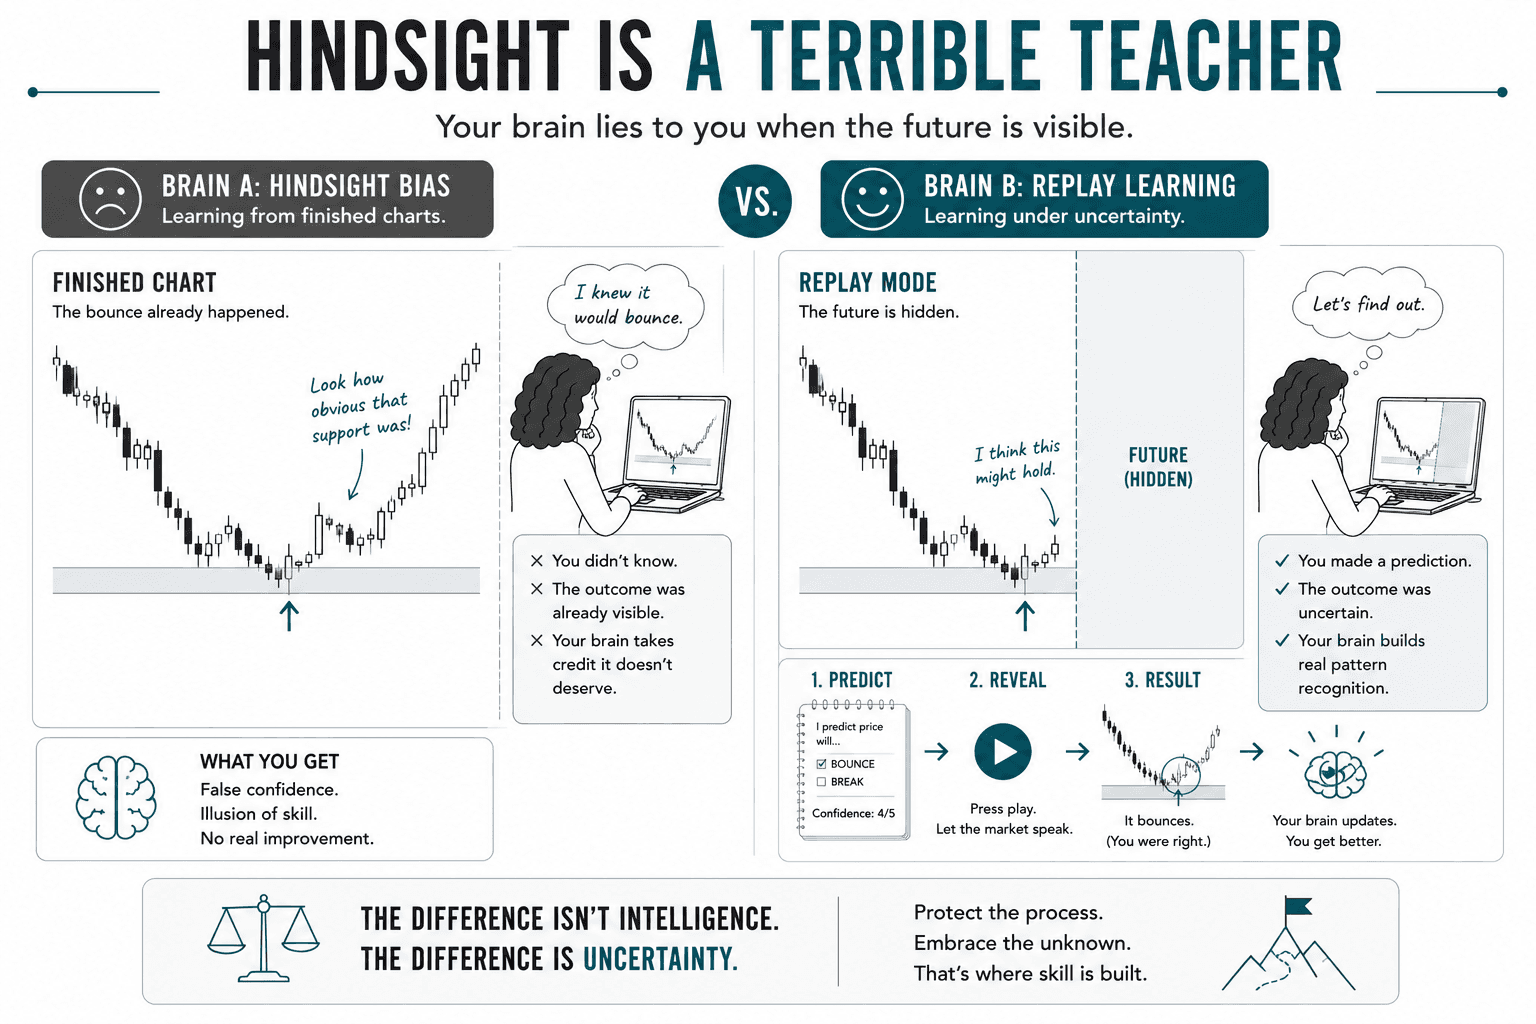
Most traders learn support passively by watching a YouTube guru draw a perfect line after a $200$ pip bounce. That trains you to recognize support after the fact, which pays exactly zero dollars. Replay mode forces you into the hot seat.
The Setup: Going Back in Time
Fire up the Time Machine: Open TradingView, hit the clock icon in the top toolbar to launch Bar Replay mode, and jump back in time.
Pick a Random Era: Scroll back at least six months so your brain doesn't secretly remember the price action. Stick to the 1-hour or 4-hour timeframes on a major pair. If you're frozen with indecision, just pick EUR/USD on the 1-hour chart and call it a day.
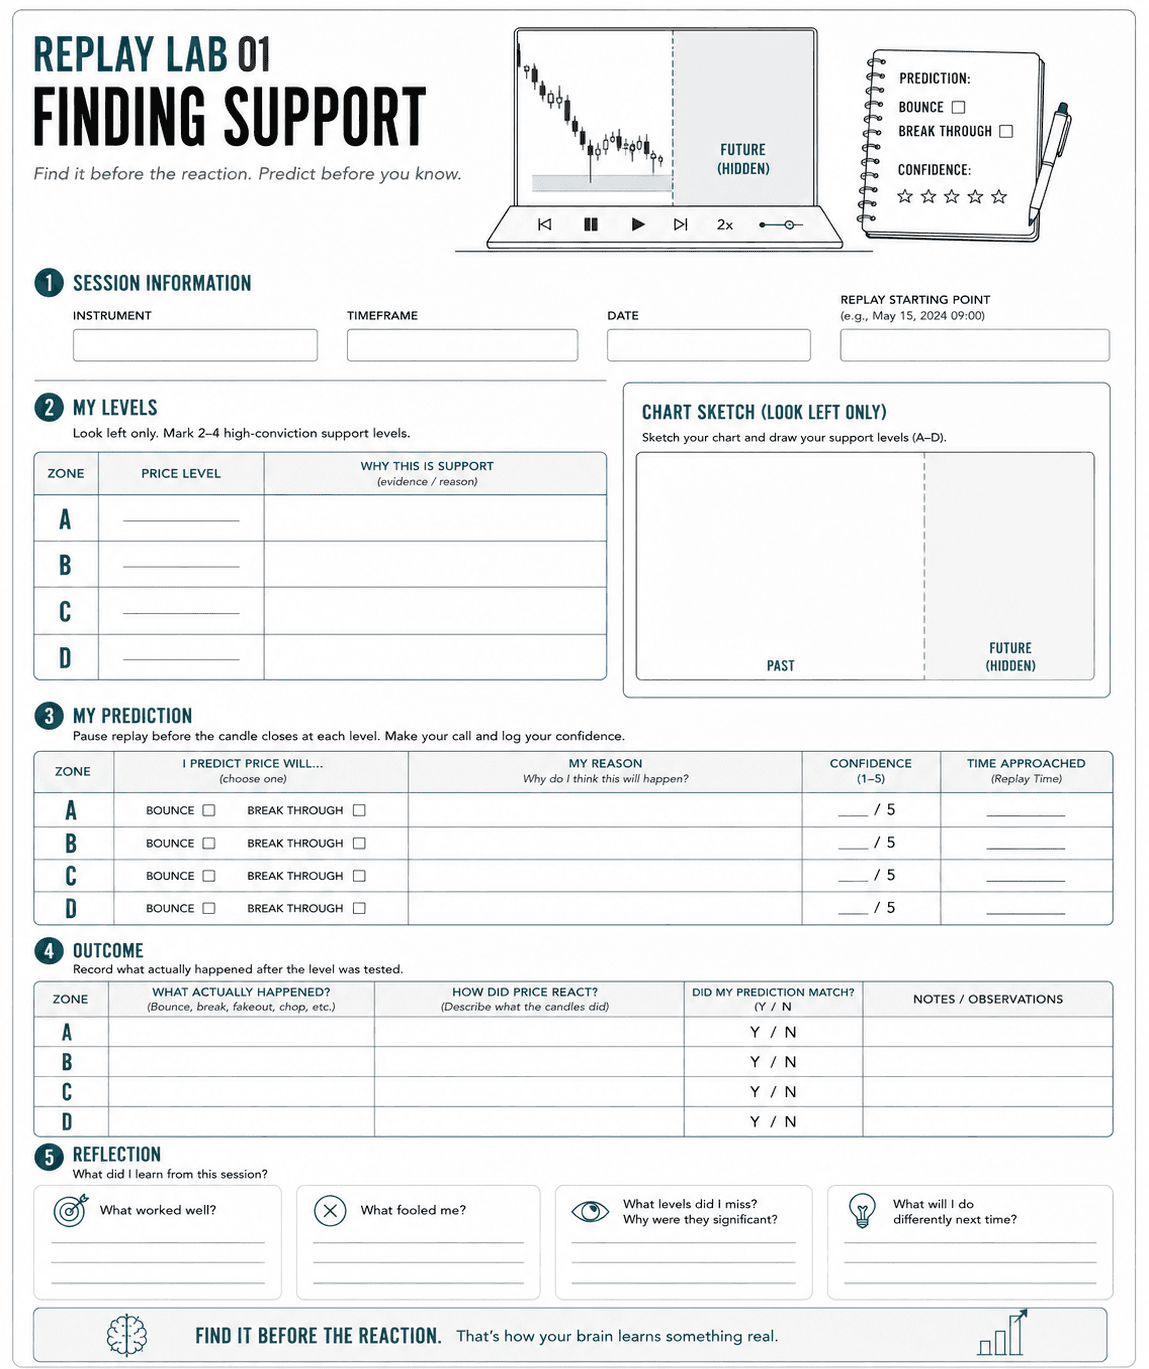
Lock Your Eyes to the Left: Before hitting play, look strictly at the historical price data to the left of your cutoff line. This is your only data source.
Grab Your Weapons: Get a notebook ready or open up TradingView’s horizontal line tool.
The Exercise: Step-by-Step
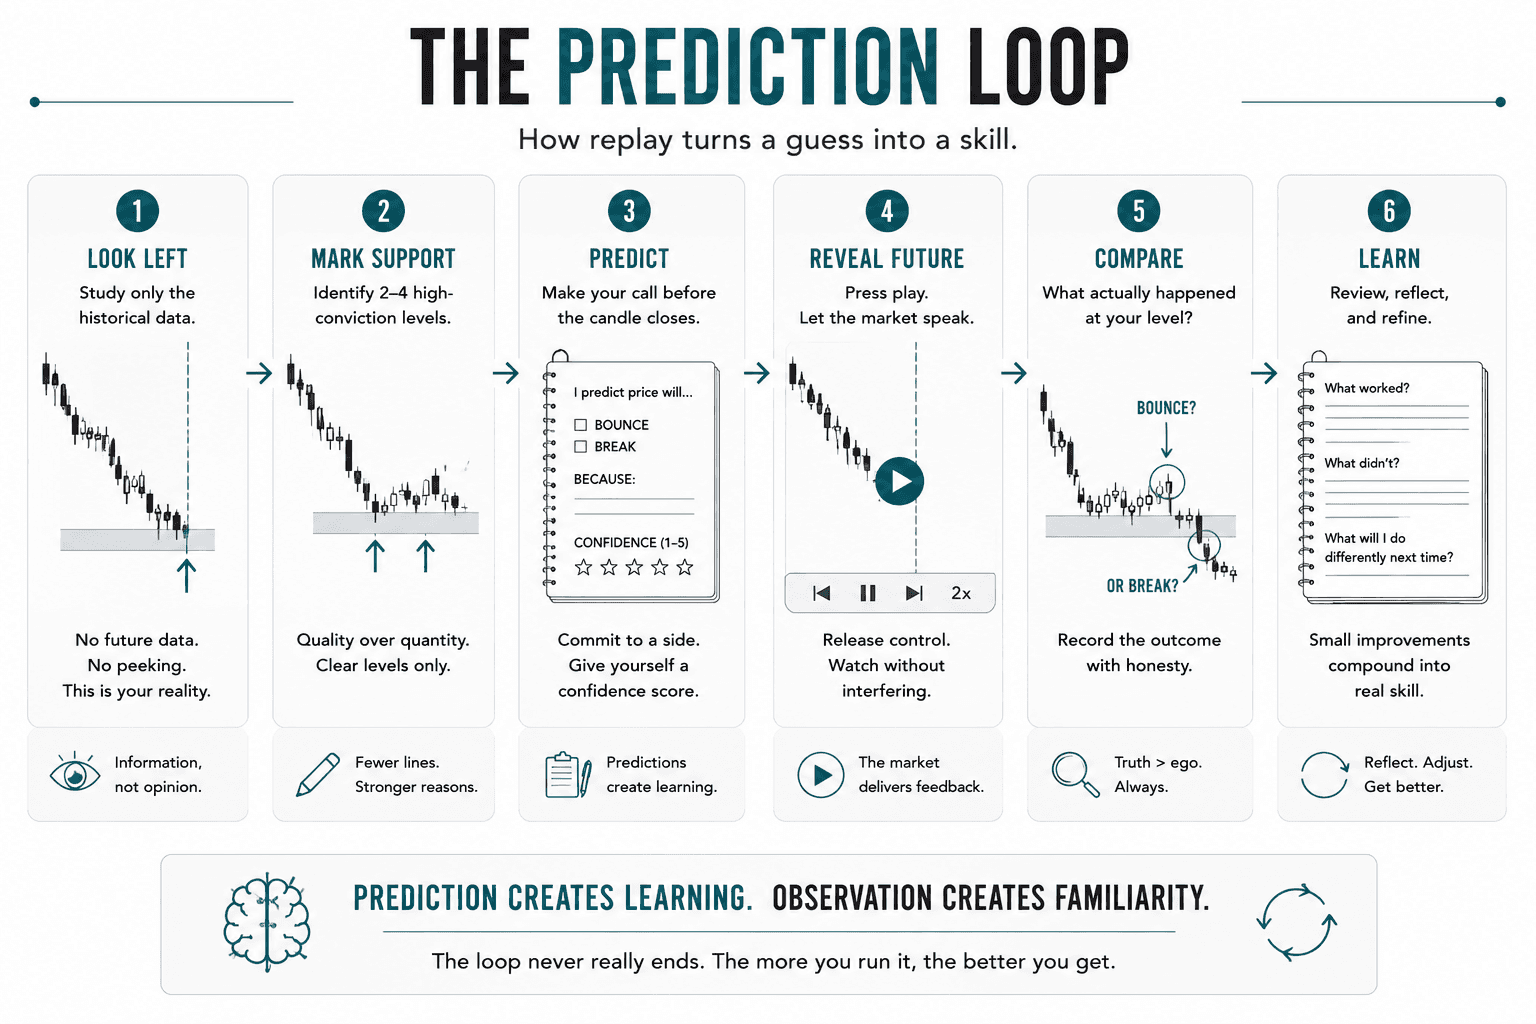
Step 1: Study the Past (5–10 Minutes)
Look left and find where price previously threw a tantrum and reversed. Look for:
Wick Clusters: Areas where multiple candle shadows piled up like a multi-car pileup.
Major Swing Lows: Massive bottoms that held strong, especially on the Daily or 4-hour charts.
Role Reversals: Old ceilings (resistance) that got smashed through and should now act as floors (support).
Psychological Numbers: Big, clean round numbers.
Violent Bounces: Places where price hit a wall and rocketed away, not a lazy drift.
Rule of Thumb: Mark two to four levels max. If you have to squint, zoom in 400%, and bargain with yourself to justify a line, it’s not a level.
Write down your justification for each line: "Previous swing low from March, tested twice."
Step 2: Hit Play
Start the replay at normal or 2x speed. Watch the candles print. You’ve drawn your lines in the sand—now let's see if the market crosses them.
Step 3: Call Your Shot (The Crucial Step)
When price starts barreling toward one of your lines, pause the replay before the candle closes. Write down a concrete prediction:
"I predict price will [bounce / slice through this like butter] because [reason]. My confidence level is [1 to 5]."
Then press play. Predicting before the outcome forces your brain to actually do heavy lifting. Passive watching is just entertainment; predicting is training.
Step 4: Autopsy the Outcome
Once the dust settles, write down what happened. Did it stall? Did it reverse completely? Did it fake everyone out before bouncing? Note what the candles looked like so you can calibrate your eyes for next time.
Step 5: Rinse and Repeat
Keep playing the session forward. A solid 30-to-60-minute replay session will usually give you three to six good tests of your structural levels.
Common Beginner Blunders
The Zebra Chart: Drawing 15 different lines. If your chart looks like a barcode, your levels mean nothing. One or two high-conviction lines beat a chaotic web of mediocre ones every day.
Diagonal Confusion: Confusing trendlines with support. Support is a horizontal floor, not a slide. Sloped lines are fine, but they belong in a different toolkit.
Recency Bias: Only marking the low that formed five minutes ago. The support levels that actually hold weight are the ones that have a proven historical track record of surviving multiple attacks.
Post-Game Analysis: Reading Your Own Data
After crushing five replay sessions, audit your journal and answer these honestly:
The Hit Rate: What percentage of your predictions actually played out? 50% to 60% is a great baseline. You aren't aiming for perfection; you're aiming for an edge.
The "Whiffs" (False Positives): When price ignored your level completely, why did it happen? Was the line actually meaningful, or did you make it up? Was the market dropping with insane momentum that no floor could stop?
The Missed Opportunities (False Negatives): Did price bounce beautifully off a level you completely ignored? Go back and look at what made that level special that your eyes missed.
The Ego Check (Confidence Calibration): Did your level 5 confidence setups actually perform better than your level 2 setups? If your confidence ratings don't match your actual accuracy yet, don't sweat it—that calibration comes with reps.
Keeping the Streak Alive
Treat this like a weekly gym session: one 45–60 minute block per week, jumping across different market environments and dates. Within 8 to 12 weeks of honest logging, your real-time chart navigation will feel noticeably sharper.
Once you're consistently hitting a 65% to 70%+ accuracy rate and your confidence scores align with reality, turn up the difficulty. Drop down to the 15-minute or 5-minute charts where the market "noise" is dialed up and levels are way more fragile.
Just make sure to alternate this training with the "Finding Resistance" version. Your eyes need to practice catching ceilings just as much as they practice catching floors, or you'll end up with a one-sided trading game.
You can't manifest a support level just by staring at a static chart and wishing it into existence. Find it while the future is completely blank, and your brain will actually learn something real.
Success Criteria
You will know this exercise is working when you can:
Filter the Noise: Restrict your chart to 2–4 high-conviction horizontal levels, avoiding a cluttered "barcode" chart.
Commit Before the Print: Consistently pause the replay and log a definitive prediction and confidence score before a candlestick closes on your level.
Calibrate Your Instincts: Achieve an initial 50% to 60% hit rate, with your confidence scores (1–5) statistically aligning with your actual accuracy over a series of sessions.
Common Misconception
If I study enough finished historical charts, I'll naturally get good at spotting support in real time.
The Truth: Looking at finished charts feeds you passive recognition. Because the spectacular bounce has already happened, your brain tricks you into thinking the level was completely obvious beforehand. Real-time trading requires active prediction under uncertainty, which static charts simply cannot train.
FAQ's
Q: Why replay mode? Can't I just look at normal charts?
Q: What if the session I pick looks like a complete mess with zero clear support?
Q: Do I need to be a chart-reading wizard before trying this?
Table of Contents
About Me

Krista Weber
After a career as a VP of UX and EdTech executive, I retired early—and quickly realized the traditional world of trading education is fundamentally broken.
As someone with a Master’s in HCI who specialized in the design of e-learning systems, I saw a massive gap: beginners aren't failing because trading is impossible; they’re failing due to massive cognitive overload and terrible instructional design.
This site bridges that gap. I’m applying the principles of learning science, systems thinking, and minimalist UX to strip away the market noise and teach trading the way it actually should be taught.
Stay in Touch
Some of the pages on my travel blog contain affiliate links. Whenever you buy something through one of these links, I get a small commission at no extra cost to you. As an affiliate, I only recommend products and services that I feel are high quality and helpful to my readers. Thanks for your support.
Read More

Open almost any trading platform and you'll see EUR/USD sitting next to XAU/USD, NQ, ES, and a dozen CFDs on stocks you've heard of. They all show up as candlesticks moving left to right, which quietly implies they're all the same kind of thing. They aren't. Before going deeper into any one of them, it's worth drawing the map.
Updated on Sep 6, 2026

Futures are standardized contracts tied to defined specifications and a future settlement date. They can look complex at first, but the mechanics become much clearer once you know what the contract specification controls. Here's what you actually need to know.
Updated on Sep 6, 2026

CFDs appear everywhere in retail trading – but most new traders couldn't explain exactly what they are or why that matters. Here's a plain-language breakdown, including the parts that most introductions skip.
Updated on Sep 6, 2026