
Replay Lab: Finding Resistance in a Past Session
Most traders build an asymmetric skillset without ever noticing it. If your natural bias is to look for long entries, you spend vastly more time staring at floors, resulting in a total blind spot for reading ceilings. This lab exists to close that structural gap on purpose.

Learning Path Stage 5: Sim Trading & Journaling
Learning Level 3: Application
Primary Learning Objective
The primary goal of this lesson is to develop an unbiased, bidirectional market perspective by systematically identifying, predicting, and tracking historical resistance levels (ceilings) with the same technical and psychological discipline usually reserved for support levels (floors).
What This Exercise Is For
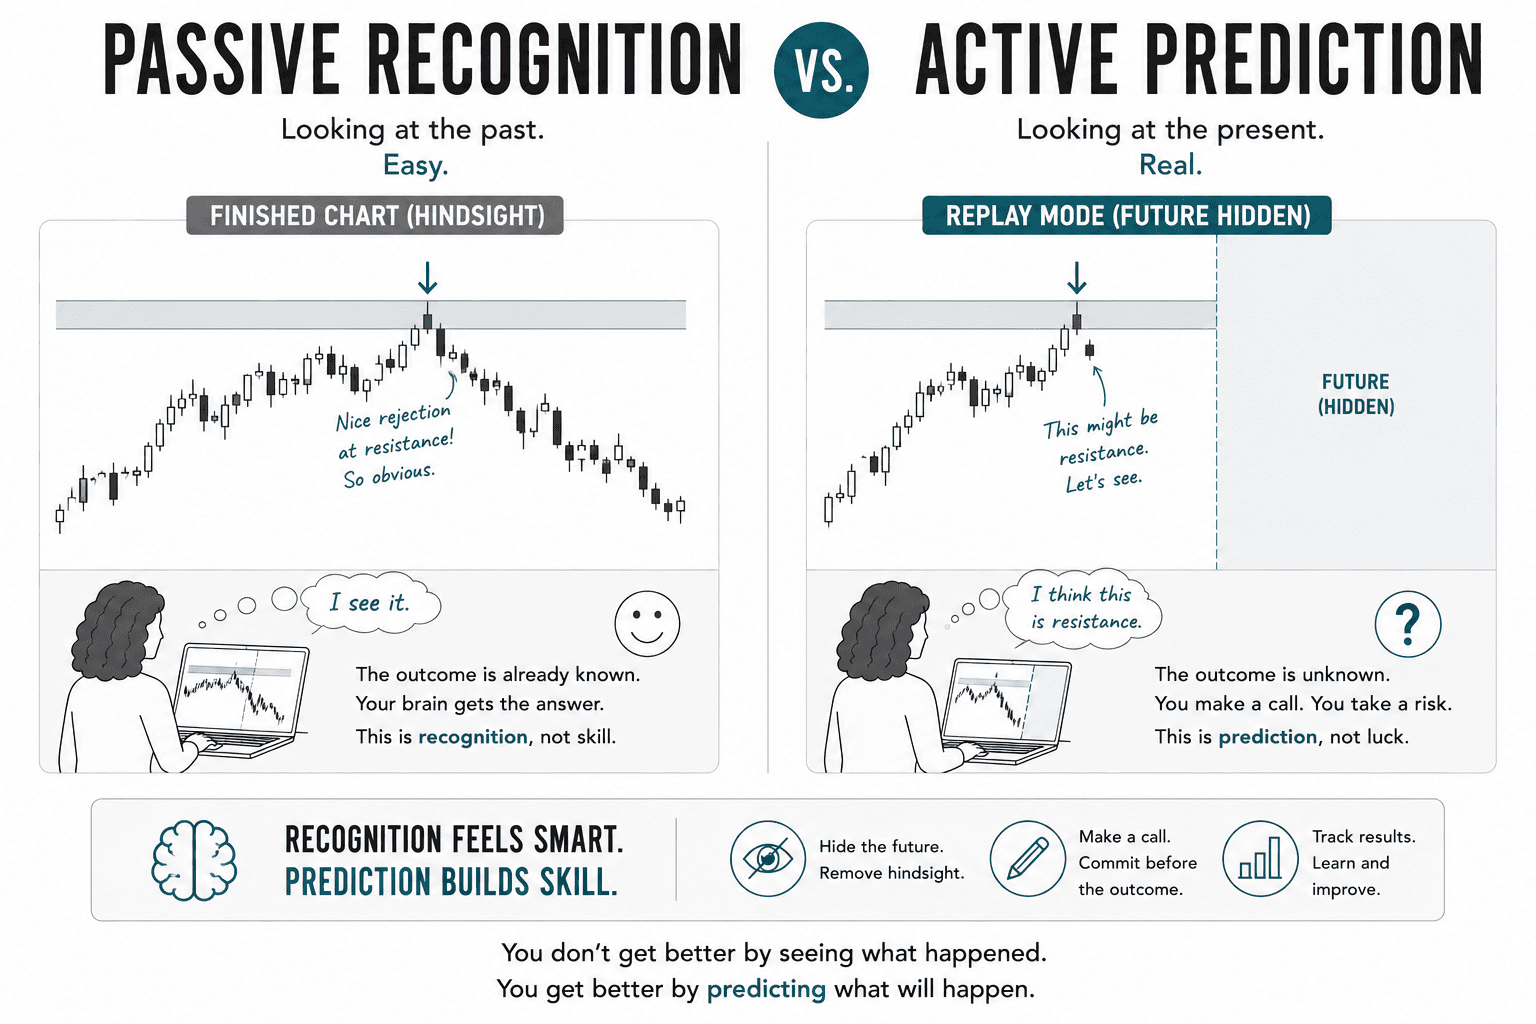
If you have already run the support version of this lab, you know the drill. This is the exact same discipline, just flipped upside down: instead of hunting for where eager buyers are waiting to catch a falling knife, you are locating where angry sellers are waiting with baseball bats to knock price back down.
Most traders build an asymmetric skillset without ever noticing it. If your natural bias is to look for long entries, you spend vastly more time staring at floors, resulting in a total blind spot for reading ceilings. This lab exists to close that structural gap on purpose.
Setup
Enter the Time-Travel Engine: Fire up TradingView and enter replay mode. Click that little clock icon in the top toolbar to launch Bar Replay.
Choose an Era You've Forgotten: Scroll back at least six months into history—far enough that your brain doesn't secretly remember what happens next. Use the 1-hour or 4-hour timeframe on a major instrument (EUR/USD is the standard vanilla default if you don't have a preference).
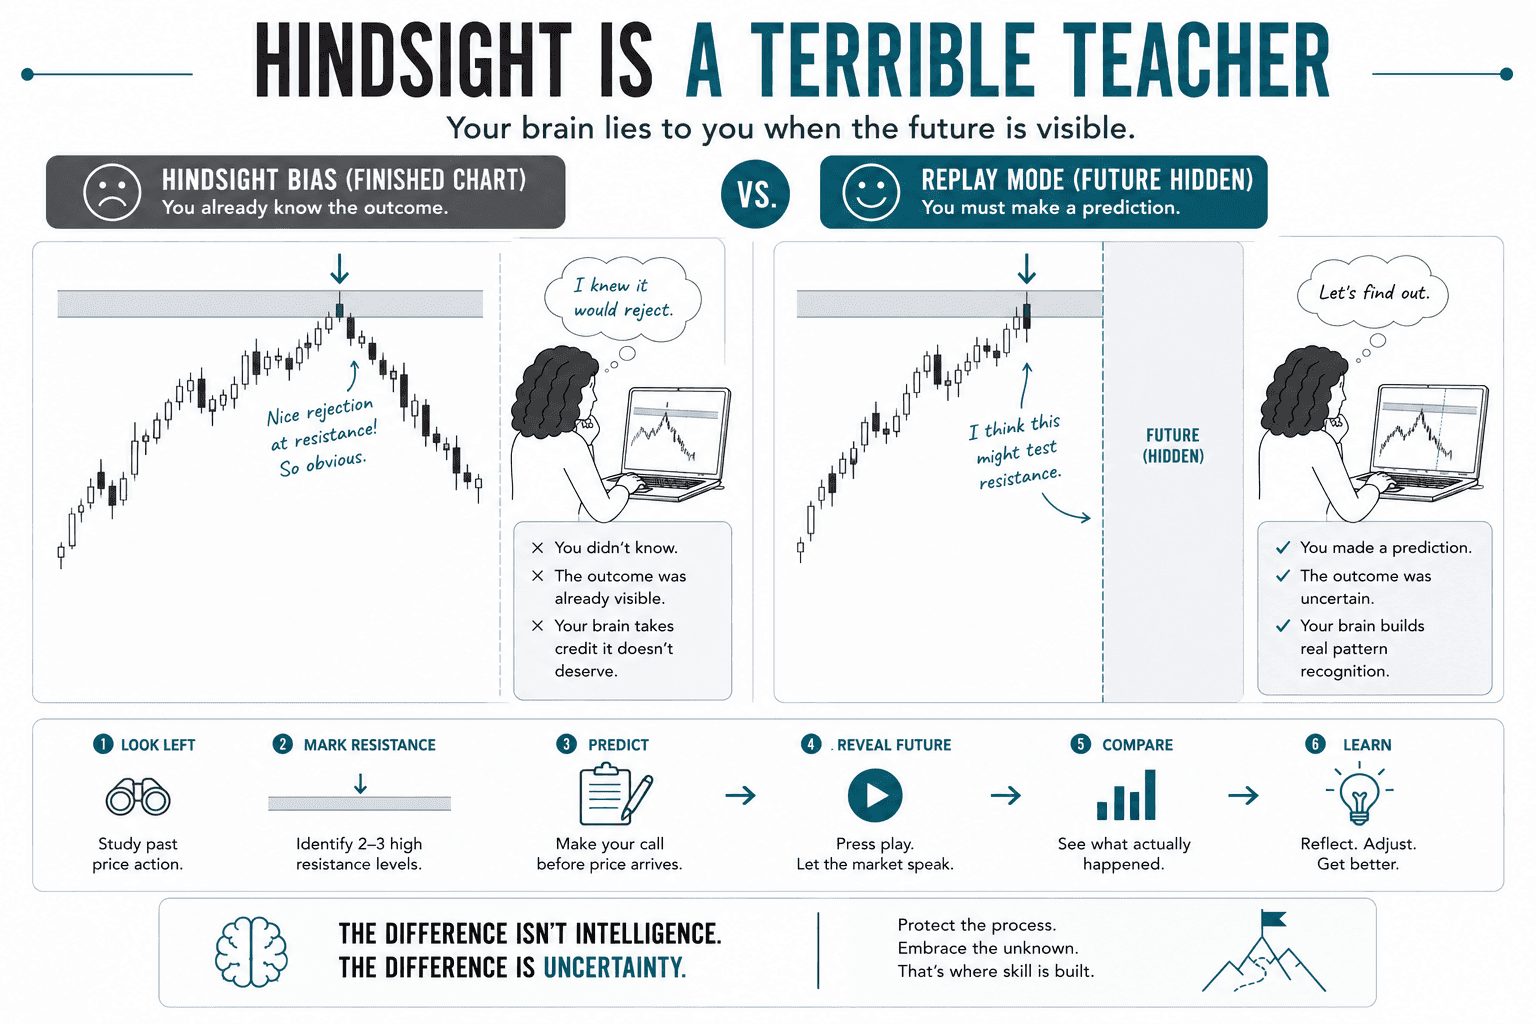
Anchor Your Reality: Before hitting play, look strictly to the LEFT of your starting point. This is your only source of truth, exactly like a live trading session. No peeking into the future.
Arm Yourself: Get a physical notebook or prepare your chart’s line tool. You will be drawing real lines in the sand.
The Exercise
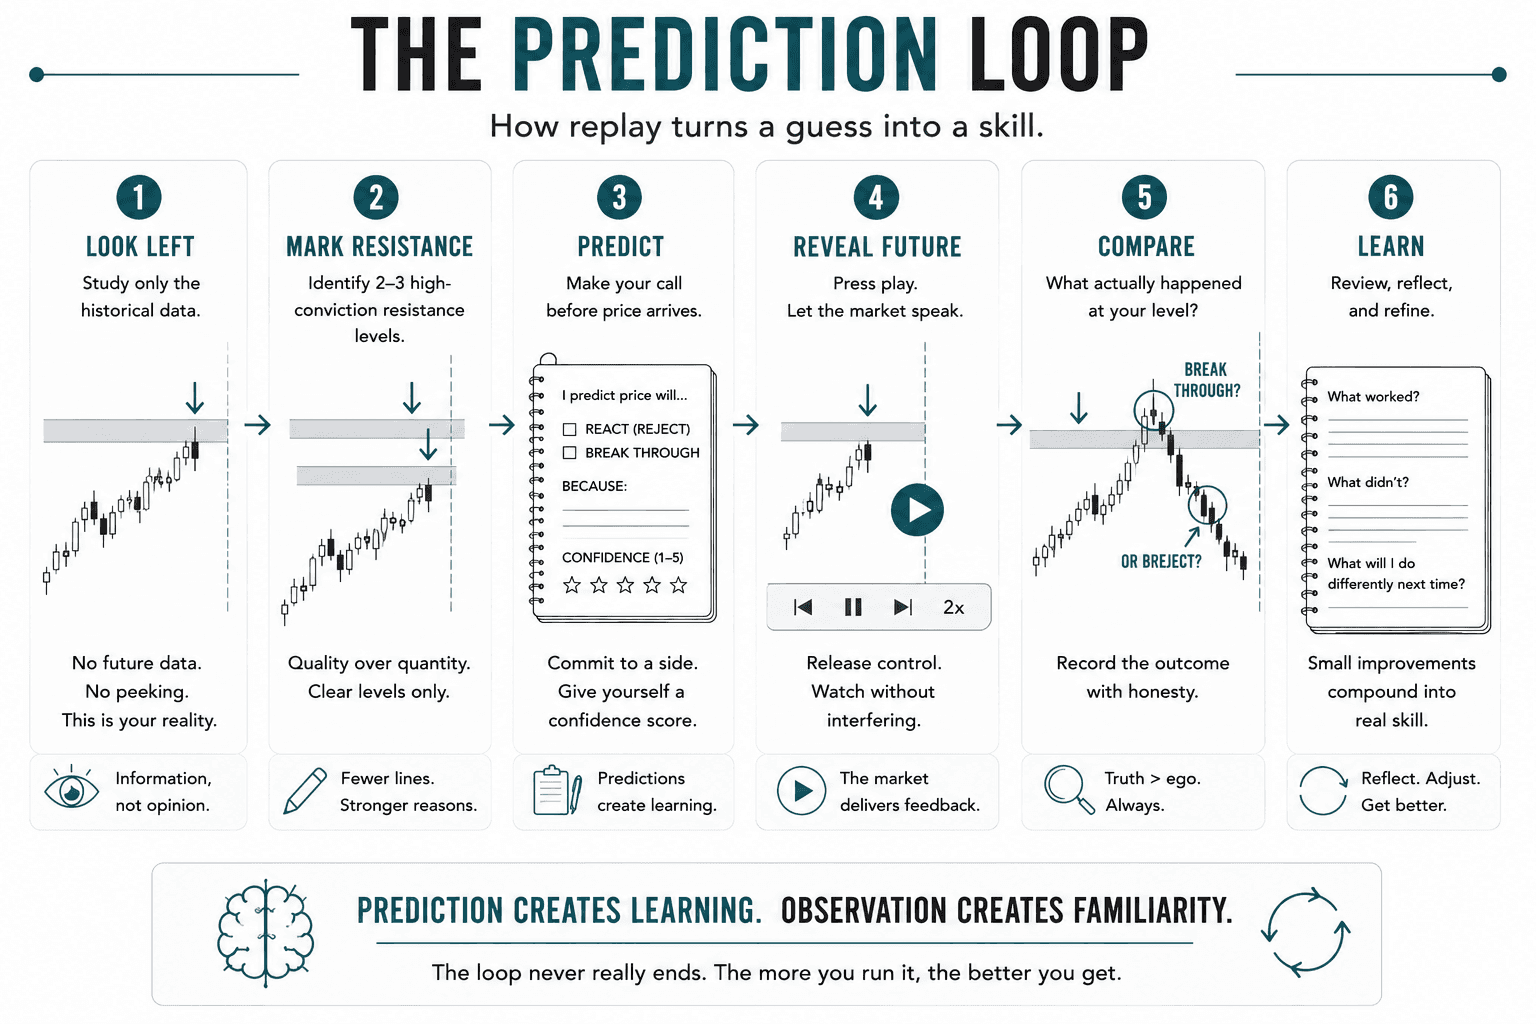
Step 1: The 10-Minute History Lesson
Look left and identify where price previously banged its head. Scan for:
Price zones where multiple candle wicks pushed upward and got brutally rejected (repeated tests).
Major prior swing highs that held strong, especially on the daily or 4H timeframes.
Role Reversals: Old support levels that price broke below and is now returning to from underneath (the classic "floor turns into ceiling" maneuver).
Psychological round numbers where orders naturally cluster.
Areas featuring sudden, violent rejections (not a slow, lazy drift sideways).
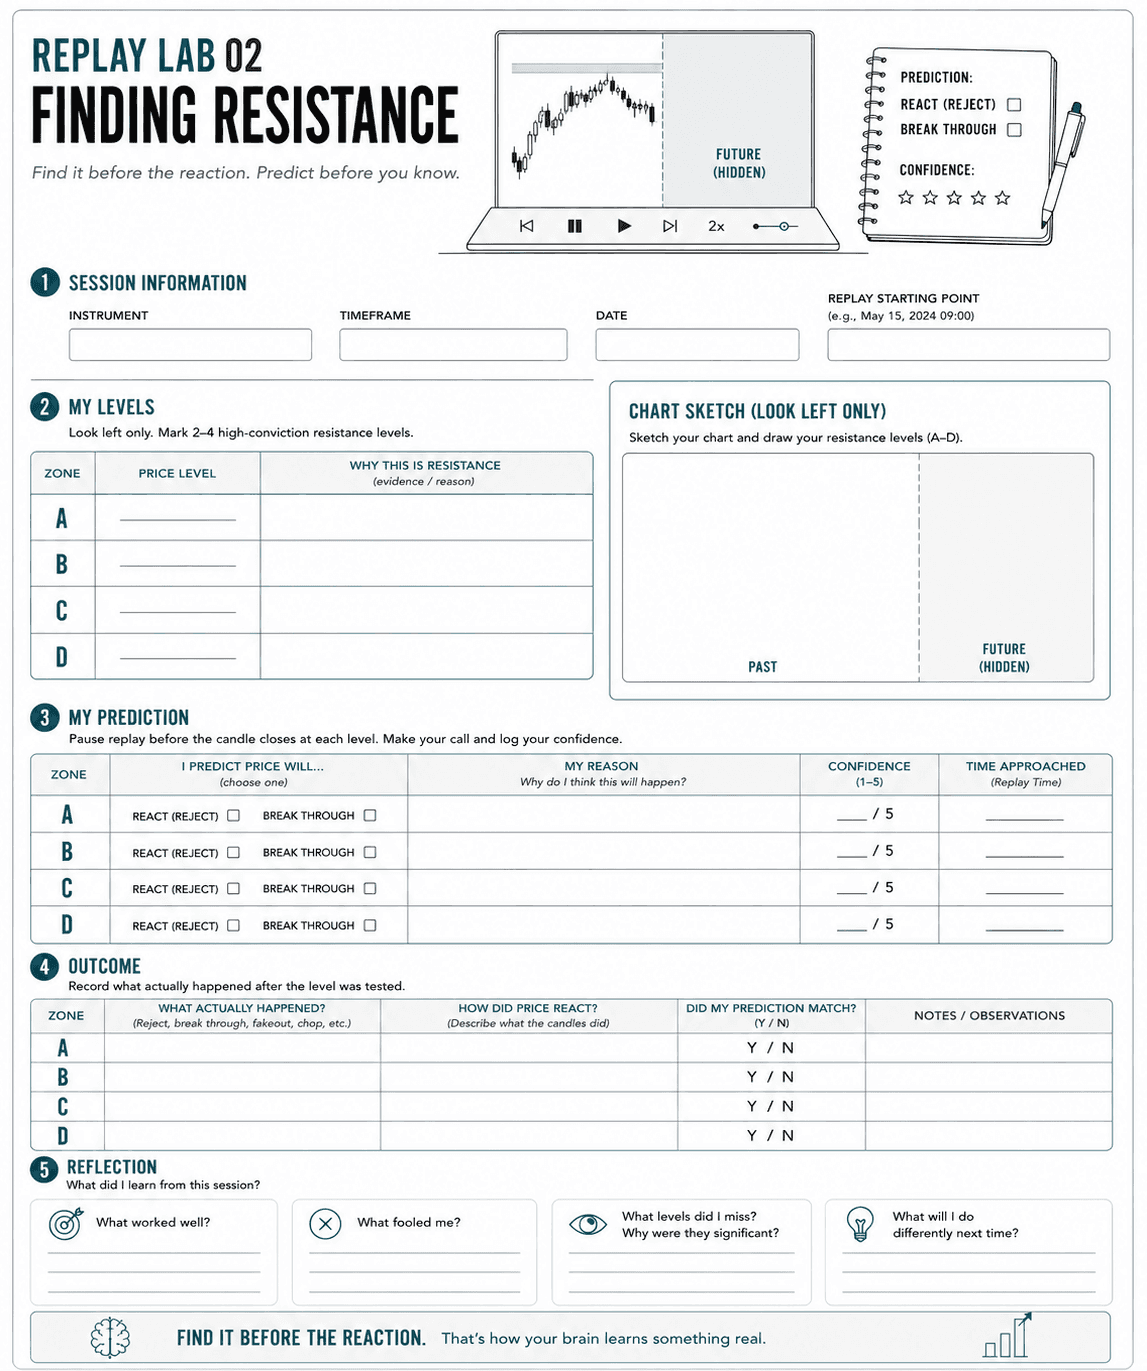
Mark 2 to 4 levels you believe are highly significant and write down a brief note explaining why they earned a spot on your chart (e.g., "Swing high from March, rejected twice like a bad date" or "Role reversal: old support broken in April, now being retested from below").
Step 2: Hit Play
Let the tape roll at normal or 2x speed. You already have your levels marked; now it's time to see if the market actually cares about your drawings.
Step 3: The Mid-Flight Reality Check
When price approaches one of your marked zones, pause the replay right before the candle closes. Write down your definitive call:
"I believe price will [react / smash through] this level because [insert logic here]. My confidence level is a [1 to 5]."
Resume the tape and watch the chaos unfold.
Step 4: Autopsy the Moment
Note exactly what happened: Did price produce a brief stall, a violent reversal, or did it slice through your level like butter? Take a close look at what the candles looked like right at the line.
Step 5: Run it Back
Repeat this process for two or three more levels in the session. A full replay session spanning 30 to 60 minutes typically yields 3 to 6 meaningful tests.
Common Mistakes in Early Resistance Identification
Marking every single high point: Just because price visited a level once for a split second does not make it historical resistance. Look for a real fight, a stall, or a massive rejection wick—not just a random high-water mark.
Snubbing role reversals: A broken floor is frequently the most reliable ceiling on the chart. Do not overlook a level just because it used to be a support zone.
Recency bias pricing: The resistance levels that matter most usually have an extensive resume. A brand-new high price that has never been revisited carries nowhere near the structural weight of an old, heavily defended battleground.
What to Do With the Results
After surviving five replay sessions, aggregate your notes and audit your performance:
Overall Hit Rate: What percentage of your lines actually caused a reaction? Track this entirely separate from your support stats so you can diagnose if you have a favorite direction.
False Positive Analysis: When the market ignored your line completely, what was the common thread? Was the level entirely imaginary, or was the macro trend simply too powerful to care?
False Negative Analysis: Did price reverse violently at a level you completely missed? What structural cue did you leave out?
Confidence Calibration: Did your "level 5 confidence" calls actually land more often than your "level 1 hunches"? If they look identical, your intuition needs a tune-up.
Running This Regularly
Alternate this with the support version on a weekly basis so both directions receive equal love, rather than one becoming second nature and the other an afterthought. Over 8 to 12 weeks of honest, disciplined tracking, you will watch both hit rates climb as you realize which direction started out weaker.
A ceiling and a floor are just two sides of the exact same coin. Mastering them requires practicing both, not just practicing one and assuming the other will figure itself out.
Success Criteria
You will know the exercise is working when you can:
Isolate Historical Context: Successfully mark 2 to 4 valid overhead zones on a backtracked chart using only past data to the left of your starting point.
Commit to Predictions: Log a definitive directional call ("react" or "break through") and assign a clear confidence rating (1 to 5) before playing the tape forward.
Uncover Personal Bias: Establish a separate resistance "hit rate" over 5+ sessions to directly compare against your support data and pinpoint structural blind spots.
Common Misconception
Every prior high is automatic resistance.
The Truth: Traders often mistake a random, single high-water mark for a true ceiling. In reality, reliable resistance requires evidence of a real battle, such as repeated tests, violent rejection wicks, a sharp stall, or an old broken floor acting as a role reversal.
FAQ's
Q: What if the session I'm replaying never produces a clean test of resistance?
Q: How is grading my hit rate on resistance different from grading it on support?
Q: I already did the support version. Do I really need to repeat it for resistance?
Table of Contents
About Me

Krista Weber
After a career as a VP of UX and EdTech executive, I retired early—and quickly realized the traditional world of trading education is fundamentally broken.
As someone with a Master’s in HCI who specialized in the design of e-learning systems, I saw a massive gap: beginners aren't failing because trading is impossible; they’re failing due to massive cognitive overload and terrible instructional design.
This site bridges that gap. I’m applying the principles of learning science, systems thinking, and minimalist UX to strip away the market noise and teach trading the way it actually should be taught.
Stay in Touch
Some of the pages on my travel blog contain affiliate links. Whenever you buy something through one of these links, I get a small commission at no extra cost to you. As an affiliate, I only recommend products and services that I feel are high quality and helpful to my readers. Thanks for your support.
Read More

Open almost any trading platform and you'll see EUR/USD sitting next to XAU/USD, NQ, ES, and a dozen CFDs on stocks you've heard of. They all show up as candlesticks moving left to right, which quietly implies they're all the same kind of thing. They aren't. Before going deeper into any one of them, it's worth drawing the map.
Updated on Sep 6, 2026

Futures are standardized contracts tied to defined specifications and a future settlement date. They can look complex at first, but the mechanics become much clearer once you know what the contract specification controls. Here's what you actually need to know.
Updated on Sep 6, 2026

CFDs appear everywhere in retail trading – but most new traders couldn't explain exactly what they are or why that matters. Here's a plain-language breakdown, including the parts that most introductions skip.
Updated on Sep 6, 2026