
Trend Following Part 5: How to Backtest a Trend Following Strategy That Actually Tells You Something
Trend following is one of the few trading approaches where rigorous backtesting is both achievable and genuinely informative. Here's how to run an honest test, what metrics to look for, and what the research actually shows.

Learning Path Stage 5: Sim Trading & Journaling
Learning Level 3: Application
Primary Learning Objective
By the end of this lesson, you will be able to design, execute, and interpret a backtest of a trend following system with appropriate skepticism about what the results do and don't prove.
Oh the Humanity!
Most discretionary trading strategies face a fundamental, existential crisis when it comes to backtesting: human bias.
When you scroll backward through a completed chart, your brain instantly locks onto "obvious" support zones or textbook chart patterns that perfectly predicted a 200-pip move. But let’s be honest—that zone is only obvious because you can see the right side of the screen. This is hindsight bias, and it is the exact mechanism used to manufacture fake trading-course testimonials.
Trend following largely avoids this trap because its rules require zero human interpretation.
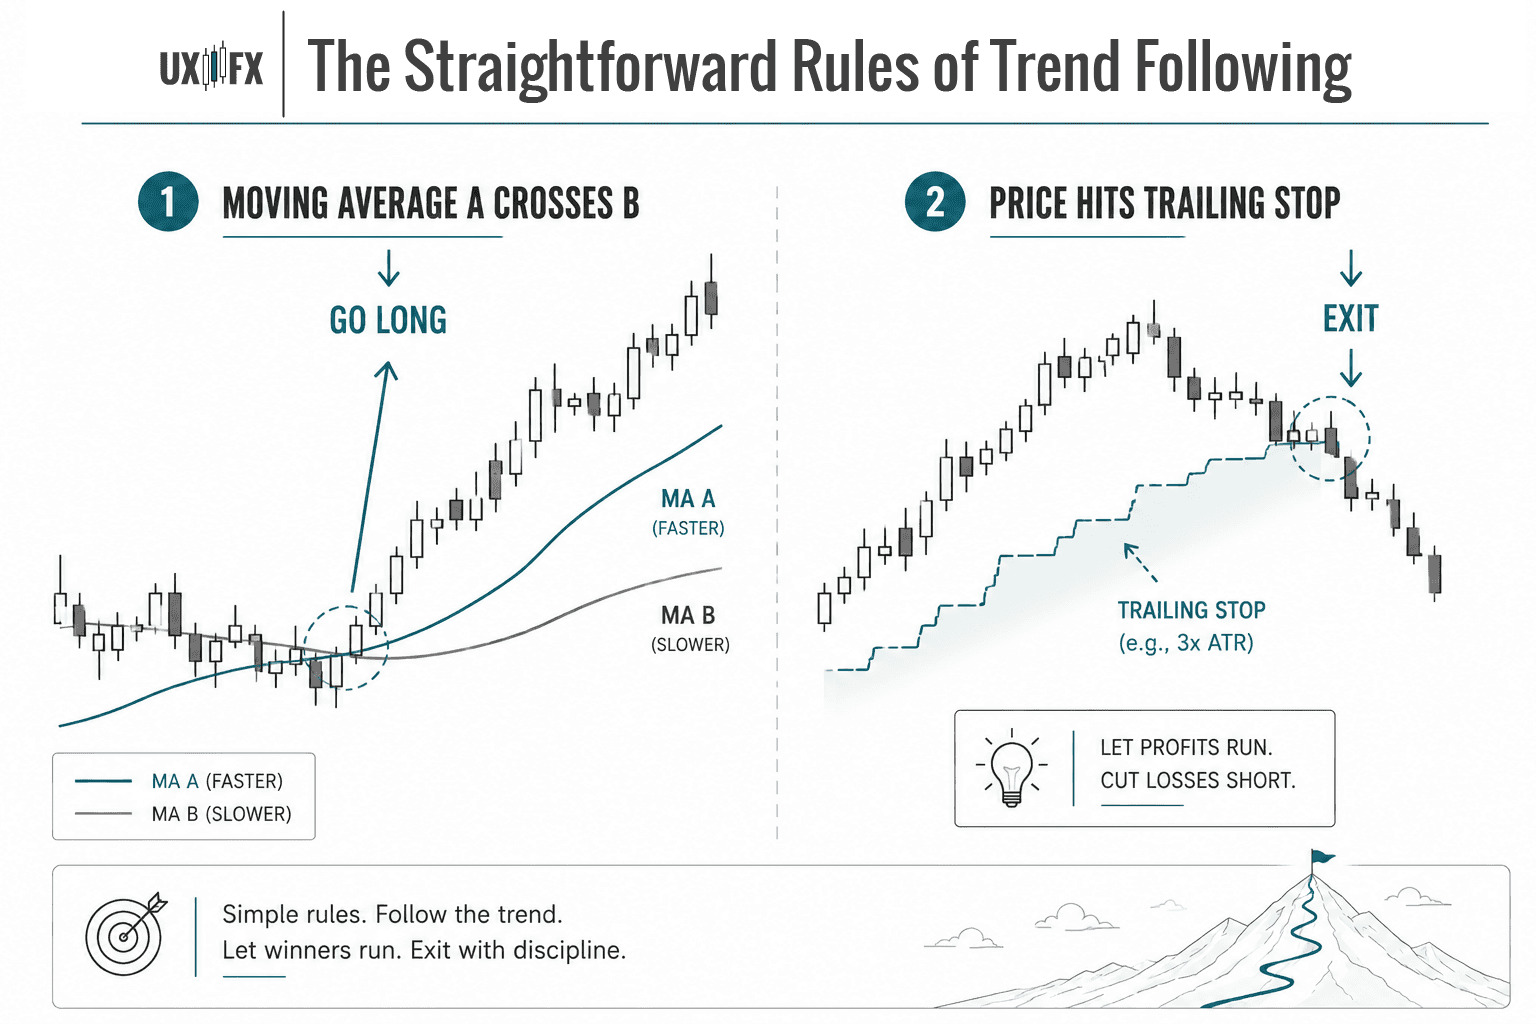
The rules run identically whether it’s 1995, 2026, a simulated backtest, or a live account. It is one of the most reliably backtestable approaches available to retail traders—not because the results are always pretty, but because the historical data is a brutally honest reflection of what the system would have actually done in real-time.
1. The Blueprint for a Legitimate Backtest
The absolute most critical step in backtesting trend following happens before you even open your charting software: you must write down the complete ruleset in ink.
This isn't a bureaucratic formality; it's an emergency brake for your cognitive biases. If you don't define your rules beforehand, you will unconsciously tweak your indicators mid-test the second you encounter a string of losses to make the data fit your feelings.
Your written contract must explicitly define:
The Entry Signal: Exact parameters (e.g., 20/50 EMA crossover on the Daily close).
Initial Stop Loss: Where you cut the cord on day one.
Trailing Stop Mechanism: Exactly how you let winners run (e.g., 3x ATR).
Position Sizing: The exact math governing your risk per trade.
The Asset List & Timeframe: What you are testing and across what dates.
The Testing Procedure
Start with a single clean instrument (like EUR/USD on the daily chart) and run the numbers over a minimum of five years (ideally ten). Once you finish, take those exact same, unedited rules and run them across Gold or Crude Oil.
Trend-following edge varies by instrument because some markets trend beautifully, while others behave like a choppy, erratic range-bound mess. If your rules make a fortune on one specific contract but completely incinerate your capital on four others, you haven't found an edge, you’ve just successfully mined data.
The Code is the Contract: If you use TradingView's Pine Script, the strategy tester handles the heavy lifting mechanically. Public libraries are full of pre-built EMA and ATR scripts. Just make sure to audit the code to ensure it matches your written intent. Testing code that doesn't align with your rules means you are simply evaluating someone else's system.
2. Key Metrics (And What to Actually Look For)
When you look at a backtest report, look past the total net profit line. That’s the vanity metric. You need to look at the architectural integrity of the system:
Metric | Target Range | The Reality Check |
Win Rate | 35% – 45% | If your trend backtest shows a 60% win rate, alarm bells should ring. It usually means you're choking your winners and taking profit too early rather than letting the trend mature. |
Profit Factor | 1.5 – 2.0 | Gross profit divided by gross loss. Anything above 1.5 over a decade is solid. Anything north of 2.2 usually means you accidentally curve-fitted the system to the past. |
Reward-to-Risk | 2:1 or Higher | Because you are going to lose 6 out of 10 trades, your average winner must be significantly larger than your average loser, or the mathematical expectancy implodes. |
Maximum Drawdown vs. Psychological Tolerances
A system that yields a 20% annual return with a 45% maximum drawdown is mathematically viable, but practically unusable for a retail human being. You will abandon it in a panic halfway through that drawdown.
Trend-following systems typically live in a 20% to 35% maximum drawdown neighborhood. When evaluating this metric, look closely at drawdown duration. A 25% drop that recovers in three months is a completely different psychological design than a 25% drop that leaves your equity curve flatlining for two painful years.
Sample Size Matters
A daily chart system typically yields only 10 to 20 trades per year per asset. Testing one instrument for five years gives you roughly 50 to 100 trades, which is a decent pilot study, but not statistically definitive. A ten-year, multi-asset test yielding 300 to 500 trades provides the actual statistical confidence required to trade real capital. Anything under 30 trades is just not enough data to be actionable.
3. What the Academic Research Shows
If you're still skeptical, step away from trading forums and look at peer-reviewed financial history. The academic evidence for trend following is more robust and verifiable than almost any other methodology retail traders debate.
The Century of Evidence
In the landmark paper "A Century of Evidence on Trend-Following Investing" (AQR Capital Management), researchers analyzed trend performance across equities, bonds, currencies, and commodities from 1880 to 2013.
The verdict? Consistent, positive returns across a 134-year horizon spanning world wars, monetary regime shifts, and the birth of digital trading. It yielded a modest but persistent Sharpe ratio of roughly 0.4.
Subsequent papers like "Time Series Momentum" (Moskowitz, Ooi, and Pedersen, 2012) and "Two Centuries of Trend Following" (Lempérière et al., 2014) confirmed the exact same reality: the momentum premium is real, it survives transaction costs, and it exists because it is anchored to fundamental human herd behavior under stress. It doesn't guarantee future returns, but it vastly increases the probability that your edge isn't a figment of your imagination.
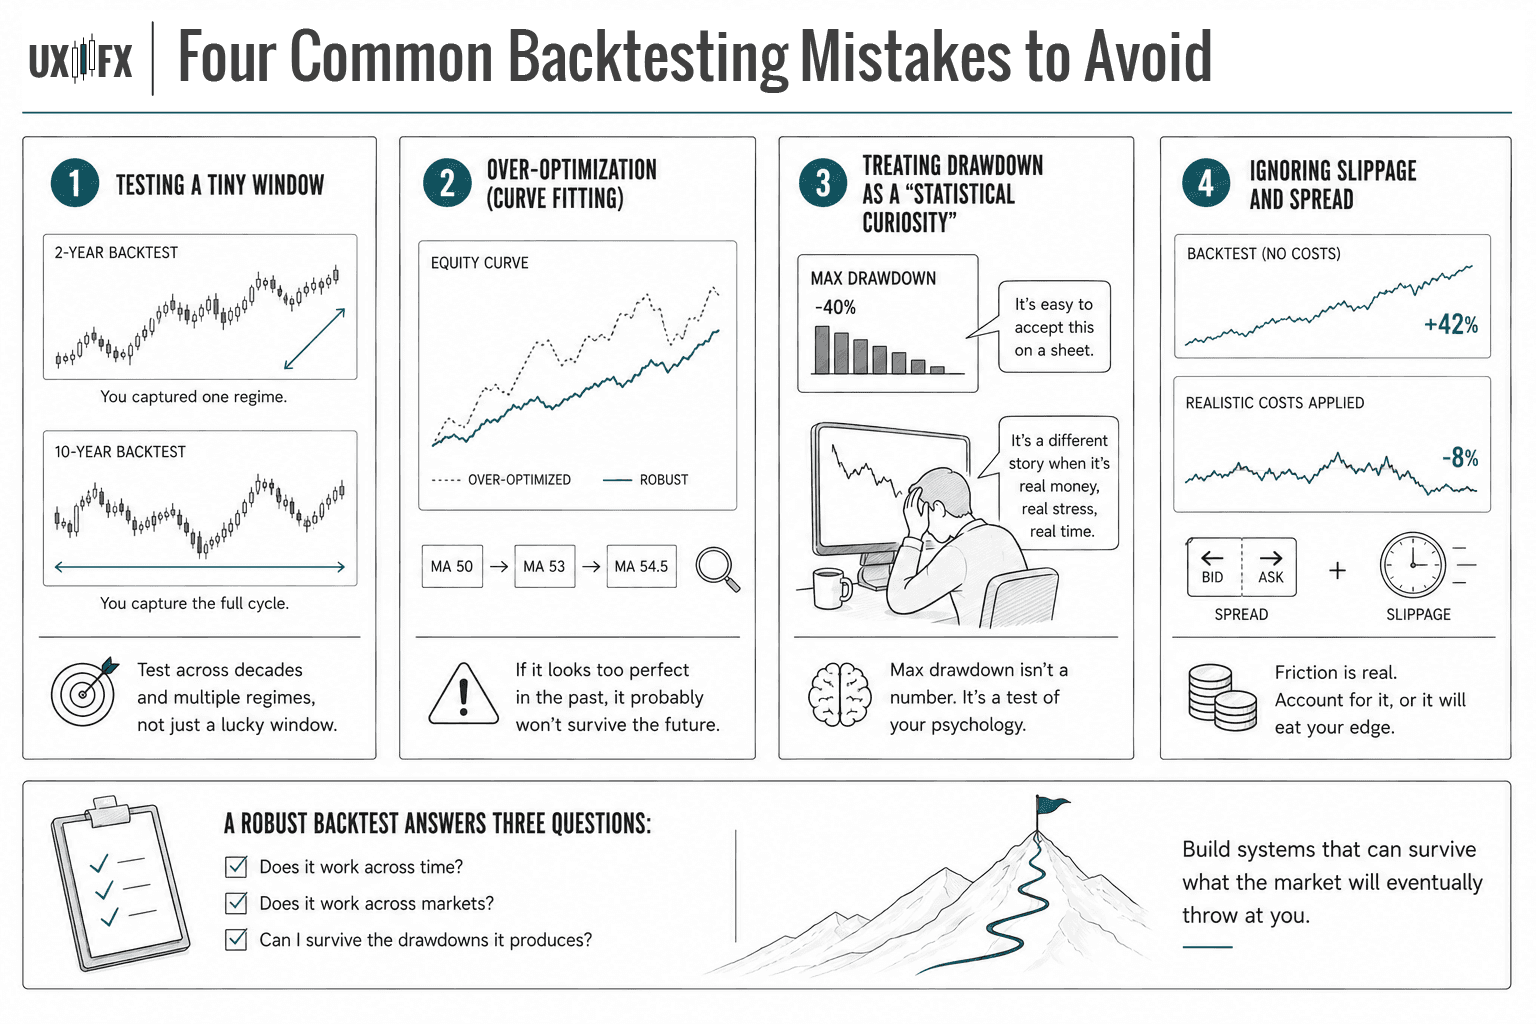
4. Four Common Backtesting Mistakes to Avoid
Testing a Tiny Window: Running a two-year backtest on a single market usually means you either captured only a great bull market or only a choppy range. You’re evaluating a single market regime, not a complete system cycle.
Over-Optimization (Curve Fitting): If you spend your weekends adjusting your moving average from a 50 to a 53, then to a 54.5 just to make a historical equity curve look smoother, you are creating a fragile piece of software that will immediately shatter when it meets live, unseen market data.
Treating Drawdown as a "Statistical Curiosity": It’s easy to look at a historical 40% drawdown column on a spreadsheet and say, "Yeah, I could handle that." It is a completely different experience when it's Tuesday morning, your account is down thousands of dollars of real cash, and you're on month four of a losing streak. Max drawdown is a functional boundary of human endurance.
Ignoring Slippage and Spread: A daily trend system with low trade frequency can absorb transaction costs relatively easily. But if you try to bring this down to shorter timeframes without factoring in realistic spreads and execution slippage, the friction will quietly turn a profitable backtest into a losing live system.
5. The Forward Test: Auditing the Human Operator
Once your backtest proves the math holds up, you have completed exactly half the assignment. Now you must forward-test the strategy in real-time. Depending on your previous trading experience and loss aversion, this can be done either on a demo account or using microscopic position sizes. Personally, I'd spend at least a month paper trading before I got too cocky.
The backtest evaluates the system. The forward test evaluates you.
Budget at least six months for this phase. You need enough trade samples to watch the market change shapes under your feet. More importantly, you need to experience what it feels like to execute a written rule under absolute uncertainty, when you can't just glance to the right side of the monitor to see how the story ends.
The forward test teaches you whether you possess the behavioral design to stick to the script when you're losing, when you're deeply bored, and when everything in your lizard brain is screaming at you to intervene.
The math is entirely on your side. The real question is whether your psychology can handle it.
Success Criteria
After completing this lesson, you should be able to build a simple EMA crossover backtest in TradingView, interpret the key metrics, identify the most common backtesting mistakes, and explain what forward testing adds that backtesting cannot.
Common Misconception
A profitable backtest proves a trend following system works.
The Truth: It proves the system was profitable on past data under specific tested conditions; whether it will be profitable going forward depends on whether the edge is structural and behavioral rather than period-specific.
FAQ's
Q: Can I trust TradingView's built-in Strategy Tester for trend following?
Q: What's the minimum backtest period for trend following?
Q: What profit factor should I look for in a trend following backtest?
Table of Contents
About Me

Krista Weber
After a career as a VP of UX and EdTech executive, I retired early—and quickly realized the traditional world of trading education is fundamentally broken.
As someone with a Master’s in HCI who specialized in the design of e-learning systems, I saw a massive gap: beginners aren't failing because trading is impossible; they’re failing due to massive cognitive overload and terrible instructional design.
This site bridges that gap. I’m applying the principles of learning science, systems thinking, and minimalist UX to strip away the market noise and teach trading the way it actually should be taught.
Stay in Touch
Some of the pages on my travel blog contain affiliate links. Whenever you buy something through one of these links, I get a small commission at no extra cost to you. As an affiliate, I only recommend products and services that I feel are high quality and helpful to my readers. Thanks for your support.
Read More

Open almost any trading platform and you'll see EUR/USD sitting next to XAU/USD, NQ, ES, and a dozen CFDs on stocks you've heard of. They all show up as candlesticks moving left to right, which quietly implies they're all the same kind of thing. They aren't. Before going deeper into any one of them, it's worth drawing the map.
Updated on Sep 6, 2026

Futures are standardized contracts tied to defined specifications and a future settlement date. They can look complex at first, but the mechanics become much clearer once you know what the contract specification controls. Here's what you actually need to know.
Updated on Sep 6, 2026

CFDs appear everywhere in retail trading – but most new traders couldn't explain exactly what they are or why that matters. Here's a plain-language breakdown, including the parts that most introductions skip.
Updated on Sep 6, 2026