
The Retest: What It Is and Why It Matters
Think a breakout means you missed the boat? Think again. The retest is the market’s way of checking its homework, offering savvy traders a second-chance entry that's cheaper, tighter, and way less stressful than chasing the initial surge. Here is how to spot a genuine role-reversal, and avoid getting caught in a breakout trap.

Learning Path Stage 2: Reading Charts
Learning Level 2: Understanding
Primary Learning Objective
By the end of this lesson, you will be able to identify a valid support/resistance retest, distinguish a high-probability pullback from a failed fakeout using price action signals, and utilize retests to structure higher-reward, lower-risk trade entries.
Imagine this: Price finally cracks a major resistance level. It struts higher for a few candles, making everyone who bought the breakout feel like financial wizards. Then, the vibe shifts. It starts pulling back, heading straight toward the exact spot it just broke.
You sit there staring at your screen, palms sweating. Does it hold? Does it crash through and ruin my week? What is this pullback trying to tell me?
Welcome to the retest. It’s one of the most heavily cited and profoundly misunderstood behaviors in technical analysis. Let’s break down what’s actually happening when the market decides to double-check its homework.
What a Retest Actually Is
A retest occurs when price breaks through a key level (support or resistance) and then turns right back around to visit that level from the opposite side. Think of it as the market testing whether the level is ready to accept its new role in life.
Markets love a good role-reversal story:
Bullish Role Reversal: Resistance becomes support once price breaks above it. Price comes back to kiss the level from above. If buyers step in and defend it, the reversal is official.
Bearish Role Reversal: Support becomes resistance once price breaks below it. Price drifts back up to touch it from below. If sellers slap it back down, the bears win the round.
The Logic: When a major breakout happens, trapped traders are scrambling to adjust their positions. The retest is simply the market’s way of asking, "Hey, are there actual buyers/sellers willing to defend this line now, or was that breakout just a fluke?"

Why Retests Create Better Entries (and Save Your Sanity)
Chasing a breakout the second it happens is a great way to spike your cortisol levels. You are buying at the absolute most expensive price of the move, right when the market is exhausted. Your stop-loss has to sit miles away on the other side of the level, leaving you exposed.
Waiting for the retest fixes this in three distinct ways:
A Much Better Price: If you’re bullish, waiting for the pullback lets you buy the asset on a discount relative to the breakout high. Why pay retail when you can buy wholesale?
A Tighter, Cleaner Stop: If the retest holds, your stop-loss goes right beneath the retest low. The market has literally just pointed to the screen and said, "Here is exactly where we are willing to defend."
Real Evidence, Less Hope: Price returning to a level and refusing to break back through is actual data. You’re trading on confirmation rather than pure adrenaline and FOMO.
The Retest Checklist: What to Look For
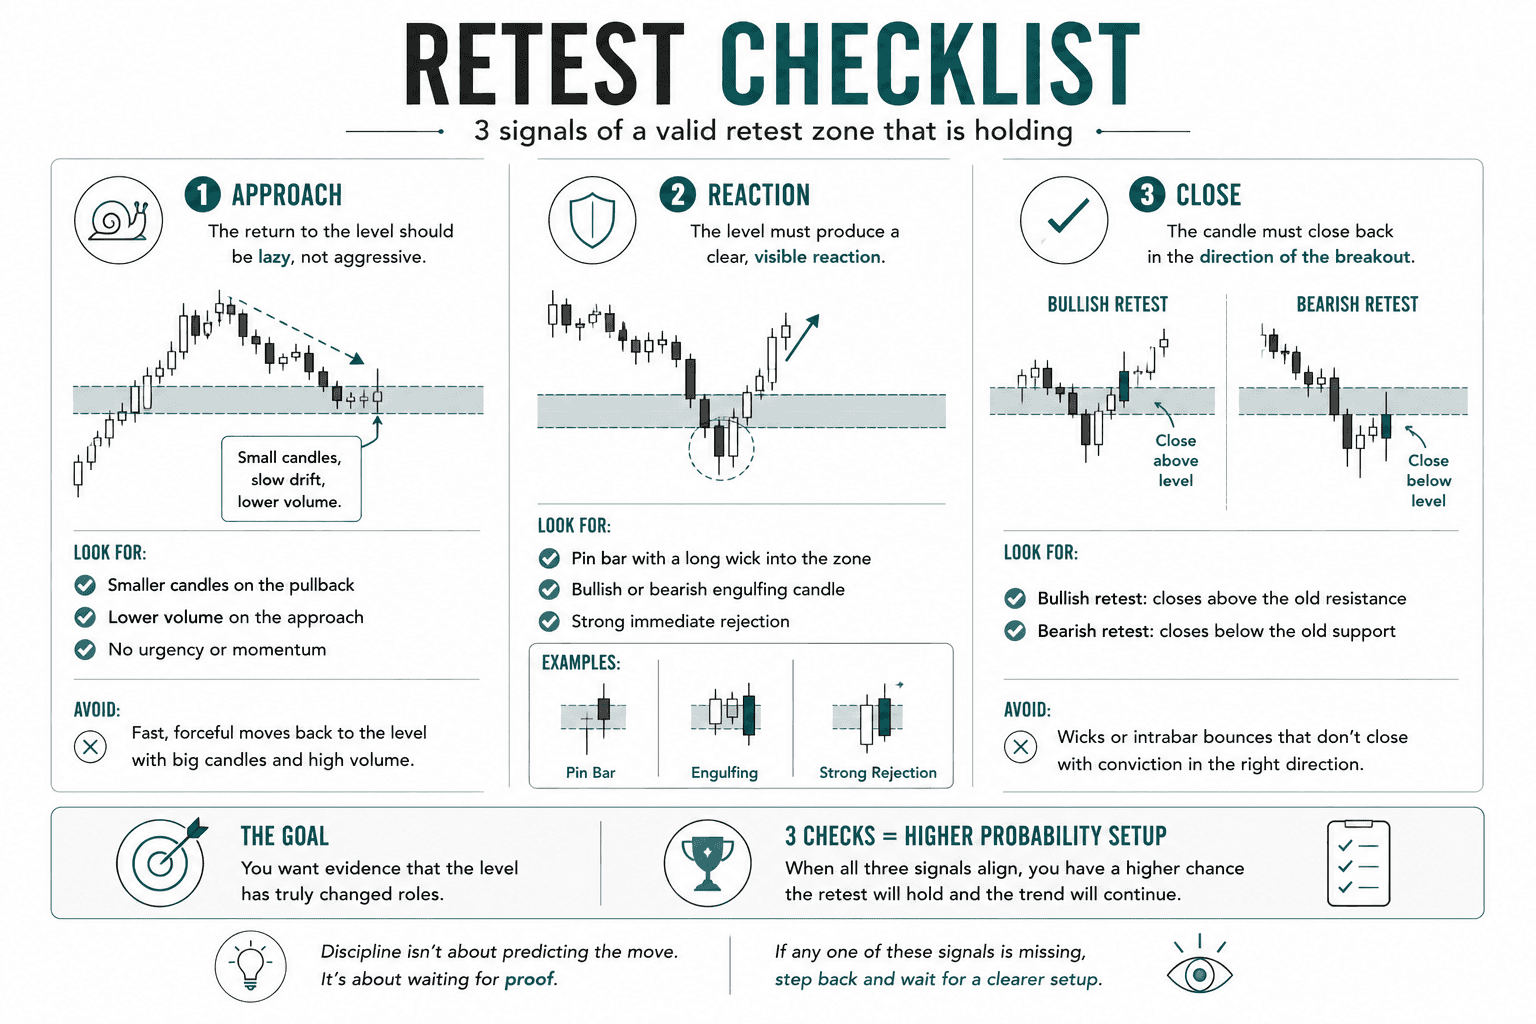
Just because price touches an old line doesn't mean you have a valid setup. Don't marry the first bounce you see. Look for these three signs:
The approach is lazy. The return to the level should feel like a slow drift, not a violent thrust. You want to see smaller candles and lower volume. If it's rocketing back toward the level with giant candles, get out of the way—that's not a retest, that's a collapse.
The level produces a visible reaction. You want to see immediate rejection when price hits the zone. Look for pin bars, nasty engulfing candles, or a strong close away from the line. The market needs to show some muscle.
The rejection closes in the direction of the break. For a bullish retest, the candle needs to close above the old resistance. For a bearish retest, it needs to close below the old support. No participation trophies allowed here; the close matters.
When Retests Fail (The Breakout was a Lie)
Sometimes, the retest completely fails. When it does, it usually means the initial breakout was a trap.
Bearish Retest Failure: Price breaks below support, comes back up to test it, and instead of dropping, it rockets right back above it. The "resistance" folded like a cheap lawn chair. That initial breakdown was likely just a stop-hunt to clear out retail traders.
Bullish Retest Failure: Price breaks above resistance, comes back to test it, and immediately sinks back beneath it.
The Aftermath: When a retest fails, the market usually moves aggressively in the opposite direction of the original break. Why? Because every single breakout trader who didn't wait for confirmation is now trapped and forced to panic-sell (or panic-buy) to close their positions, fueling the reversal fire.
Success Criteria
You’ll know you’ve mastered this concept when you can:
Explain the psychological "role reversal" mechanics behind why old resistance becomes new support (and vice versa).
List three visual confirmation signals that indicate a retest zone is actively holding.
Define a clear stop-loss placement rule based on a confirmed retest low/high.
Identify a failed retest pattern on a chart and explain why it often leads to a sharp reversal.
Common Misconception
The market always comes back to give you a perfect retest.
The Truth: It absolutely doesn't. Believing that a retest is a mandatory rule of physics will leave you stranded on the dock watching some of the market's biggest rocket ships sail away without you. High-momentum breakouts regularly blast off and never look back, which is why experienced traders learn to split their position sizes rather than praying for a textbook pullback that might never come.
FAQ's
Q: How close does price need to come to the line?
Q: Should I enter right at the touch, or wait for the candle to close?
Q: Does price always retest broken levels?
Table of Contents
About Me

Krista Weber
After a career as a VP of UX and EdTech executive, I retired early—and quickly realized the traditional world of trading education is fundamentally broken.
As someone with a Master’s in HCI who specialized in the design of e-learning systems, I saw a massive gap: beginners aren't failing because trading is impossible; they’re failing due to massive cognitive overload and terrible instructional design.
This site bridges that gap. I’m applying the principles of learning science, systems thinking, and minimalist UX to strip away the market noise and teach trading the way it actually should be taught.
Stay in Touch
Some of the pages on my travel blog contain affiliate links. Whenever you buy something through one of these links, I get a small commission at no extra cost to you. As an affiliate, I only recommend products and services that I feel are high quality and helpful to my readers. Thanks for your support.
Read More

Open almost any trading platform and you'll see EUR/USD sitting next to XAU/USD, NQ, ES, and a dozen CFDs on stocks you've heard of. They all show up as candlesticks moving left to right, which quietly implies they're all the same kind of thing. They aren't. Before going deeper into any one of them, it's worth drawing the map.
Updated on Sep 6, 2026

Futures are standardized contracts tied to defined specifications and a future settlement date. They can look complex at first, but the mechanics become much clearer once you know what the contract specification controls. Here's what you actually need to know.
Updated on Sep 6, 2026

CFDs appear everywhere in retail trading – but most new traders couldn't explain exactly what they are or why that matters. Here's a plain-language breakdown, including the parts that most introductions skip.
Updated on Sep 6, 2026