
Understanding Pips, Points, and Pipettes
The language of forex price movement runs through pips, the standardized unit for measuring how much a currency pair has moved. Before you can calculate risk, profit, or loss on any trade, you need to understand exactly what a pip is, how it differs across currency pairs, and how it translates into actual cash value in your account.
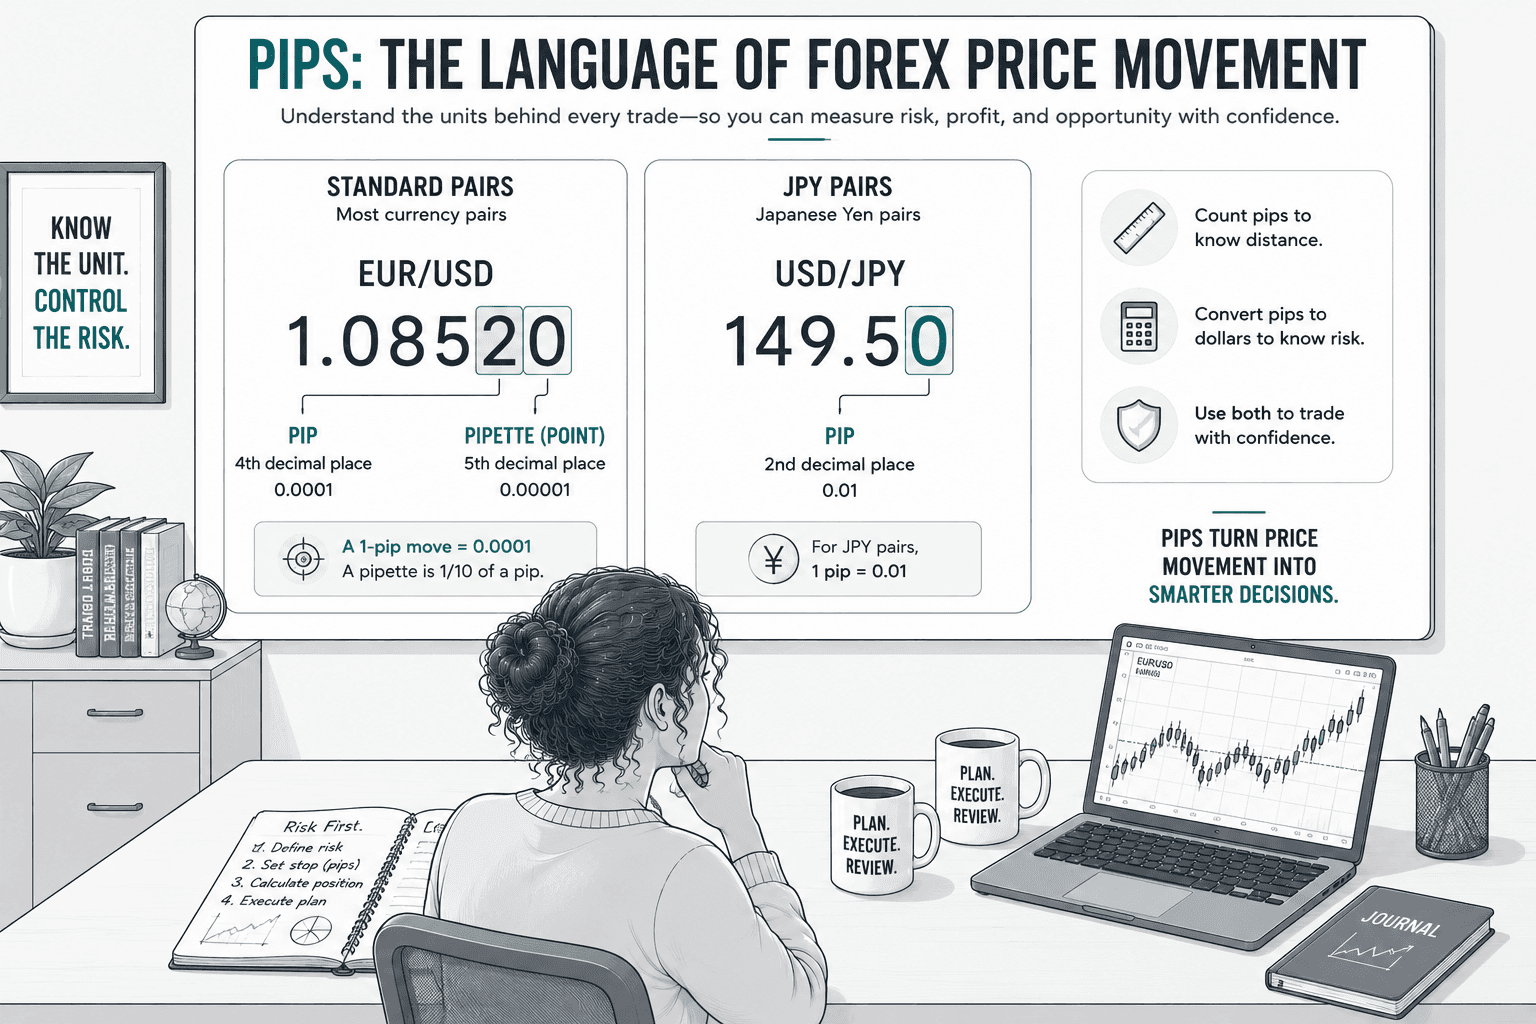
Learning Path Stage 1: Foundations
Learning Level 1: Recognition
Primary Learning Objective
By the end of this lesson, you will be able to define pips, points, and pipettes, differentiate between standard and JPY-quoted price movements, and calculate position size and dollar risk using pip values.
The Common Language of Price Movement
When traders say "EUR/USD moved 50 pips today" or "I'm setting a 30-pip stop loss," they are using pips to avoid head-spinning math. Comparing a 0.0050 shift in EUR/USD to a 0.50 move in USD/JPY without context would require mental gymnastics. Pips normalize the conversation so everyone speaks the exact same language.
The Standard: Four Decimal Places
For the vast majority of currency pairs, 1 pip=0.0001 (the fourth decimal place).
Price Move | Pip Count |
1.08500→1.08510 | 1 pip |
1.08500→1.08600 | 10 pips |
1.08500→1.09500 | 100 pips (1 big figure) |
1.08500→1.18500 | 1,000 pips (10 big figures) |
The Exception: JPY Pairs
All JPY-quoted pairs use the second decimal place as the pip benchmark (1 pip=0.01).
Because 1 dollar buys roughly 150 yen, using four decimal places for JPY would mean measuring movements in microscopic fractions of a single cent. Nobody has time for that level of precision when managing actual money.
Price Move | Pip Count |
149.50→149.60 | 10 pips |
149.50→150.50 | 100 pips |
149.50→151.00 | 150 pips |
Pipettes: The Extra Digit
Modern brokers love to show off five decimal places (or three for JPY). That final digit is the pipette, and unless you enjoy stressing over sub-penny fluctuations, you can mostly ignore it.
If EUR/USD is listed at 1.08523:
1.0852 is the four-decimal base price used for counting full pips.
3 is the pipette.
If price ticks from 1.08523 to 1.08531, it shifted 8 pipettes (or 0.8 pips).
When pipettes actually matter:
Evaluating Spreads: A broker offering a 1.2-pip spread (12 pipettes) is cheaper than one offering 1.5 pips (15 pipettes).
Precision Orders: Placing tight limit entries or stop-loss orders.
Scalping: High-frequency trading strategies where microscopic price shifts decide profitability.
Calculating Pip Value in Dollars
Counting pips is fun, but knowing how much money they represent in your account is what keeps you solvent.
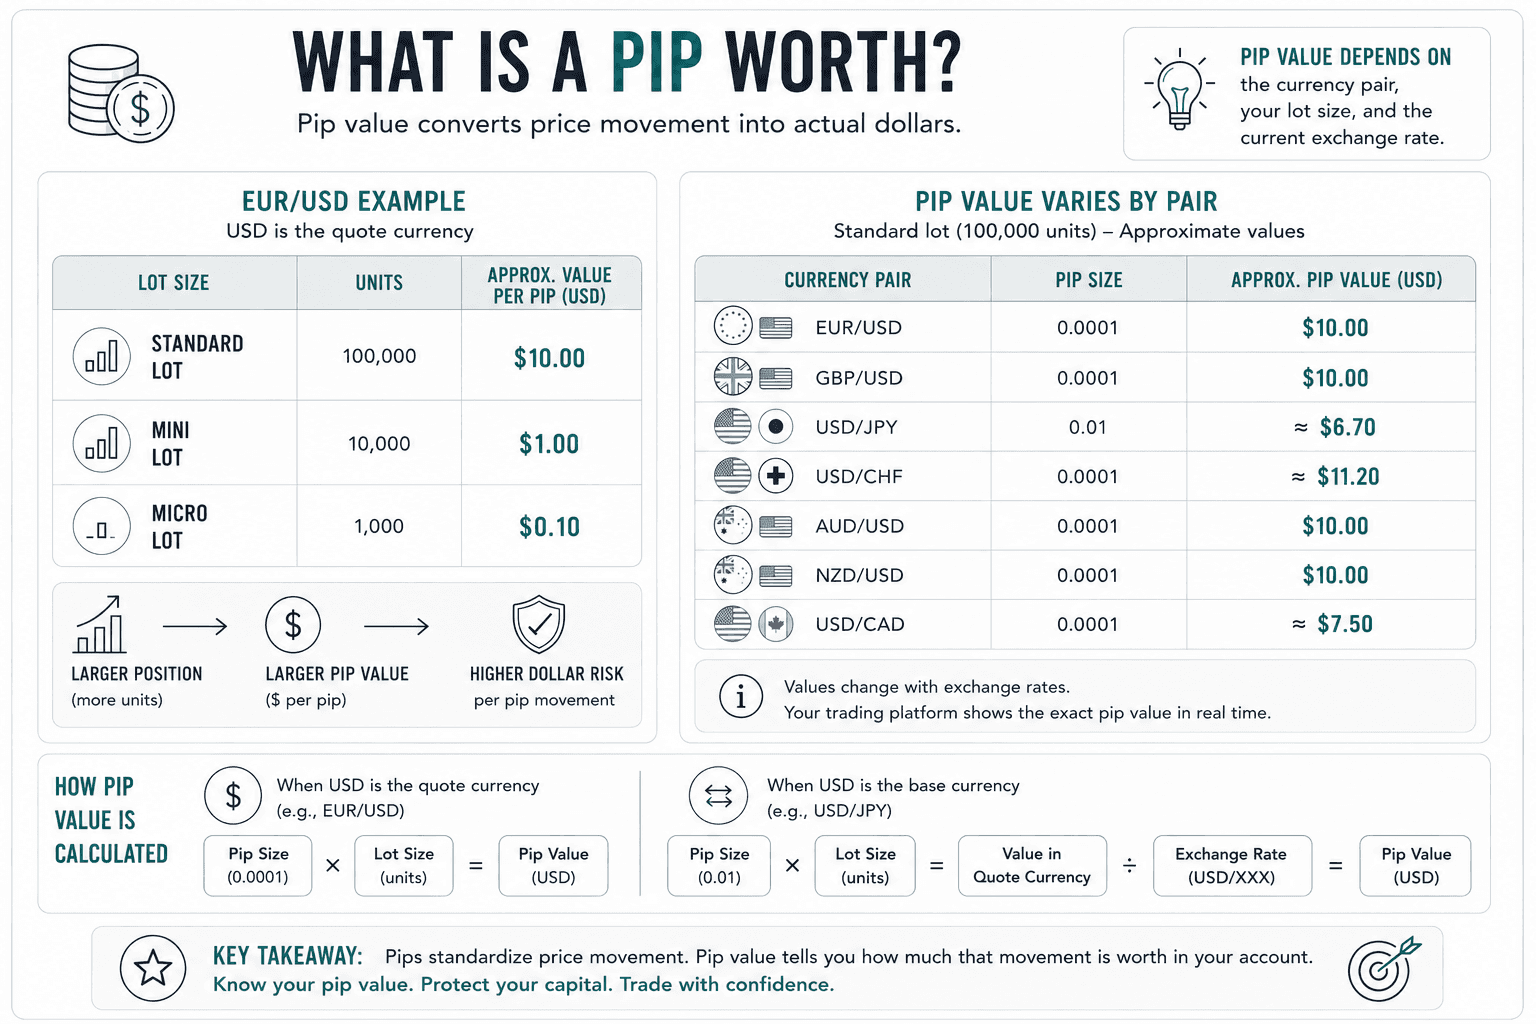
For pairs where USD is the quote currency (e.g., EUR/USD, GBP/USD):
Pip Value=Pip Size×Lot Size
Standard Lot (100,000 units): 0.0001×100,000=$10.00 per pip
Mini Lot (10,000 units): 0.0001×10,000=$1.00 per pip
Micro Lot (1,000 units): 0.0001×1,000=$0.10 per pip
When USD is the base currency (e.g., USD/JPY, USD/CAD), the pip value is initially calculated in the quote currency and then divided by the exchange rate.
Standard Lot Pip Values (Approximate)
Currency Pair | Approximate Pip Value (USD) |
EUR/USD | $10.00 |
GBP/USD | $10.00 |
USD/JPY | ≈$6.70 |
USD/CHF | ≈$11.20 |
AUD/USD | $10.00 |
NZD/USD | $10.00 |
USD/CAD | ≈$7.50 |
Connecting Pips to Risk
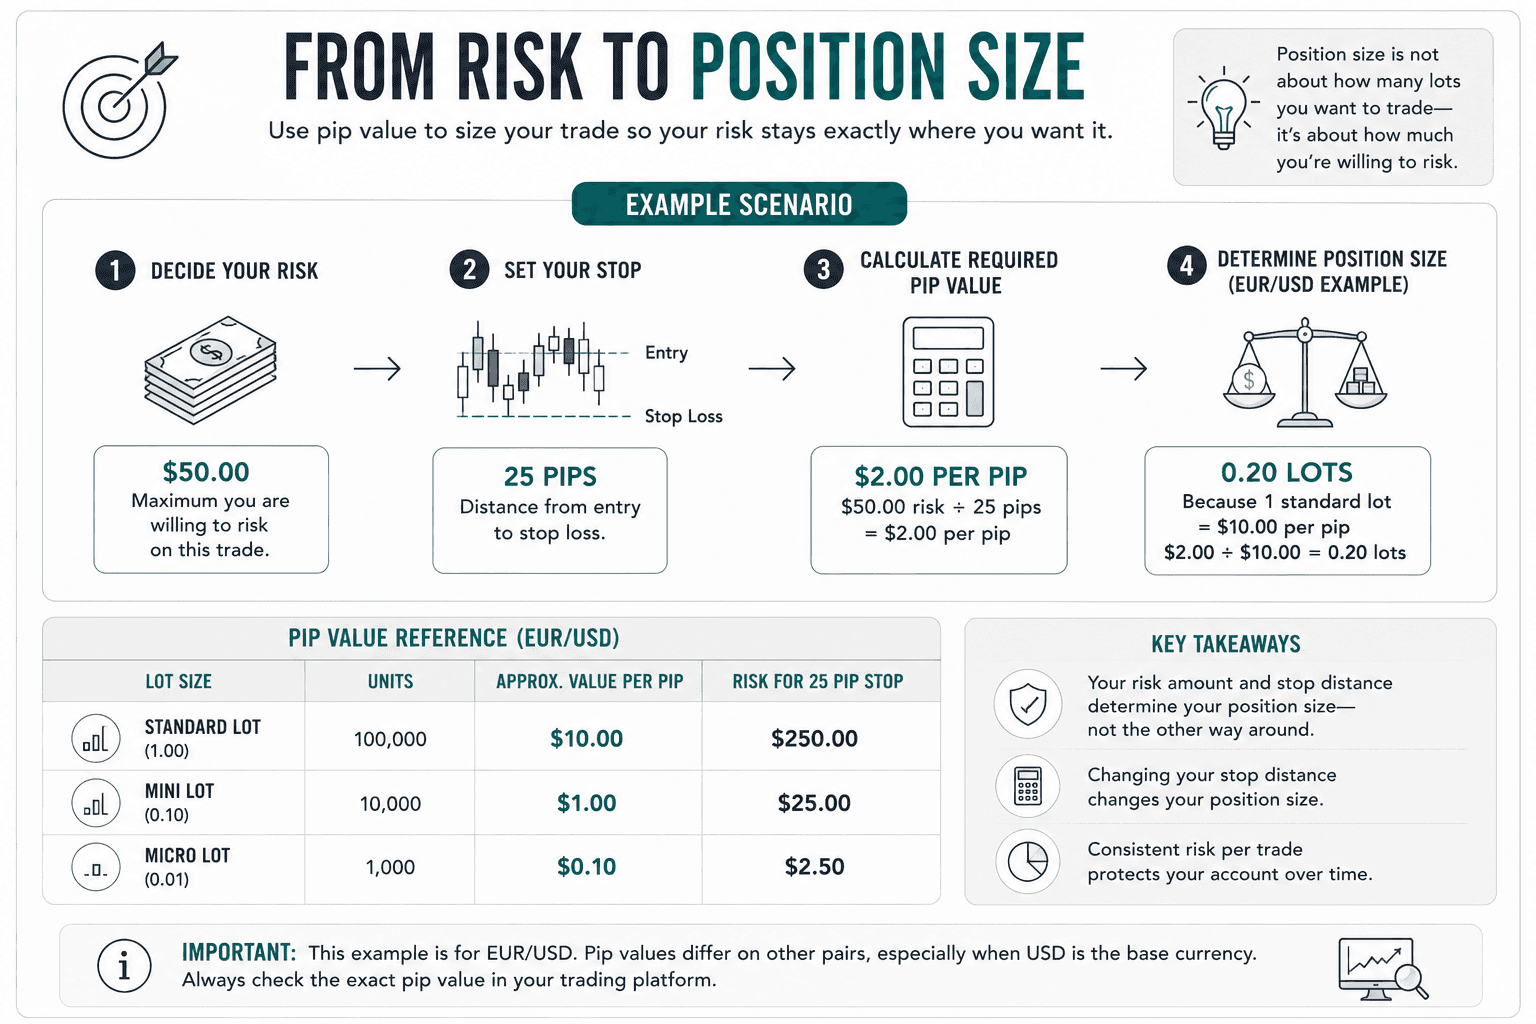
Pips are the core machinery of sound position sizing. Instead of guessing how many lots to trade, work backward from your risk tolerance:
You decide to risk a maximum of $50.00 on a trade.
Your technical analysis calls for a 25-pip stop loss.
You need a position size where 25 pips=$50.00 (which equals $2.00 per pip).
On EUR/USD, where a standard lot pays $10.00/pip, you trade 0.2 lots (2 mini lots).
A classic rookie mistake is using the exact same lot size on every trade regardless of stop distance. A 20-pip stop on a standard lot risks $200, whereas a 20-pip stop on a micro lot risks $2. Position size determines real risk, not the pip count alone.
Pips vs. Percentage Move
Pips track absolute distance, whereas percentages track relative change.
Pips excel at risk management because you can calculate dollar impact directly. However, when comparing overall volatility across different pairs, percentage shifts give better context:
A 50-pip move in USD/JPY (at 150.00) is roughly a 0.03% movement.
A 50-pip move in EUR/USD (at 1.0850) is roughly a 0.46% movement.
The exact same pip count can represent a mild nudge on one pair and a major breakout on another.
"Big Figures"
Traders refer to a 100-pip movement as "one big figure" because it changes the digit in the second decimal spot (e.g., EUR/USD moving from 1.0800 to 1.0900).
Major psychological levels tend to cluster around round big figures (1.0800, 1.0900, 1.1000). These levels attract clusters of limit orders and stop losses, often creating intense market reactions whenever price comes close.
Quick Reference Summary
Parameter | Standard Pairs | JPY Pairs |
Pip Location | 4th decimal place (0.0001) | 2nd decimal place (0.01) |
Pipette Location | 5th decimal place (0.00001) | 3rd decimal place (0.001) |
Standard Lot Pip Value | ≈$10.00 | ≈$6.70 |
100 Pips Equals | 1 "Big Figure" | 1 "Big Figure" |
Success Criteria
After completing this lesson, you should be able to:
Identify and explain the difference between a pip and a pipette across standard pairs (4th decimal place) and JPY pairs (2nd decimal place).
Calculate the exact dollar value per pip for standard, mini, and micro lots.
Apply pip calculations to set appropriate position sizes and stop-loss limits based on a predefined dollar risk amount.
Common Misconception
Pips are just a technicality, a piece of trading jargon to nod along to.
The Truth: In practice, understanding pip value is how you calculate actual risk in money terms before you open a trade. Skip it, and "30-pip stop" is a phrase with no dollar amount attached, which is a strange way to bet.
FAQ's
Q: What is a pipette and how does it differ from a pip?
Q: How much is a pip worth in dollars?
Q: What is a pip and how is it calculated?
Table of Contents
About Me

Krista Weber
After a career as a VP of UX and EdTech executive, I retired early—and quickly realized the traditional world of trading education is fundamentally broken.
As someone with a Master’s in HCI who specialized in the design of e-learning systems, I saw a massive gap: beginners aren't failing because trading is impossible; they’re failing due to massive cognitive overload and terrible instructional design.
This site bridges that gap. I’m applying the principles of learning science, systems thinking, and minimalist UX to strip away the market noise and teach trading the way it actually should be taught.
Stay in Touch
Some of the pages on my travel blog contain affiliate links. Whenever you buy something through one of these links, I get a small commission at no extra cost to you. As an affiliate, I only recommend products and services that I feel are high quality and helpful to my readers. Thanks for your support.
Read More

Open almost any trading platform and you'll see EUR/USD sitting next to XAU/USD, NQ, ES, and a dozen CFDs on stocks you've heard of. They all show up as candlesticks moving left to right, which quietly implies they're all the same kind of thing. They aren't. Before going deeper into any one of them, it's worth drawing the map.
Updated on Sep 6, 2026

Futures are standardized contracts tied to defined specifications and a future settlement date. They can look complex at first, but the mechanics become much clearer once you know what the contract specification controls. Here's what you actually need to know.
Updated on Sep 6, 2026

CFDs appear everywhere in retail trading – but most new traders couldn't explain exactly what they are or why that matters. Here's a plain-language breakdown, including the parts that most introductions skip.
Updated on Sep 6, 2026