
Stage 2: Reading Charts
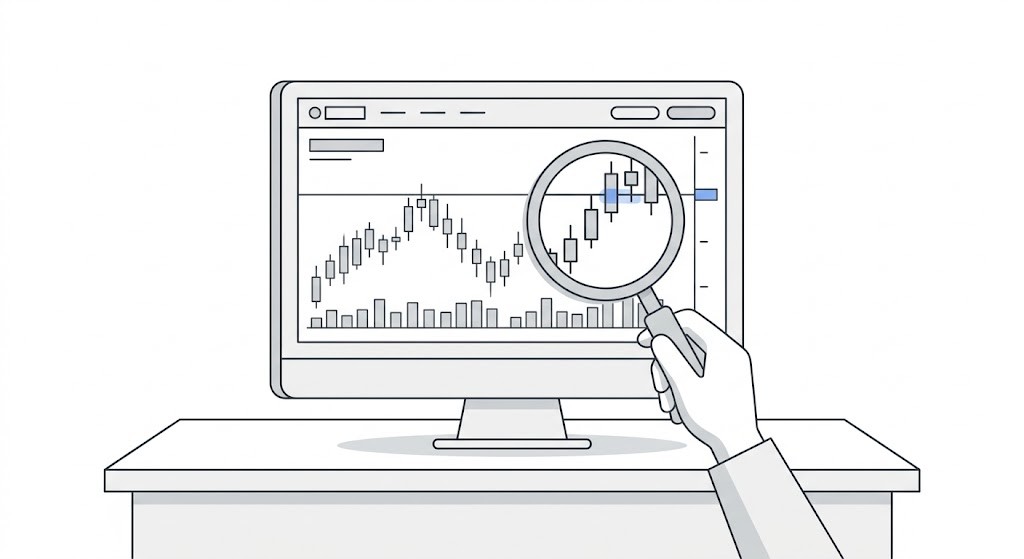
Price action, candlesticks, support and resistance, trend structure. This is where pattern recognition — a core UX skill — starts to click.
Latest Articles from Stage 2: Foundations

Evaluating Price Action Signals in Real Time
Reading a price action signal is one skill. Evaluating its quality while you are in the moment, under time pressure, without the benefit of hindsight is an entirely different one. This is where most intermediate traders stall.
Date Published:
Read Time:
11
minutes

Chart Reading: Identify the Regime First, Then Pick Your Trades
Most chart reading education teaches you how to read one type of market. The real skill is recognizing when the market has changed its character and adjusting what you look for, and how you read it, accordingly.
Date Published:
Read Time:
9
minutes

Developing a Personal Chart Reading Framework
At some point, applying someone else's chart reading framework starts to feel like wearing someone else's prescription glasses. Developing your own — built from tools that suit your perception and trading style — is how chart reading becomes genuinely fluent.
Date Published:
Read Time:
9
minutes
Candlestick Patterns That Actually Matter
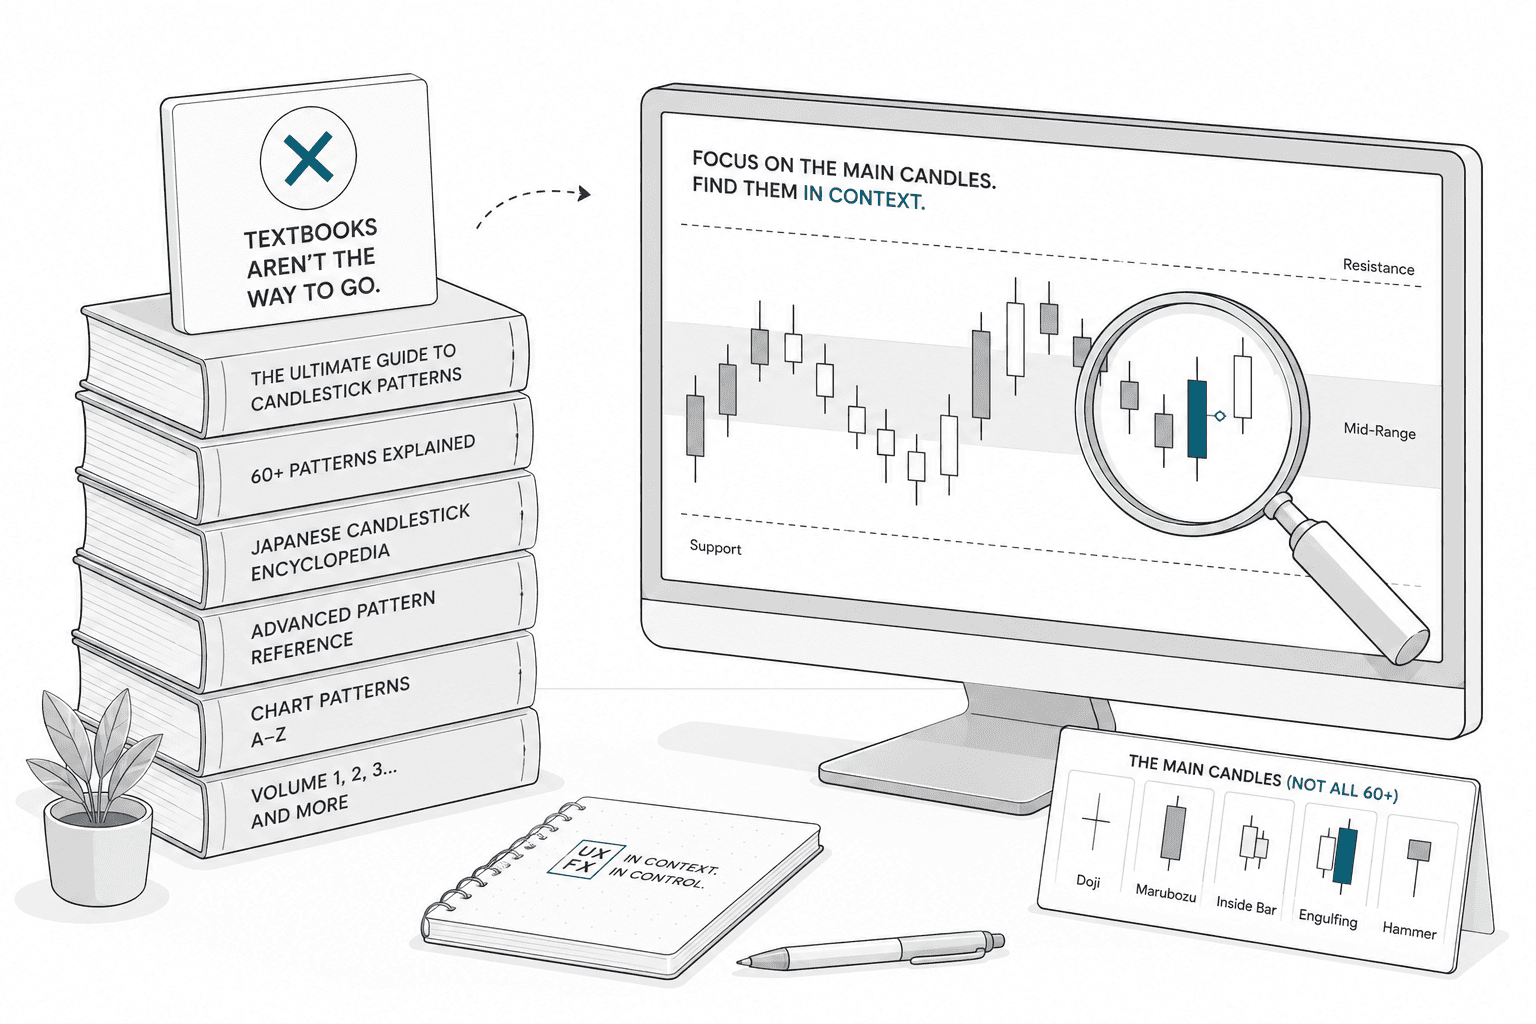
There are over 60 named candlestick patterns. Most of them don't matter. Here's the short list of patterns that consistently carry information — and what they're actually telling you about the market.
Date Published:
Read Time:
7
minutes

Bullish vs Bearish Candles Without the Drama
Bullish and bearish candles carry far more emotional weight than they deserve. They are records of one finished period, not predictions or moral events.
Date Published:
Read Time:
5
minutes
Why Candlestick Charts Exist
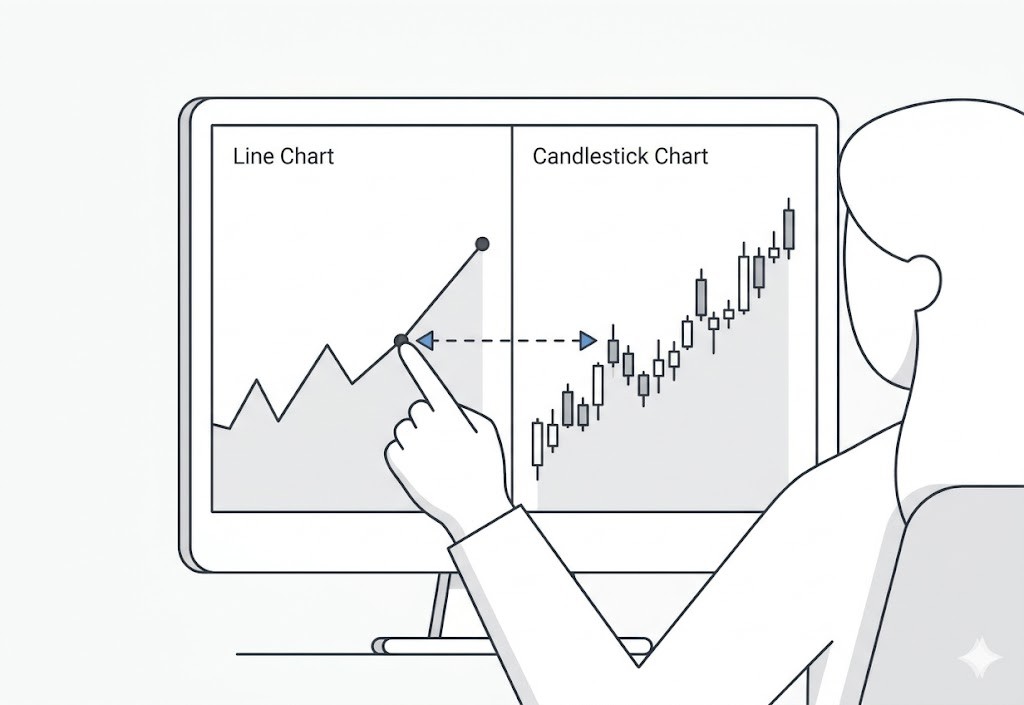
Most traders treat candlestick charts like a secret code of shapes to memorize. But they aren't secret signals. They’re just a compressed, visual record of a battle.
Date Published:
Read Time:
5
minutes
Support and Resistance for Beginners
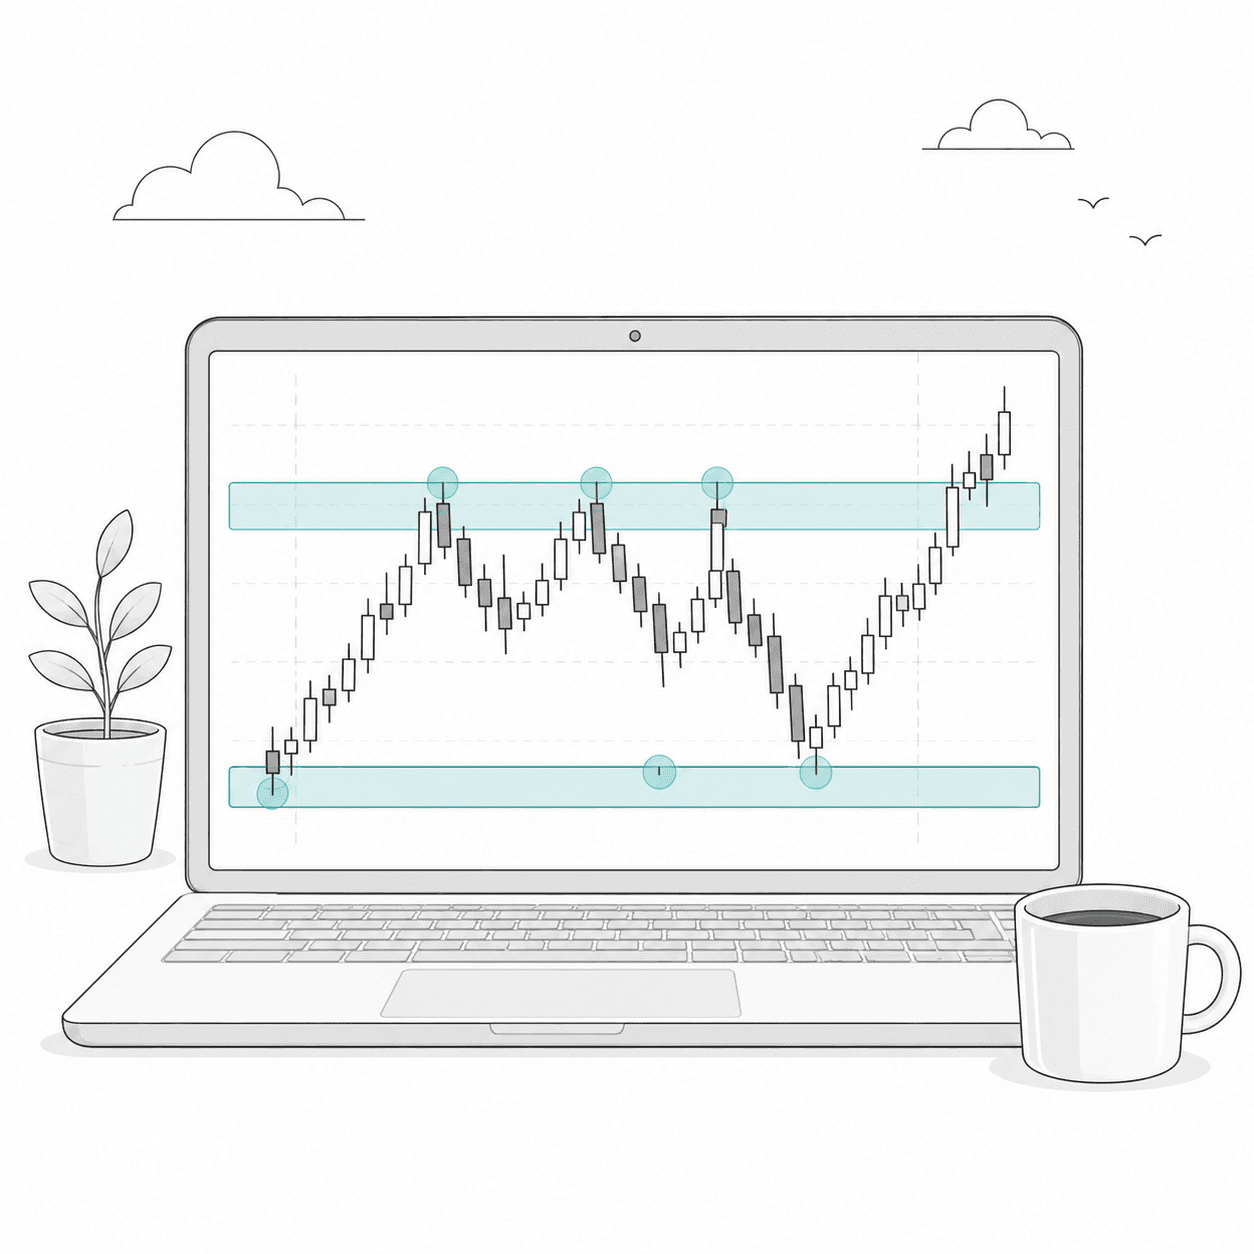
Support and resistance are often taught as lines on a chart, but they’re really about behavior. This beginner-friendly guide explains how traders use key price levels to understand crowd psychology, reduce cognitive overload, and make more structured decisions in the market. Without treating charts like financial astrology.
Date Published:
Read Time:
5
minutes
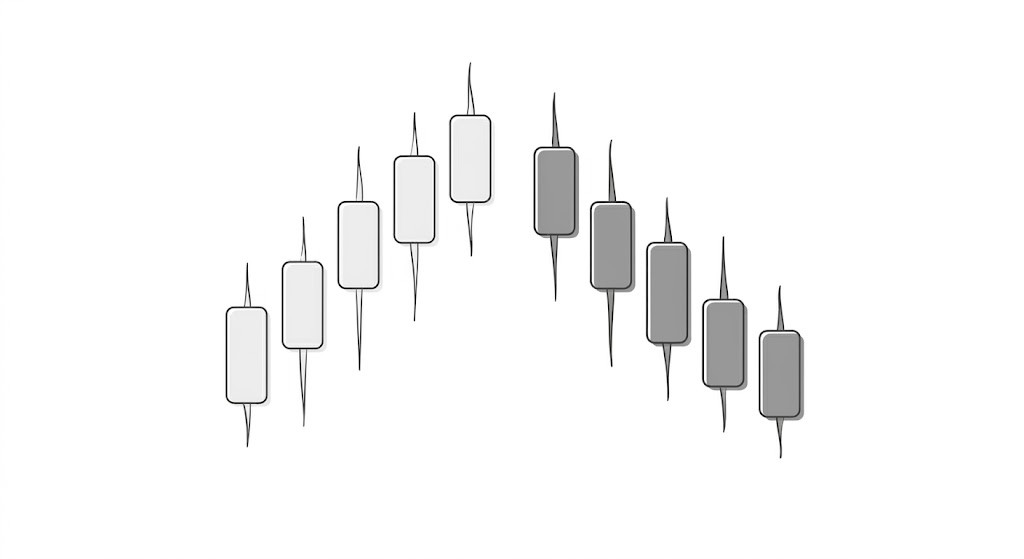
How I Actually Read a Candlestick Chart (Taught Like a UX Designer Would)
Not ‘a green candle means price went up.’ Let’s start with why this visualization exists; what information problem it was designed to solve.
Date Published:
Read Time:
8
minutes
Read More Stage 2 Articles
Reading a price action signal is one skill. Evaluating its quality while you are in the moment, under time pressure, without the benefit of hindsight is an entirely different one. This is where most intermediate traders stall.
Updated on Jul 4, 2026
Most chart reading education teaches you how to read one type of market. The real skill is recognizing when the market has changed its character and adjusting what you look for, and how you read it, accordingly.
Updated on Jul 3, 2026
At some point, applying someone else's chart reading framework starts to feel like wearing someone else's prescription glasses. Developing your own — built from tools that suit your perception and trading style — is how chart reading becomes genuinely fluent.
Updated on Jul 3, 2026