
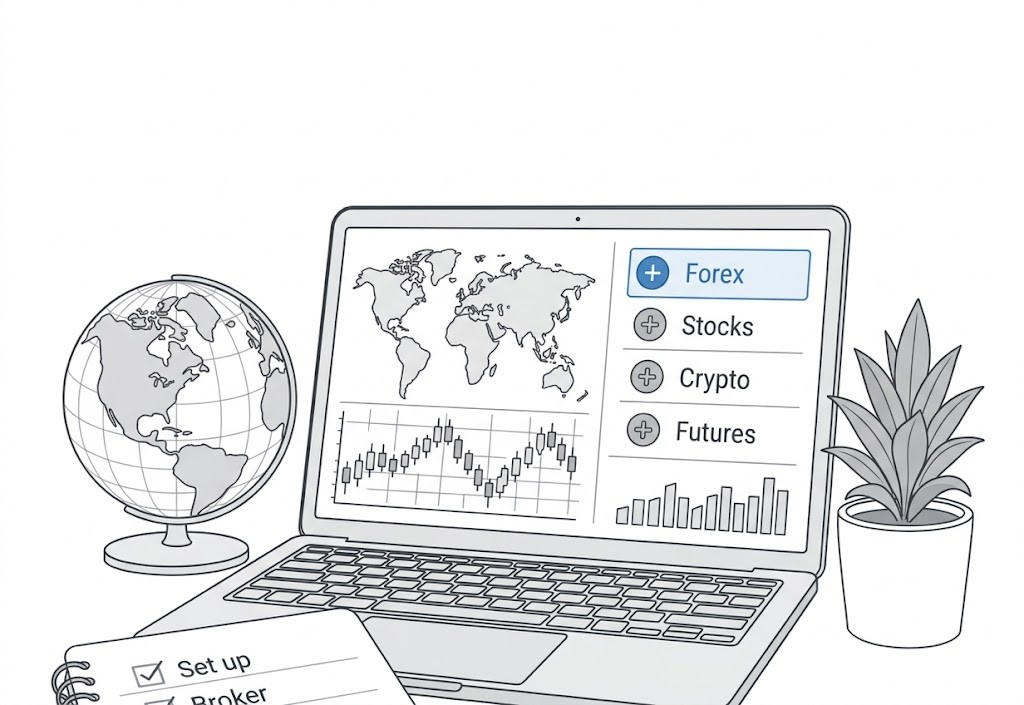
Stage 1: Foundations
Price action, candlesticks, support and resistance, trend structure. This is where pattern recognition — a core UX skill — starts to click.
Latest Articles from Stage 1: Foundations

Your First Week Paper Trading (What to Expect)
Your first week in a trading platform is genuinely disorienting. Prices move in ways that don't match what you read. Decisions that seem obvious in hindsight aren't obvious in real time. This is completely normal . Here's what to actually expect, so you can make the most of the learning curve rather than fighting it.
Date Published:
Read Time:
5
minutes

How to Evaluate What You Think You Know About Trading
The internet delivers confident trading knowledge at industrial scale. Most of it is untested, some of it actively harmful. Developing the ability to evaluate what you're being taught, and what you think you've learned, is one of the most useful meta-skills in trading.
Date Published:
Read Time:
5
minutes

How to Critically Read a Backtest
A backtest can make almost any strategy look profitable. Knowing what makes a backtest meaningful (and what makes it misleading) is a foundational skill for evaluating any system you encounter or build yourself.
Date Published:
Read Time:
9
minutes
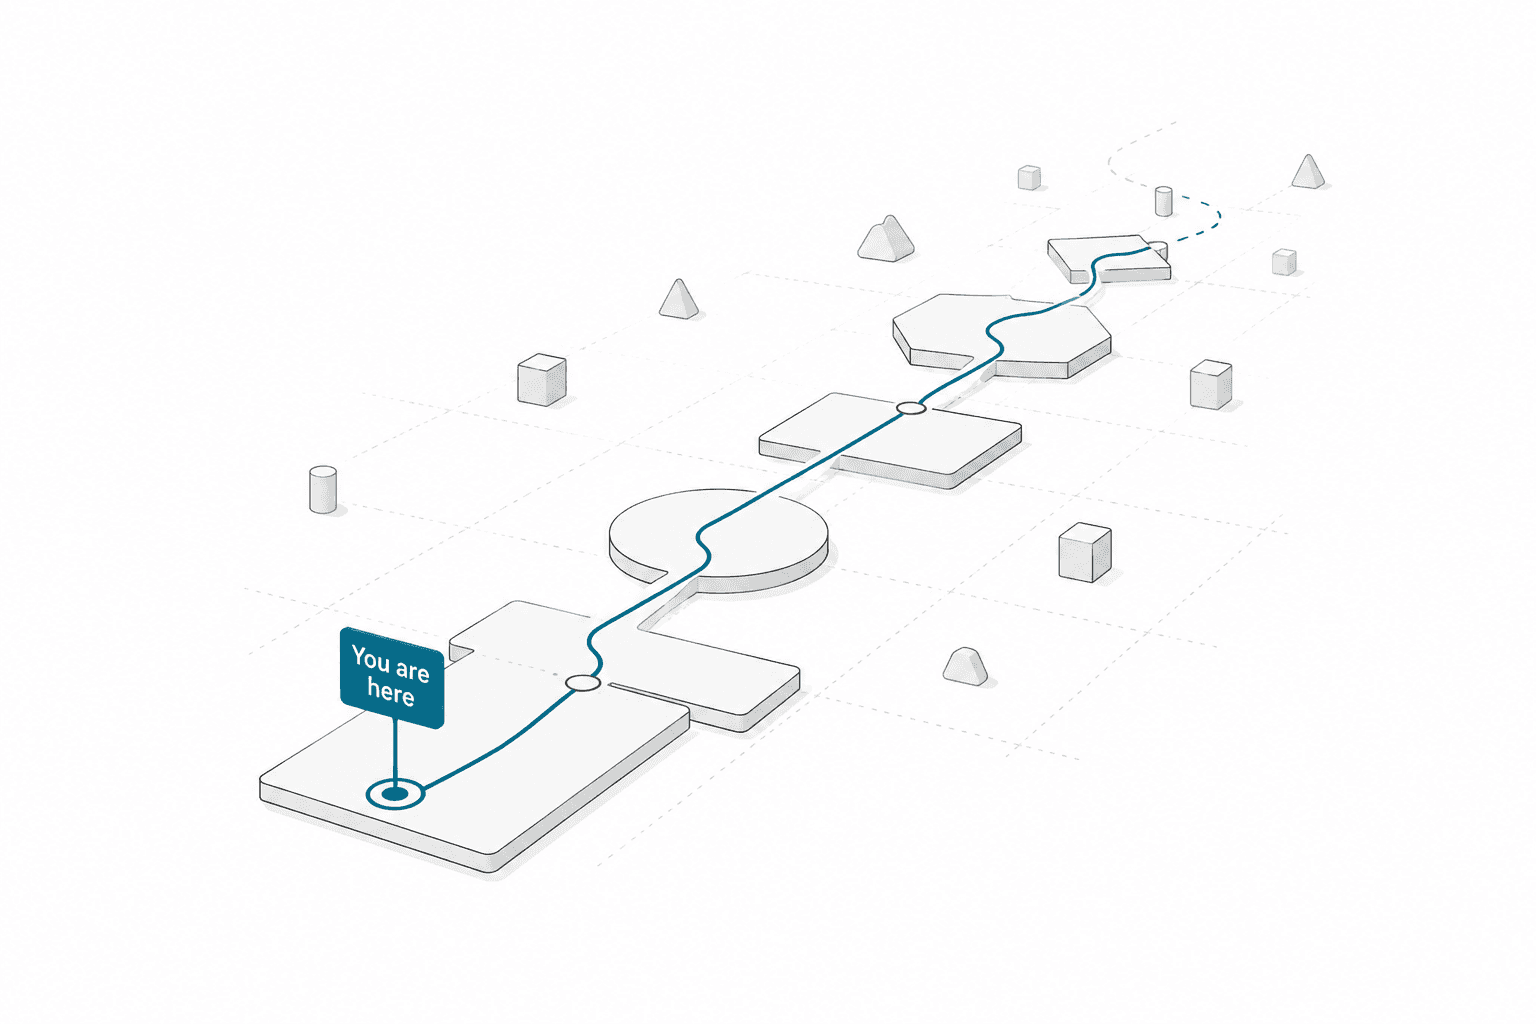
The UX to FX Learning Journey
The content is organized in two ways: by topic and by learning level. Topics are things like chart patterns, risk management, and trading psychology. Learning levels describe how deeply you're engaging with those topics, and they follow a specific sequence, because that sequence helps you reach higher levels of learning.
Date Published:
Read Time:
5
minutes

How to Choose a Forex Broker
The broker you choose affects your execution quality, your costs, the safety of your funds, and the instruments available to you. This isn't a decision to make by Googling "best forex broker" and clicking the first affiliate result. Here's what actually matters.
Date Published:
Read Time:
5
minutes

Forex Factory for Beginners
Forex Factory is the most widely used economic calendar and forum in retail forex trading. Here's what it is, what it shows, and how to read it without being overwhelmed.
Date Published:
Read Time:
5
minutes

The True First Step: The School of Pipsology
Why the BabyPips School of Pipsology is the place to start learning about trading.
Date Published:
Read Time:
5
minutes
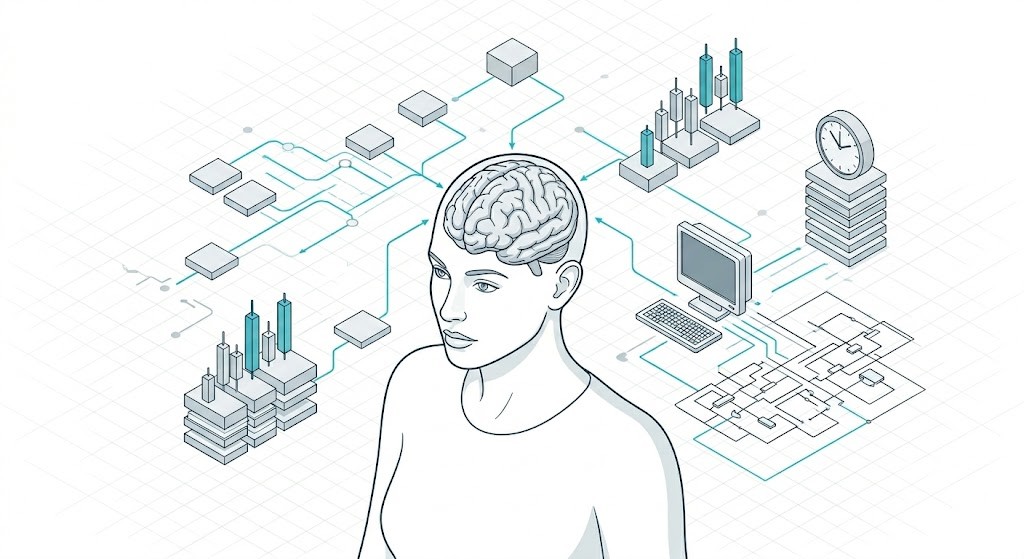
Why Learning Trading Takes Longer Than People Think
Learning trading takes longer than most people expect. Not because the material is overly complex, but because understanding something and being able to operate inside it are two very different things. Early progress feels real, but it’s mostly recognition. The actual learning begins later, when decisions happen under uncertainty, feedback is inconsistent, and nothing behaves as cleanly as the explanation did.
Date Published:
Read Time:
7
minutes

Start Trading Education for Free (Here's Your Exact Setup)
You don’t need to spend thousands on courses, prop firm fees, or fancy setups to learn trading well. A breakdown of what free actually looks like.
Date Published:
Read Time:
12
minutes

What Nobody Tells Women Over 40 About Getting Into Trading
The trading space is crowded with young faces. Here’s what it actually looks like to come to this with decades of professional experience — and no pressure to perform.
Date Published:
Read Time:
5
minutes
Read More Stage 2 Articles

Support isn’t a magical, invisible forcefield that price respects out of politeness. It’s a messy psychological battleground. Specifically, it’s a price area where, historically, enough buyers have shown up with their wallets open to halt a downward slide. Once you learn to identify who these buyers are and track their behavior, support stops being something you blindly hope holds and becomes something you can actually read
Updated on Jul 17, 2026
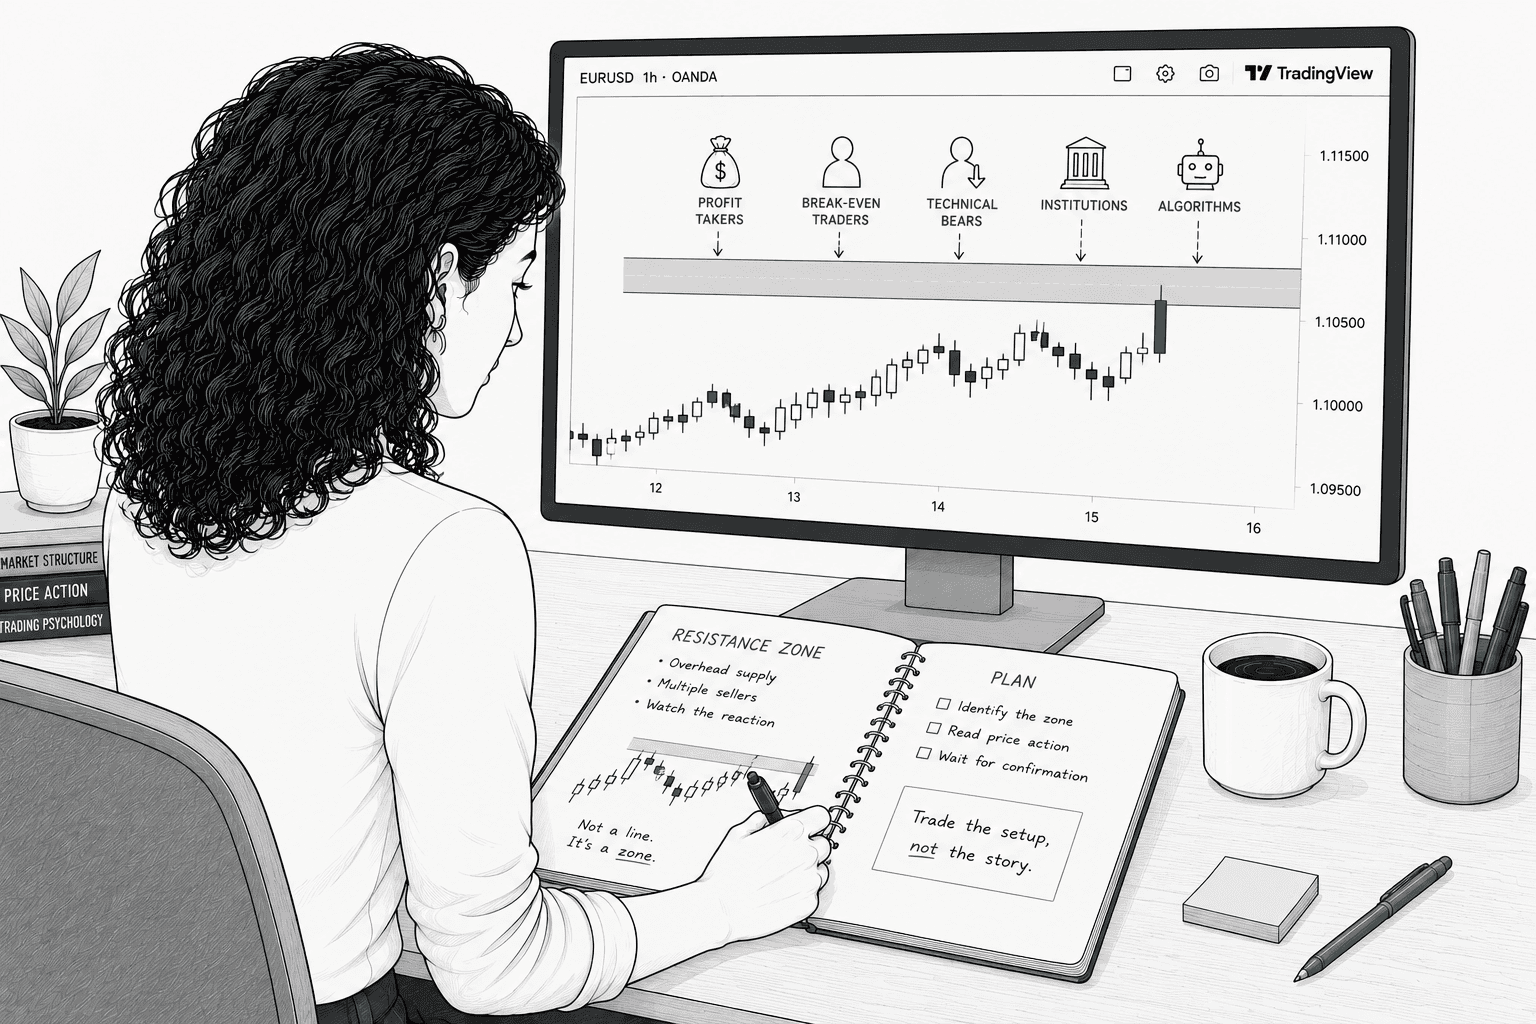
"Stops going up" isn't market magic or a spooky supernatural event. It’s the direct result of specific selling decisions made by specific human beings (and their robotic overlords) at a specific price for highly predictable reasons. Once you can name those reasons, resistance stops being a random line you're crossing your fingers and hoping holds. Instead, it becomes a map you can actually read.
Updated on Jul 17, 2026

A level tested many times isn't necessarily stronger than a fresh one. It's more recognized, and recognition creates both opportunity and risk... Many experienced traders watch for exhaustion at frequently-tested levels rather than assuming they'll hold forever.
Updated on Jul 20, 2026