

Stage 6: Find Your Strategy
Discover what kind of trader you are and which strategies fit how you think.
Latest Articles from Stage 6: Find Your Strategy

Breakout Trading Part 1: What Is Breakout Trading?
Breakout trading is exactly what it sounds like: trading the moment when price moves through a significant level with momentum. It's one of the most intuitive strategies available and one of the most commonly misapplied. Here's what it is at its clearest.
Date Published:
Read Time:
5
minutes
Breakout Trading Part 2: How it Works
Breakout trading is the practice of entering a position the moment price moves beyond a defined level of support or resistance. It sounds simple, and it is, in structure. The challenge is that most breakouts are false.
Date Published:
Read Time:
7
minutes
Breakout Trading Part 3: Why It's Popular
Breakout trading attracts beginners for obvious reasons and retains experienced traders for less obvious ones. Understanding both sides of the appeal helps you evaluate whether the approach is right for where you are in your development.
Date Published:
Read Time:
5
minutes
Breakout Trading Part 4: Legitimate Learning Resources
Breakout trading resources are abundant and generally high quality — partly because the approach is old enough to have accumulated genuine practitioner wisdom, and partly because the mechanical nature of breakouts makes them highly teachable.
Date Published:
Read Time:
8
minutes
Breakout Trading Part 5: Backtesting and Metrics
Date Published:
Read Time:
5
minutes
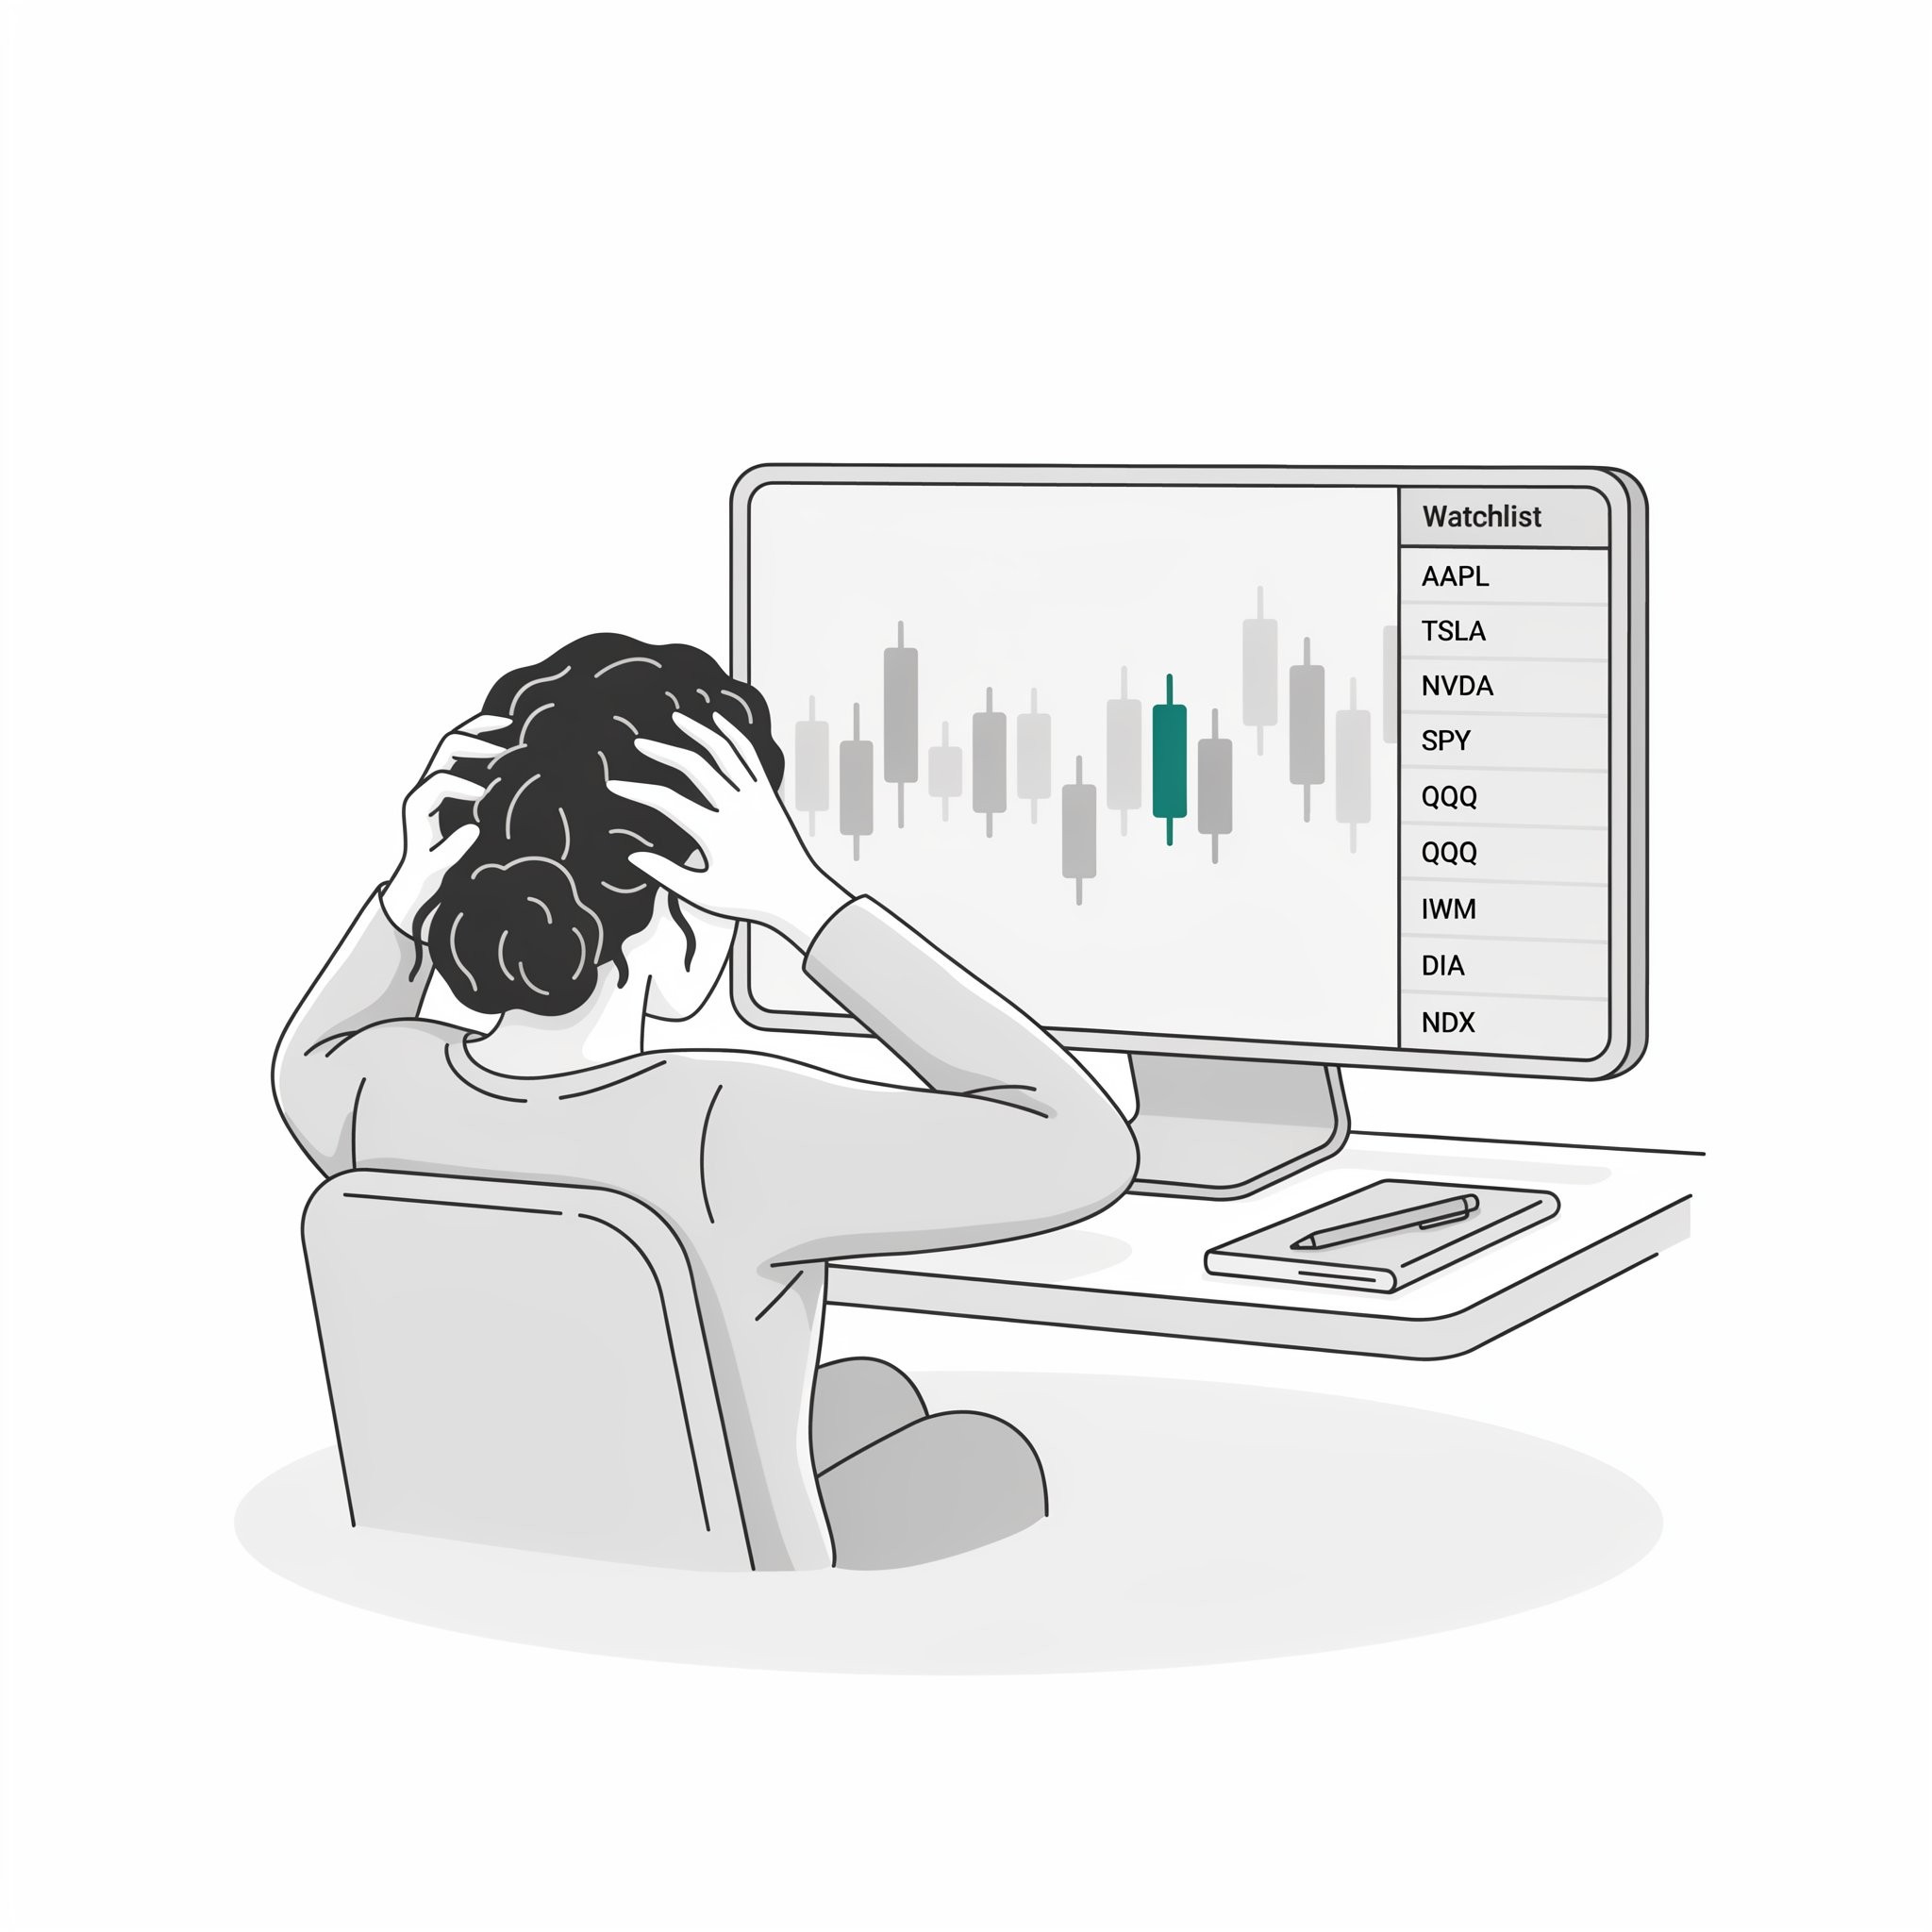
Building Your FX Watchlist
A watchlist is not just a list of markets to watch. It's a decision about where to concentrate your attention and build expertise. Watching too many instruments spreads attention thin; watching too few limits opportunity. The process of building a focused, deliberate watchlist is part of building a trading approach that's actually sustainable.
Date Published:
Read Time:
5
minutes

The Strategy Fit Audit: Which Approach Matches How You Think?
Most traders pick a strategy based on what they've seen on YouTube. This audit helps you choose one based on something more reliable: how your brain actually works.
Date Published:
Read Time:
5
minutes

What Even Counts as a Trading Strategy?
Before exploring individual strategies, it's worth asking a more fundamental question: what actually counts as a trading strategy? The answer shapes everything.
Date Published:
Read Time:
5
minutes

Why Strategy Fit Matters More Than Strategy Performance
Why matching a strategy to your cognitive style matters more than finding the 'best' one.
Date Published:
Read Time:
5
minutes

How This Series Is Organized (And How to Use It)
A map of the 16 trading strategies covered in this series, organized by level and cognitive demand.
Date Published:
Read Time:
5
minutes
Read My Stories

Support isn’t a magical, invisible forcefield that price respects out of politeness. It’s a messy psychological battleground. Specifically, it’s a price area where, historically, enough buyers have shown up with their wallets open to halt a downward slide. Once you learn to identify who these buyers are and track their behavior, support stops being something you blindly hope holds and becomes something you can actually read
Updated on Jul 17, 2026
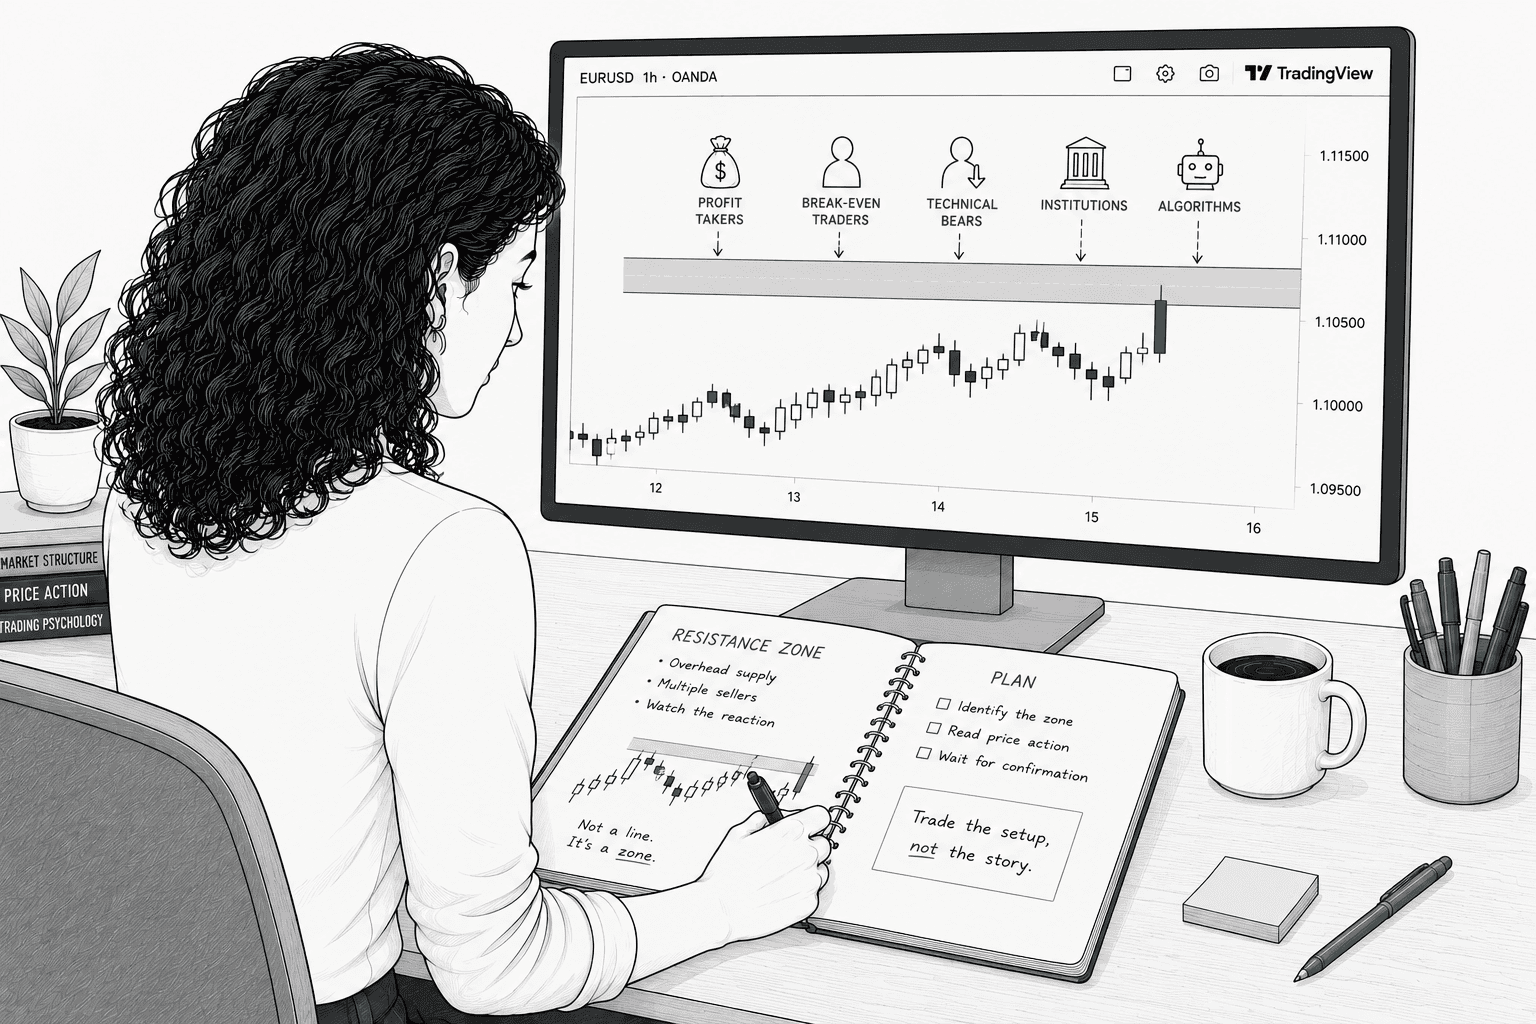
"Stops going up" isn't market magic or a spooky supernatural event. It’s the direct result of specific selling decisions made by specific human beings (and their robotic overlords) at a specific price for highly predictable reasons. Once you can name those reasons, resistance stops being a random line you're crossing your fingers and hoping holds. Instead, it becomes a map you can actually read.
Updated on Jul 17, 2026

A level tested many times isn't necessarily stronger than a fresh one. It's more recognized, and recognition creates both opportunity and risk... Many experienced traders watch for exhaustion at frequently-tested levels rather than assuming they'll hold forever.
Updated on Jul 20, 2026