
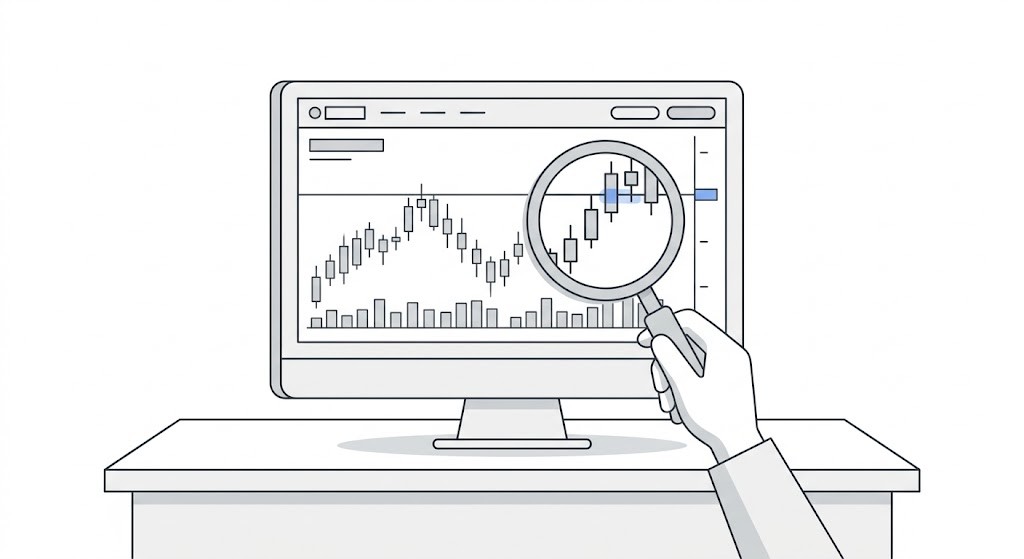
Stage 2: Reading Charts
Price action, candlesticks, support and resistance, trend structure. This is where pattern recognition — a core UX skill — starts to click.
Latest Articles from Stage 2: Foundations

What the Dollar Index (DXY) Tells You
DXY measures the dollar against a specific six-currency basket. Used carefully, it adds context to a dollar pair without becoming a second vote for a trade you've already decided to like.
Date Published:
Read Time:
9
minutes

What Is Correlation in Forex?
Opening trades on three pairs can feel more diversified than opening one. There are three charts, three entries, and probably three reasons that sounded sensible at the time. But the dollar may be appearing in all three positions, quietly doing most of the work.
Date Published:
Read Time:
5
minutes
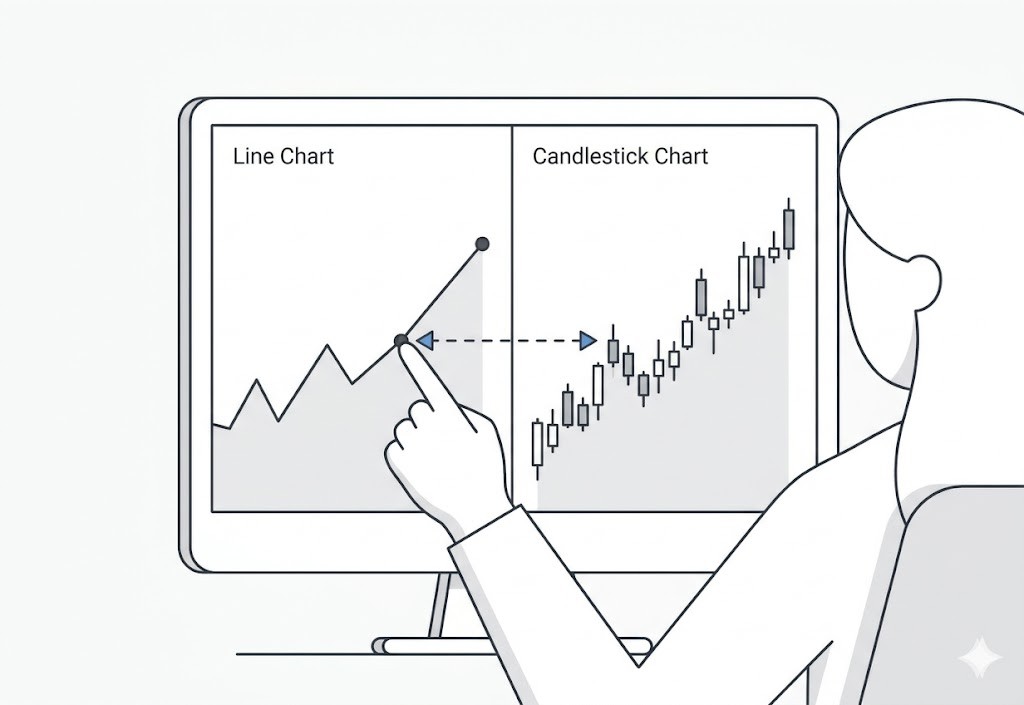
Why Candlestick Charts Exist
Most traders treat candlestick charts like a secret code of shapes to memorize. But they aren't secret signals. They’re just a compressed, visual record of a battle.
Date Published:
Read Time:
5
minutes
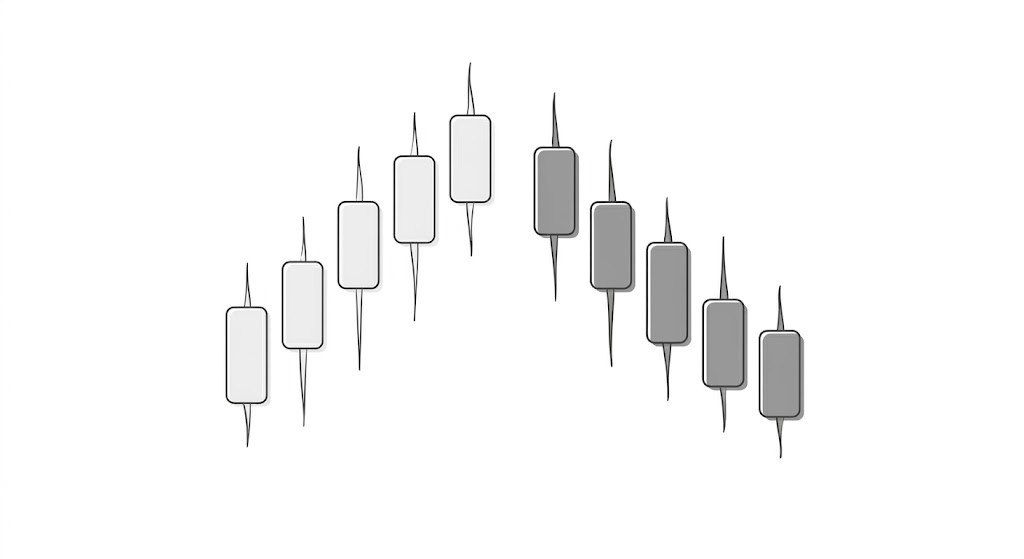
How I Actually Read a Candlestick Chart (Taught Like a UX Designer Would)
Not ‘a green candle means price went up.’ Let’s start with why this visualization exists; what information problem it was designed to solve.
Date Published:
Read Time:
8
minutes
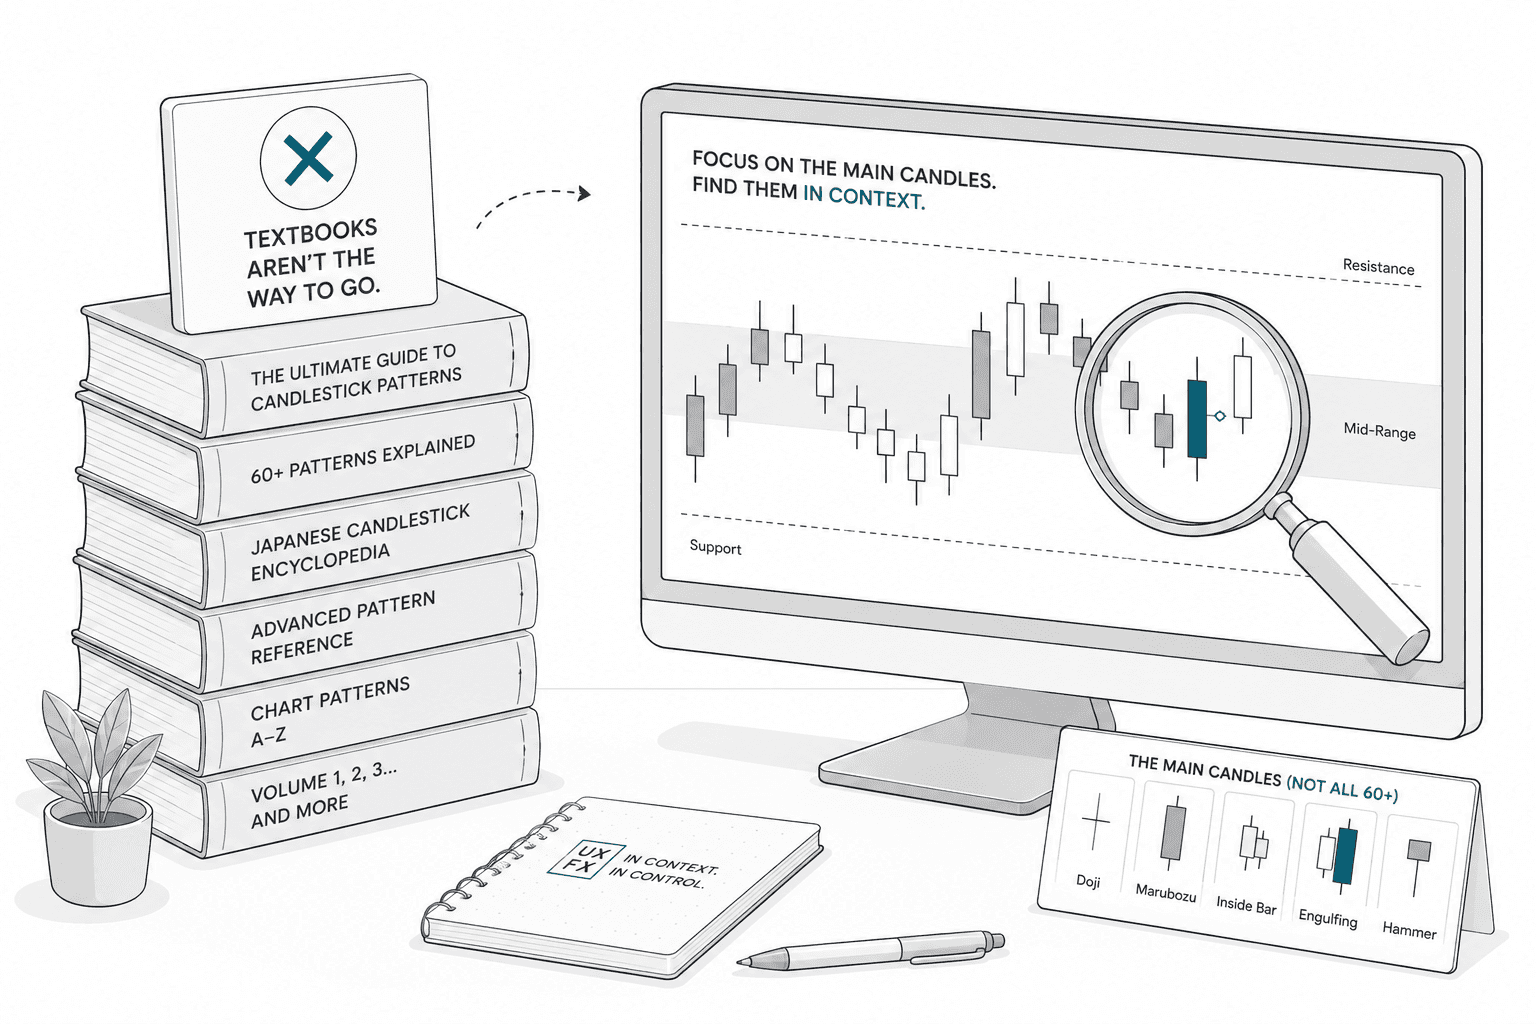
Candlestick Patterns That Actually Matter
There are over 60 named candlestick patterns. Most of them don't matter. Here's the short list of patterns that consistently carry information — and what they're actually telling you about the market.
Date Published:
Read Time:
7
minutes

Bullish vs Bearish Candles Without the Drama
Bullish and bearish candles carry far more emotional weight than they deserve. They are records of one finished period, not predictions or moral events.
Date Published:
Read Time:
5
minutes

Chart Reading: Identify the Regime First, Then Pick Your Trades
Most chart reading education teaches you how to read one type of market. The real skill is recognizing when the market has changed its character and adjusting what you look for, and how you read it, accordingly.
Date Published:
Read Time:
9
minutes

What Buyers and Sellers Are Actually Doing at Support
Support isn’t a magical, invisible forcefield that price respects out of politeness. It’s a messy psychological battleground. Specifically, it’s a price area where, historically, enough buyers have shown up with their wallets open to halt a downward slide. Once you learn to identify who these buyers are and track their behavior, support stops being something you blindly hope holds and becomes something you can actually read
Date Published:
Read Time:
6
minutes
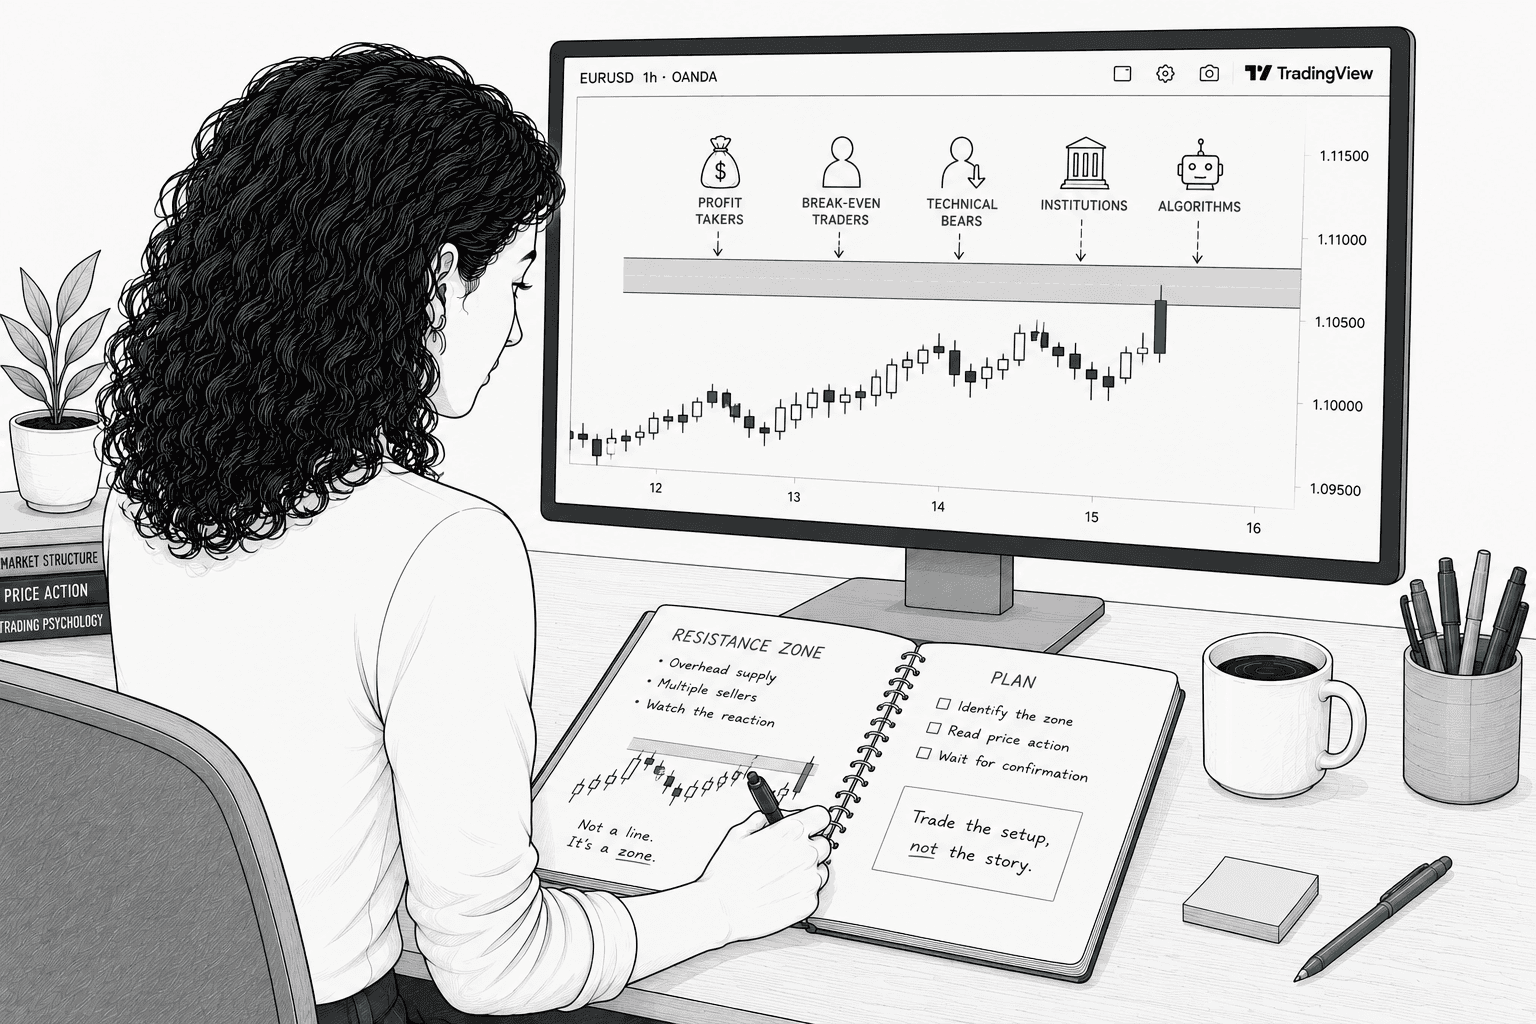
What Buyers and Sellers Are Actually Doing at Resistance
"Stops going up" isn't market magic or a spooky supernatural event. It’s the direct result of specific selling decisions made by specific human beings (and their robotic overlords) at a specific price for highly predictable reasons. Once you can name those reasons, resistance stops being a random line you're crossing your fingers and hoping holds. Instead, it becomes a map you can actually read.
Date Published:
Read Time:
5
minutes

Support & Resistance: Why Repeated Tests Matter
A level tested many times isn't necessarily stronger than a fresh one. It's more recognized, and recognition creates both opportunity and risk... Many experienced traders watch for exhaustion at frequently-tested levels rather than assuming they'll hold forever.
Date Published:
Read Time:
5
minutes
Read More Stage 2 Articles
DXY measures the dollar against a specific six-currency basket. Used carefully, it adds context to a dollar pair without becoming a second vote for a trade you've already decided to like.
Updated on Nov 3, 2026
Opening trades on three pairs can feel more diversified than opening one. There are three charts, three entries, and probably three reasons that sounded sensible at the time. But the dollar may be appearing in all three positions, quietly doing most of the work.
Updated on Nov 3, 2026
Most traders treat candlestick charts like a secret code of shapes to memorize. But they aren't secret signals. They’re just a compressed, visual record of a battle.
Updated on May 24, 2026